Still a week to go, but I was getting a little nervous and wanted to take a look anyway.
We know from this post from CXO what to look for at the beginning of April, but what about the rest of the month?
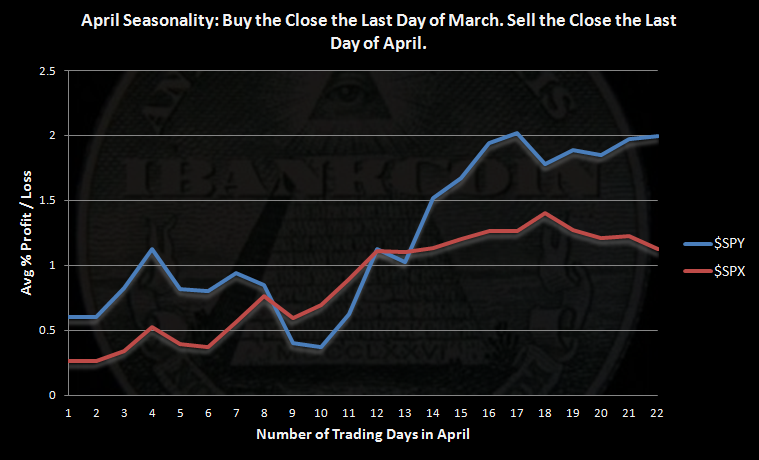
Click on the chart to enlarge. Calculations start at the close of the last trading day of March and end on the close of the last trading day of April.
$SPX data goes back to 1928. $SPY data goes back to 1993. The two sets of data demonstrate how April seasonality has changed recently, if recently is over the last 20 years.
April Statistics for $SPY ($SPX)
- Average Monthly Profit/Loss = 2.00% (1.12%)
- Winning Months= 70.00% (60.00%)
- Worst April = 2002 loss of -5.9% (1932 loss of -14.8%)
- Best April = 2001 gain of +9.4% (1933 gain +31.0%)
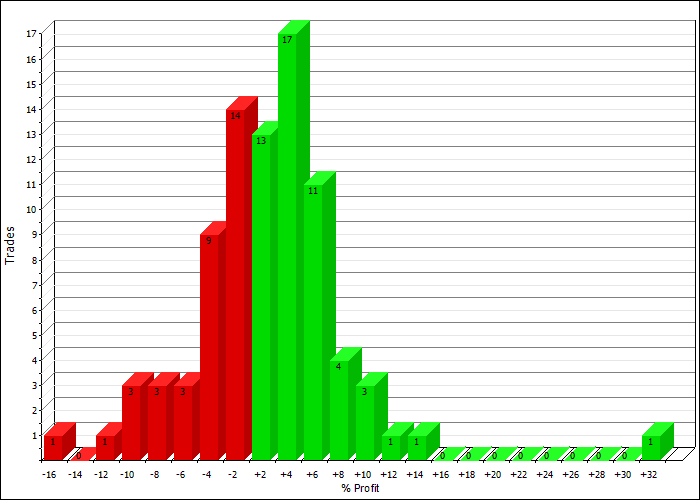
Profit Distributions:
Equity Curve:
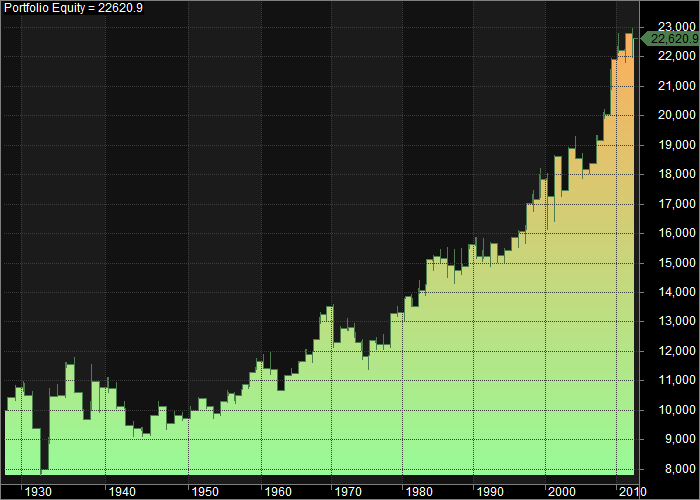
April returns since 2007 have been excellent. Last year was the first losing April since 2005. My belief in mean reversion has me betting that April 2013 will be a loser.


Sorry, I’m confused. The worst April is 2000, and the best April is also 2000?
I’m definitely surprised we have had so many winning Aprils over the past 8 years, given the volatility, I have to agree with you on mean reversion here.
Whoops, sorry Bozo, error on my part. I will have to fix it this evening! Good catch!
Fixed.
Ah, makes sense now. I’m surprised how large the gains were during periods that are generally thought of as bearish.
Thanks for the update.