The financial pundit class is abuzz with Dow Jones histrionics. Let’s break the history out into some graphs and stats to see what all the fuss is about.
The Rules:
- Buy the Dow Jones Industrial Average ($DJI) at the Close after 9 Consecutive Higher Closes
- Sell X Days Later
- $DJI History Starts in 1910
- No Commissions or Slippage Included
The Results:
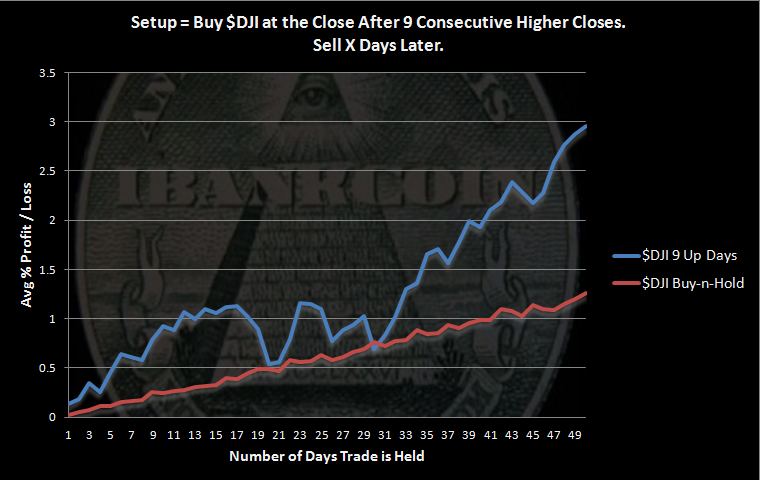
The results are incredibly bullish.
The graph above is constructed by taking all of the trades and averaging them together. This allows us to see what has happened, day by day, after this setup occurred in the past. There were 45 setups with 34 held the full 50 days.
Note that below I list that there were 66 instances of 9 consecutive higher closes. The graph above only uses 45 because some the setups were followed by a 10th higher close, which also doubles as another instance of 9 consecutive higher closes. The trade would have already been on when the 10th consecutive higher close was made. In other words, the graph above is generated by buying the 1st instance of 9 consecutive higher closes and holding that trade for 50 days. Each of these trades are then averaged together.
Some stats:
- Number of times in history $DJI has made 9 consecutive higher closes: 66
- Highest % gain after 9 consecutive higher closes: 9.85% on 1.3.1992
- Lowest % gain after 9 consecutive higher closes: 1.46% on 2.3.1965
What happens if we trade this as a system, buying after the setup and holding each trade for 50 days?
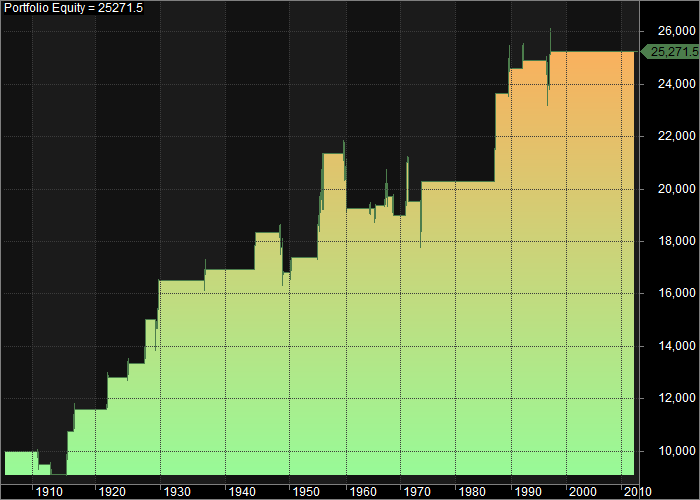
That equity curve shows a fairly consistent bullish edge over a 100 year period!
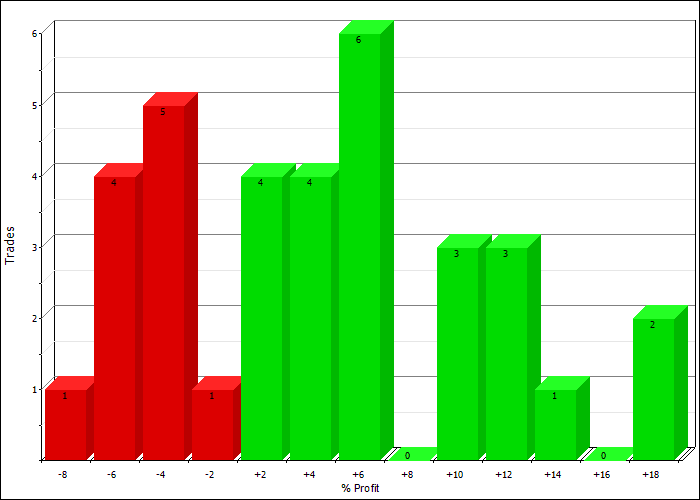
Some more stats:
- Percentage of Winning Trades: 64.71%
- Average Winning Trade: 6.65%
- Average Losing Trade: -3.81%
Trade Distributions:
The bottom line is that the $DJI making 9 consecutive higher closes is incredibly bullish.
What a fantastic time to be involved in the markets. This is the first time this has happened in the 21st century. The last time it occurred was on 11.14.1996.


Love your blog and tweets. What does it mean when you say 34 where held for 50 days? Why wouldn’t all 45 samples be held?
Thanks!
Good question. Let me see if I can explain it clearly this late at night.
Lets say we have 9 consecutive higher closes and a trade is made. Okay, next evening we have a 10th consecutive higher close. Within those 10 consecutive higher closes are 2 instances of 9 consecutive higher closes. The system can only take 1 though because it can only hold one trade at a time. UNLESS the first trade is only held one day. Then it can buy the second instance. So in that example, if each trade were held for one day, you’d have 2 trades made. However, if each trade were held longer than 1 day, only 1 trade made, even though there were 2 occurrences or setups.
That is the basic idea.
What the software is doing is simply taking all instances of the setup and looking out X days, while recording each day’s result, and then averaging the results. The larger the number X is, the fewer the number of trades. Within a 50 day period, there may have been 3 instances of 9 consecutive higher closes. If each trade is only held 5 days, all three of those trades might be made. However, if each trade is held for the full 50 days, only one trade is logged even though there were 3 occurrences.
I hope that makes sense.
So in this case 11 of the 45 samples went on to make 10 new highs or more?
Thanks for doing this! How are these parameters set? You say held for x days, but what does that mean? Are there stop loss parameters?
Also, the next question is of course when does it get bearish? 10 days? 11 days? 20? What’s the most up days in history??
The most I see is one instance of 13 consecutive higher closes in January of 1987.
I see approximately 4 streaks of 11 consecutive and one 12 consecutive.
There are several streaks of 10 consecutive.
I’m just visually looking through the data. Just got home from work and don’t have time right now to write something to automate the process.
Jp, I do not remember the exact number making 10 day consecutive higher closes. I’m at work and don’t have the stats with me.
I’ll update with that figure tonight.
Thx for the explanation
Derrick, it means that it sells at the close at the end of that day. No stop losses or anything else. It buys the setup at the close and then sells at the close X days later.
I don’t have the stats with me. Will update later tonight.
Always enjoy your work, Woody.
Is it possible for you to extend the holding period to 100 days? Thanks in advance!
Wood, since everyone else is hitting you with questions, I’ll add mine. You’re buying at the close using closing data, right? That would imply once in a while you might execute a buy (a real buy, not on paper, at maybe 5 minutes before the market closes) when in fact the market reverses a few seconds before the close and the buy was in error. I know many people using buy-at-close (or sell-at-close) trading systems have this issue and seem to ignore it. In my own models I always assume you know whether the close will be up or down before the market actually closes, but that may not be a good assumption.
What are your thoughts on the impact of these mistakes? Or do you correct it in AH trading?
Yes, buying at the close using OHLC data.
When I was actively trading at the close, and this was for a period of a couple of years, I experienced that scenario fairly often. And the worse thing about it is that in order to be guaranteed the closing price, in my experience, I had to use a MOC order (market-on-close). I used Interactive Brokers and all MOC orders had to be placed by 3:40 in order to be guaranteed the closing price. I believe I was able to cancel them, but if they were not placed by the cutoff, there was no guarantee of getting the actual listed close.
I often considered correction in AH trading, but often these were individual stocks and were not liquid AH. If we are talking about SPY or other very liquid names or ETFs, I think correcting in AHs makes sense.
These types of mistakes, and heck, there are many worse ones (I’ve went long instead of short and vice versa, 100 shares instead of 1000, etc.) are important to factor. IMO, if you factor the possible mistakes made with a few trades not placed due to not trusting the system and then some generous slippage and commissions, it becomes evident why it is so hard to trade systems profitably.
Like any automated process, it has to be done correctly, consistently, and without error if we want to come anywhere close to backtested results.