Almost one year ago, I wrote about an Asset Class Rotational Model that trades ETFs. I recently got an email from someone asking me about it, and the email reminded me that it would be a good time to check in on how the system has performed over the past year.
The quickest way to understand how the system works is to read Mebane Faber’s article: A Simple Momentum System for Beating the Market.
I have re-run the test, with the same rules as when I ran it last on 2.19.12.
- Commissions and slippage were not included
- No implementation of a moving average filter
- No return on cash
- The top 5 ETFs were held
Results:
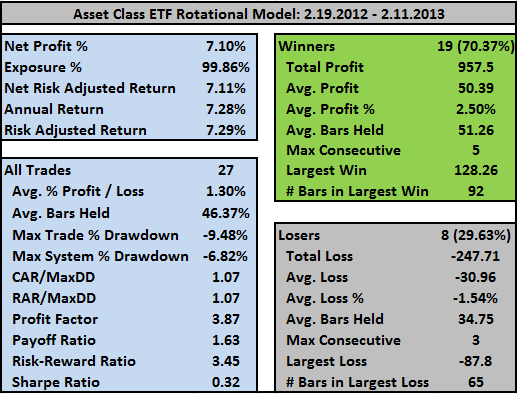
With $SPY achieving an 11% return over the same time frame, results are not stellar.
However, if we look at the Asset Class ETF Rotational System 2012 results (assuming the system ran without stopping since beginning in 2003), it returned 10.6% vs. 11.47% for $SPY. This is not quite as bad, but once commissions and slippage are factored in, we could safely shave another 1% off the return. All the caveats of the original post still apply.
The good news is that the system appears to be working fine; it just couldn’t beat its benchmark.
Later this week I’ll add a moving average filter and then use Faber’s suggestion of limiting total positions to 3 rather than 5. One addition I would really like to test is to make sure the system is not picking ETFs that are highly correlated. I’m not sure how to implement this in AmiBroker, so if anyone wants to work with the code to implement it, send me an email to woodshedder73 at gmail.


I’ve been using the Darwin Strategy since last May. It uses the 2 best performing assets over the last 6 months. Tested it going back to 2007, it’s made positive returns every year.Here’s a link
http://www.advisorperspectives.com/dshort/guest/BP-120507-How-to-Beat-the-Market.php
I don’t use correlation or value, just momentum.
I didn’t know my real name would appear, could you change it to donmat?
Yes it didn’t beat the benchmark – most systems like this won’t – but what did the drawdowns look like in comparison to the benchmark?
Damien,
CAR/MaxDD for Buy and Hold over the same period was 1.17
Donmat, thanks. Are you adjusting for volatility as their report suggests they are doing?
No, just using momentum. Not quite sure how they adjust, and don’t think it would be practical for an individual account.
I’m guessing this is how they are adjusting for volatility: http://www.advisorperspectives.com/dshort/guest/BP-120508-Volatility-Management.php
I like that idea. I might try it in lieu of a moving average filter, which is really just a much more crude form of risk management.
Easy way – Take daily/weekly returns and divide by the daily/weekly standard deviation to get risk adjusted returns.
Peanut, yeah, but that is not what they are doing. They are reducing exposure based on volatility.
I see now. Based on this statement:
Changes in volatility are depicted by the heat bar at the bottom, the brighter the red the higher the volatility and consequently the larger the cash component.
So maybe they’re just increasing their cash position as ATR/ROC/etc on volatility increases? Probably no best way to do it.
Interesting though – thanks for the link – I’ll take a deeper look this weekend.