The S&P 500 is continuing a steady climb higher. As much as I love to see it, the action is definitely not a surprise. I outlined here and here where I thought the market was headed.
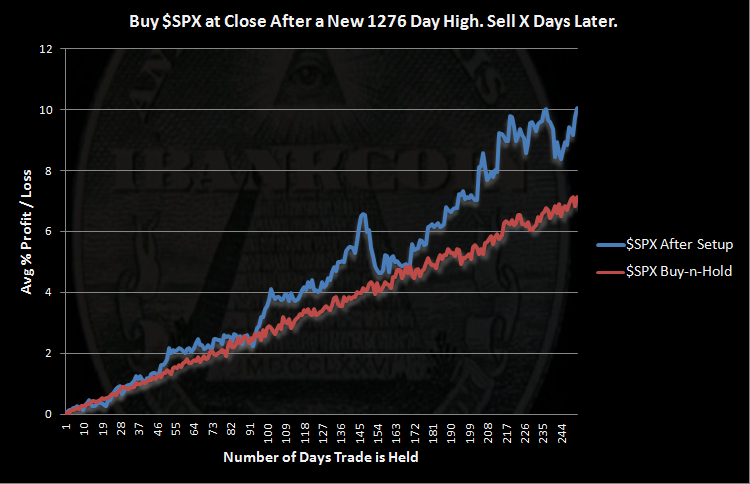
So this is just a fun-to-run study of what has happened after the market makes a huge new high, as it did today. I decided to look ahead 252 days, roughly one trading year, to see what has happened in the past, one year after a new 1276 day high.
I used S&P 500 data, with the first trade taking place on 1.3.1928. This study incorporates over 80 years worth of data and has 39 samples of trades held the full 252 days.
Results:
Bullish, eh? Frankly, I was somewhat surprised.
The $SPX Buy-n-Hold graph was created by splitting the data into 252 day segments and then averaging all the segments.
I am now interested in whether this has worked better over the first 40 years of data or the last 40 years of data. Meaning, is the edge growing stronger or weakening? That study will have to come later…


39 samples is a pretty valid study. An extra 3%+ a year with no work 🙂 And the worst it does is match a buy and hold. Not too shabby.
I was pretty excited to see the 39 samples!