A friend recently sent me this publication from Empiritrage: Volatility-Based Allocation. I encourage reading the document as the strategy is interesting, and a basic understanding of what they are testing will be necessary to understanding my article.
The general idea behind the strategy is to use two $VIX moving averages (10 and 30 day) and a 12 month moving average (250 day) to create Risk-on, Risk-off regimes for 5 asset classes:
- SP500 Index ($SPY)
- FTSE NAREIT All Equity REITS Total Return Index—benchmark for REITs ($IYR)
- MSCI EAFE Index—benchmark for investment in equity markets outside of U.S. and Canada ($EFA)
- MSCI EEM Index—benchmark for investment in emerging markets ($EEM)
- Merrill Lynch 7-10 year government bond index ($IEF)
A quick glance at slide 3 of the publication will provide a graphic presentation of how VBA works.
The backtested results presented in the publication were decent enough for me to consider adding VBA to my own portfolio. But before doing so, I wanted to see what would happen if tradeable securities were used instead of the total return indices (which are not able to be bought and sold).
I’m not sure what to make of the dividend distributions that are part the total return indices but not the price indices. My data is all price indices, meaning it is dividend adjusted. In real life, would trading in and out of $SPY or other tradeable asset classes mean missing some dividend distributions? I think it would, and I’m not sure how Empiritrage took that into account. I have sent them an email with a link to this post in case I have erred or in case they want to provide some clarity.
We can assume, since I will be using price indices (ETFs, actually) for testing the system, that my results will not be as good as their results since dividends will not be included. Other considerations are that ETFs do not perfectly track their underlying indices and can be subject to bid/ask and liquidity issues. I am also including a return on cash via $SHY (iShares 1-3 Treasury Bond ETF), but I have not calculated the return the same as Empiritrage as they used T-Bills. My goal is to test how VBA would work in real-life for a real person who chooses to manage his or her long term accounts. I will test the strategy over the data and securities that such a person is likely to have available.
Backtested Results
I will present my results much the same way Empiritrage did, for the sake of easy comparison. All results are frictionless, meaning commissions and slippage have not been included. Trades are made and portfolios are rebalanced once a month, on the first trading day of the month.
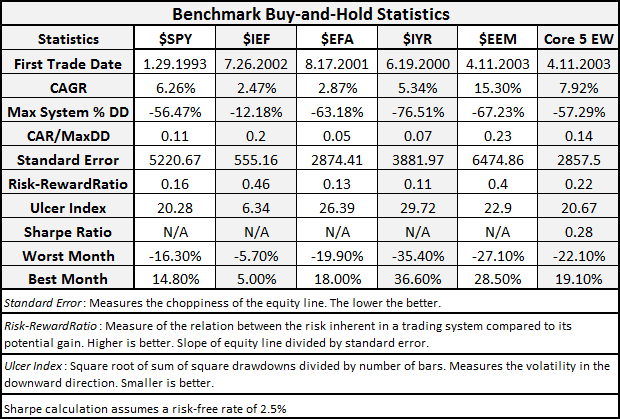
It has been a rough decade for these asset classes. While $EEM returned 15.30%, its maximum system % drawdown was a killer. The Core 5 EW, which is simply all five classes held in equal weights, also had a killer maximum drawdown. What Empiritrage is seeking to accomplish is to replicate the returns without the risk.
Let’s see if their volatility-based allocation strategy is able to do that.
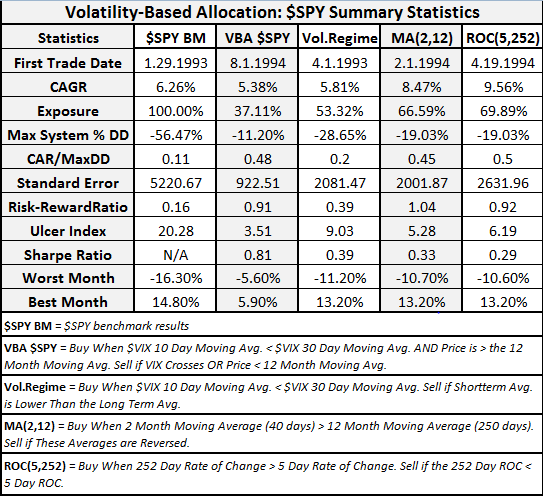
The volatility-based allocation (VBA $SPY) was able to come close to the $SPY benchmark return while significantly lowering risk metrics.
- Exposure was reduced by roughly 60%
- Maximum System % Drawdown was reduced by 80%
- Sharpe Ratio more than doubled compared to the other strategies.
If the goal is to beat the S&P 500 and include some downside protection, the ROC(5,252) and MA(2,12) have accomplished it. But with increased CAGR comes increased risk. I do not think it is possible to separate the good from the bad, but the VBA strategy shows on $SPY that it is possible to keep most of the good and throw out most of the bad.
The Volatility-Based Allocation Equity Curve
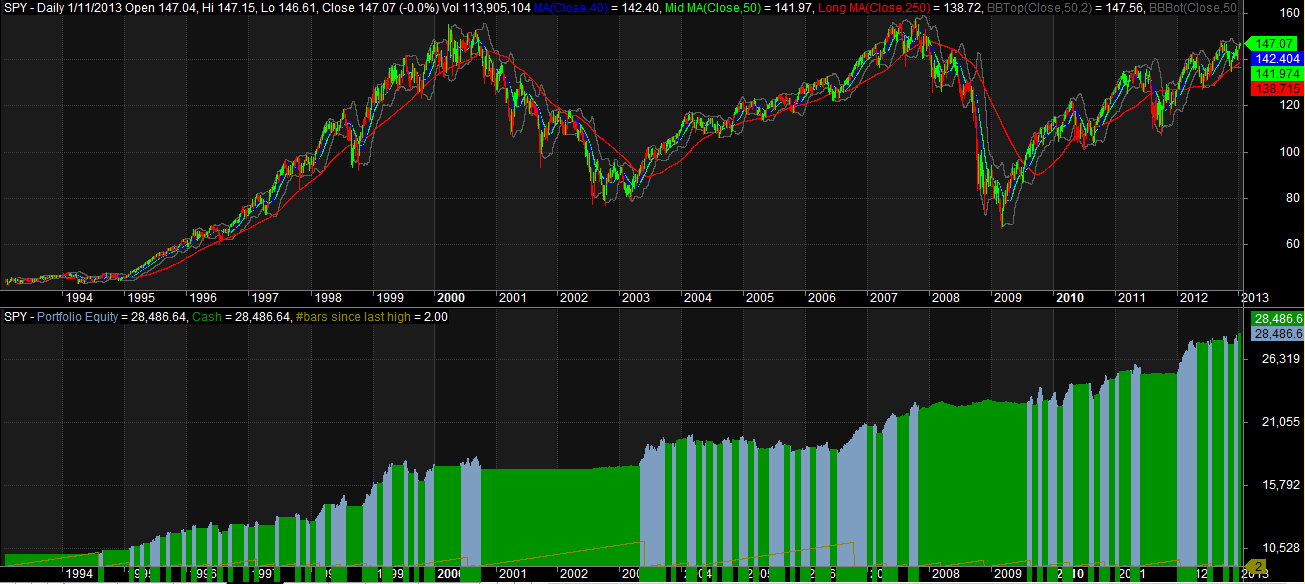
Click on the charts to make them bigger…
Upon seeing the equity curve, I started thinking that it would be hard to stick with this system from 2003 – 2006 when the market was steadily trending up and the system was losing money. And therein lies the system trader’s dilemma.
The next post will take a look at how this strategy has worked with the other 4 asset classes, and will then run the strategy over all 5 classes equally weighted. If there are any questions, please let me know in the comments. I have glossed over quite a few of the specifics in order to make this post manageable.
Exit question: Is the market making a huge triple top?


Very interesting post. My experience, after working on a similar strategy, is there’s a lot there (i.e., the highest Sharpe I ever saw in any of my systems). Please keep us informed.
Will do. I’ve used volatility when ranking securities for a rotational system, but not as part of the risk management.
I’m wondering if using a 10 and 30 MAs of a security’s volatility might also yield interesting results for a rotational system. Rotate how when the 10 crosses the 30 and into something with the 10 beneath the 30. Of course we wouldn’t have to use the 10 and 30, it could be the 15 and 40, but I think you get the point.
Wood, been looking in to this as well. In some circles being called Adaptive Asset Allocation, with a weekly rebalance. Vol was measured as variance, then investments chosen baed on correlation and momo. Weights assigned to each investment were designed to have a max daily adn annual drawdown.
This really punches a hole in MPT and glad your doing some work on it.
SAA is no longer relevant, and in fact probably never was, as an investors time horizon is shorter than all the returns used to plug into SAA models.
This is the future. For now.
Jimmy, I’m probably just dense, but I could not figure out your acronyms MPT and SAA.
Sorry Wood. Modern Portfolio Theory (MPT). Strategic Asset Allocation (SAA).
Ahhh. And you know, in my head I was saying Modern Portfolio Theory but the name and the acronym were not lining up…lol…long day. I was nowhere near right on SAA. I kept saying, “Social Security Administration?”
Well you were close with your definition both systems are dead in my opinion !! LOL
Wood, is it possible to include the single worst loss in your tables? I’ve been reading Ralph Vince’s books and that seems like an important parameter to use in comparing systems.
One thing I like is that volatility is a property that might be difficult to arbitrage away, even if widely known.
Sure, I’ll include worst trade in the next set of stats.
I love Ralph Vince. Strangely though I’ve never purchased one of his books, but I have found myself often googling his formulas and trying to code them for Amibroker.
i’m long AAPL. feb 550 calls, 30% stop loss , news is sort of sketchy on AAPL.
some reports are bullish, some are bearish
Yes, this is what TAA (tactical asset allocation) and AAA (adaptive asset allocation) are trying to do. Pick a diversified basket of hopefully uncorrelated assets and apply a trend following and/or momentum filter to them to protect the downside. Mebane Faber uses a 10 month moving average for entry/exit signals, you can also add on momentum and relative strength for greater returns. Or, just apply leverage to the basic trend following model. Google Ivy League Portfolio, Optimal Momentum, Scott’s Investments.