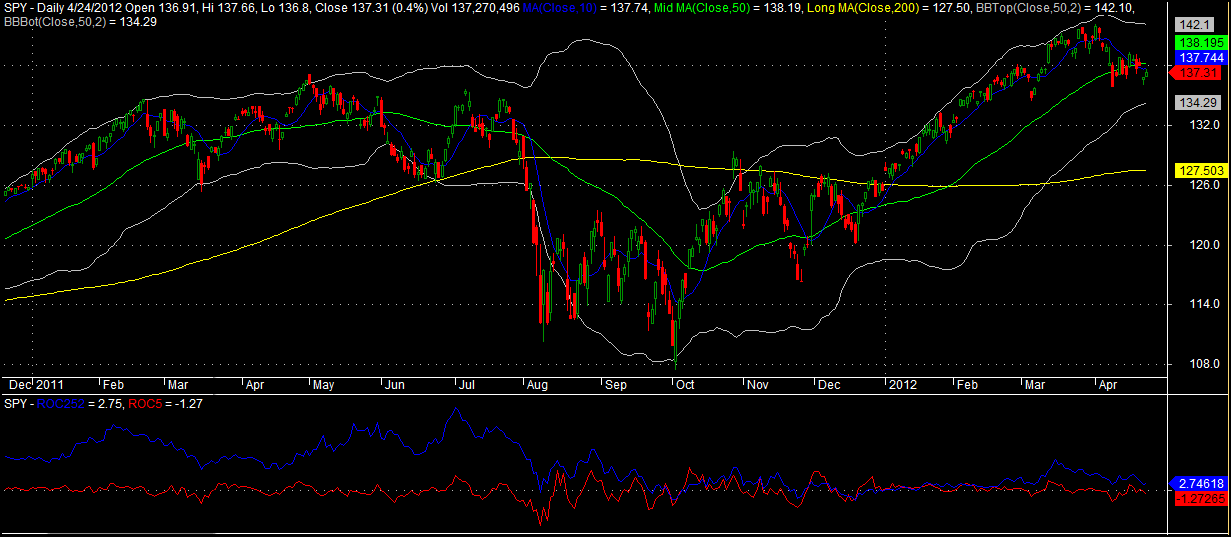
To be long, we want the blue line to be above the red line. Over the long term, using this simple indicator to signal when to be long SPY has beat buy-n-hold and reduced drawdowns by approximately 2/3rds.
Adding short signals to the indicator improves results but the effectiveness of shorting is a relatively new development.
To read more on this indicator, go here.


Hmmmm…my ROC(252) = 6.24 vs. yours…weird.
Quit using yahoo data and get a real feed? 😉
Funny you should say that …I have 4.91 for my ROC(252) http://stockcharts.com/h-sc/ui?s=SPY&p=D&yr=2&mn=0&dy=0&id=p85802967847
Hmmm. Not sure why all the differences. I think this has come up before, but I do not remember how it was resolved. I’m all ears if anyone has any ideas.
Keep in mind I’m using the close, so it is calculated close to close.
Here are updated ROC values from my spreadsheet using Yahoo data and the formula in my comment below: ROC(5) = -1.27265. ROC(252) = 2.74618. Exactly the same as Wood’s. There may be a slight difference in ROC(252) depending on whether you use adjusted or raw close data.
You would think commercial sites would at least get simple formulas correct.
Your $CPST call is over. It’s junk.
I ran into this same issue (and I believe commented on it). Not every site uses the same definition of ROC, but Yahoo ROC data is simply wrong. Even Investopedia has two different formulas.
Use this formula (hope I got it correct) in a spreadsheet with Yahoo’s data: ROC = 100 * (Closing Price Today – Closing Price “n” Periods Ago) / Closing Price “n” Periods Ago, and you should get Wood’s numbers.
Thanks Bozo!
Thanks. I was trying to be lazy and just check via a quick link to StockCharts…sigh..something else to add to the Excel macro
Conclusion so far: my data is f*cked. 🙂