Since the backtest results generated from buying new 200 day lows averages all returns together, I thought it might be instructive to observe a single, recent performance against the average of all previous returns.
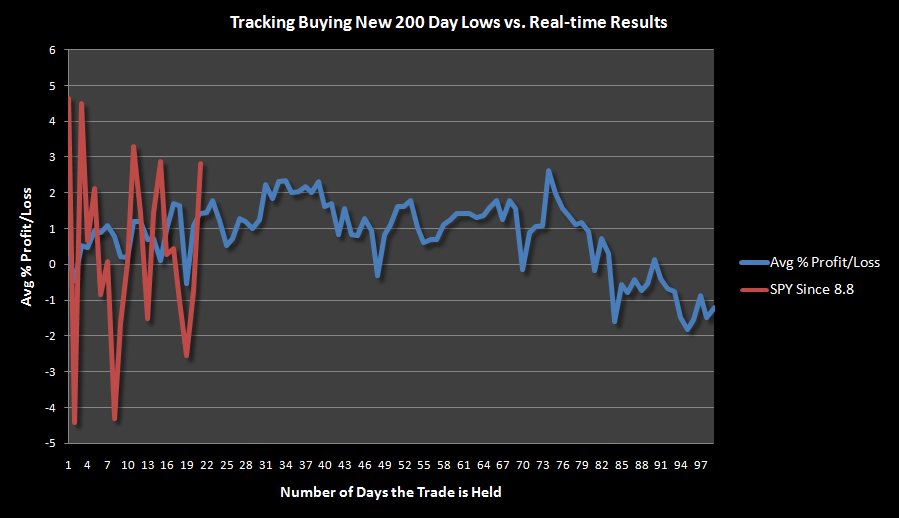
On 8.8.2011, SPY made a new 200 day low. The graph below plots SPY results since 8.8.2011 over the average of all previous returns from buying a new 200 day low.
![]()
In the original post I wrote, “Based on these results, a new 200 day low seems to continue to produce a volatile, somewhat range-bound market, for many months following the occurrence.” One month later, that statement has proved to be accurate.
Since the blue line is an average of all trades, we would not expect it to be as volatile as a single trade. Still, the gyrations of the blue line are awfully similar to those of the real-time trade, represented by the red line.
What does this mean? Well, it means the market has traded exactly as history had us believe it would, and I see nothing to make me believe that anything will be different going forward.
For fun, let me make a prediction. See that little plateau that starts at day 31 and ends on day 40? I predict that we will soon see similar plateauing, and it will happen as SPY oscillates near the declining 50 day moving average.


Shedder, you’re clearly an analytic Giant compared to me, is it fair to expect that 2011 will be a 2010 repeat even without “QE”?
Could be. They are sort of shaping up to be similar. In 2010, the death cross happened one day or so off the low for the year. In 2011, the death cross has occurred near another low which is also shaping up to be very important.
More stats…the new 200 day low in 2010 was on July 2, the same day as the death cross, which was the low for the year.
In 2011, the new 200 day low was on August 8, which was 3 days before the death cross.
Definitely some similarities.
My gut says this year will be worse.
Wow. Aghast. Thanks. Technical. Excellence.
No problem…Thanks!
Awesome
Not awesome, not amazing, nothing to be “aghast” over.
With the red line (actual results) ranging + or – 4.5%, over a one month period, there is in fact almost NO blue line reading that would not comfortably fit in its confines.
A random generator could create any blue line, and it would fit inside that huge range.
So, my response here is: merely correct, logical, and excellent as always. 🙂
Probably the key takeaway is how LONG the effect is felt; and it dovetails with some of the early August Woodshedder studies of ultra-high volatility which had dismal results out for several months–especially that one where on the exact 100th day the market dropped straight to Hades! (Can’t recall the exact day or I would post a courtesy link.)
So, to balance out some of the prior hyperbole, merely superb work, Wood.
Great stuff as usual sir.
How’s the ROC5 and ROC252 indicator looking???