With current market volatility at levels higher than we’ve seen over the past 12 months, I thought it would be helpful for traders to review a previous post that details a method of position-sizing that allows them to adapt to increased market volatility.
Customary position-sizing has the trader buy X number of shares and set a stop to so that he does not lose more than X dollars. One drawback of this method is that it does not account for the volatility of the security being traded. Volatility is a measurement of change in price over a given period. It is usually expressed as a percentage and computed as the annualized standard deviation of the percentage change in daily price. The more volatile a stock or market, the more money an investor can gain (or lose!) in a short time.
Consider then that our positions can be built to account for the volatility of each security we are trading. For example, if we have two stocks, both priced at $25, and ABC moves on average 1% per day and XYZ moves 3% per day, do we want to take equally sized positions in both stocks? Do we want to use the same stop level for both stocks? If the answer is not immediately clear, think about this: If we use a $1 stop loss for both stocks, XYZ stock is much more likely to hit the stop, yet this movement may be entirely within a normal range (remember, it moves an average of 3% a day).
We can account for this volatility and position-size accordingly.
The easiest way to do this is to use the Average True Range. ATR is popular as it is readily available in most free charting programs, such as Stockcharts. “The Average True Range (ATR) indicator measures a security’s volatility. As such, the indicator does not provide an indication of price direction or duration, simply the degree of price movement or volatility.”
There is no absolute need to understand exactly how the ATR indicator makes its calculation, as long as there is a basic understanding of what it is calculating. In simplified terms, it is calculating the average daily movement of a security. This is just what we need to position-size for volatility.
Lets take a look at a chart with a plot of ATR(10), where 10 is a user-definable setting. 14 is standard, but I prefer 10.
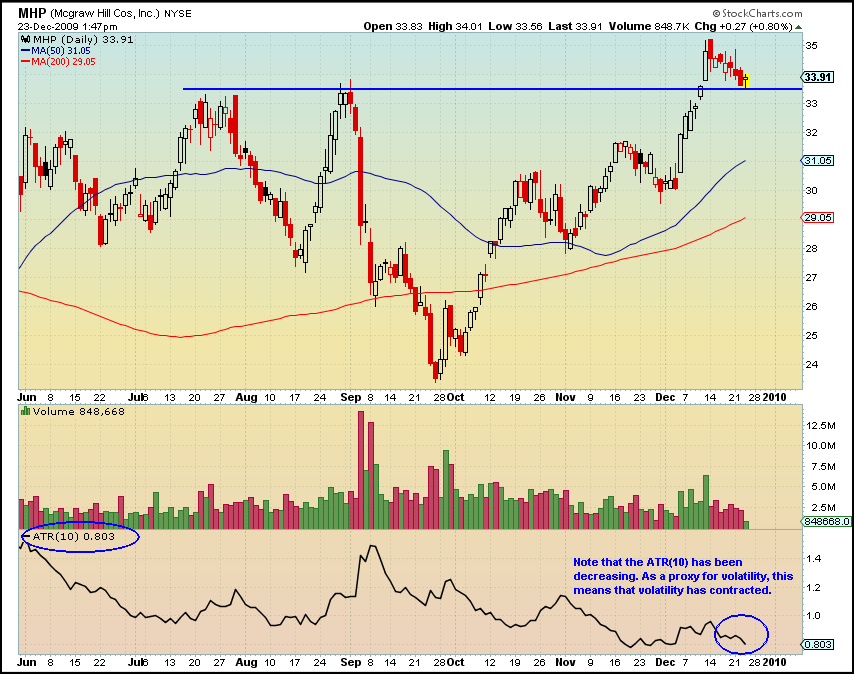
Above we have a chart of The McGraw-Hill Companies, Inc. [[MHP]] , which just happened to be one of today’s PDS picks. (Yes, it is a sweet pullback setup. The PDS will find these daily.) In the bottom of the chart, ATR(10) is plotted. We can see that ATR has been steadily decreasing since September. Remember that this means that volatility, or how much the stock moves on average, has been decreasing.
We can complete a quick calculation and get an idea, in percentage terms, of the average daily movement of [[MHP]]. All we need to do is divide ATR(10) by the price.
.803/$33.91=0.023=2.3%
On average over the last 10 periods, MHP has traded in a daily range of 2.3%. Obviously, using a 2% stop would be foolhardy with this stock.
I’ll quit here to allow digestion of the principles of building positions around volatility using the ATR indicator.
The next post will detail exactly how to use ATR to calculate your stops and build positions that are sized according to the volatility of the stock.
Access to ATR position-sizing and stop models are included in both the trial and full PDS memberships. Plus, PDS automatically calculates the 10 period ATR as a percentage for every stock that is selected for purchase so that users can easily implements the ATR position-sizing model.


Thanks wood, great stuff. Always intuitively understood to set lower stocks for more volitile stocks but never really calculated it nor did I know how.
*lower stops
Excellent post Wood. Another tool for me to add.
Thanks guys. Position-sizing for volatility can make a big difference in minimizing gut-wrenching portfolio swings caused by being over-sized in volatile stocks, and there is an easy way to calculate it so that your trade sizes make sense for your risk and aren’t just guesses or based on needing to have a round number of shares.
Anyway, Part 2 is just as good or even better than Part 1!
Looking forward to it!
Wood,
I posted this earlier but it didn’t make for some reason. Anyway, I remember you mentioning this last year and I’ve used it ever since as a way to think about risk and stops, etc.
Another approach, which I’ve also used is to just take my cursor and run it over the up down daily percentages for a month or so to get the same kind of sense of daily/ weekly variability
It seems that both ways work in pretty much the same fashion, perhaps though not with the same exactitude.
In any case great post and very educational. I’m waiting for part II.