Many of you have asked for this, and I apologize for it taking so long. Once you digest the report you will see that it is not something I purposely meant to keep hidden!
The Raw Advancers and Decliners Indicator is proprietary, but it could easily be re-created as I have posted all of the specifics of how it is created.
Here are rules:
- Buy signal is generated for the next open after the decliners exceed the upper Bollinger Band.
- Sell signal is generated for the close when the decliners close beneath the lower Bollinger Band.
This report used [[SPY]] as a trading vehicle but it also works well with other ETFs such as [[QQQQ]] . You can see a nightly update of this indicator here on my blog. In real-time trading, the system is out-performing expectations based on the historical backtesting. I do not expect this significant out-performance to continue forever.
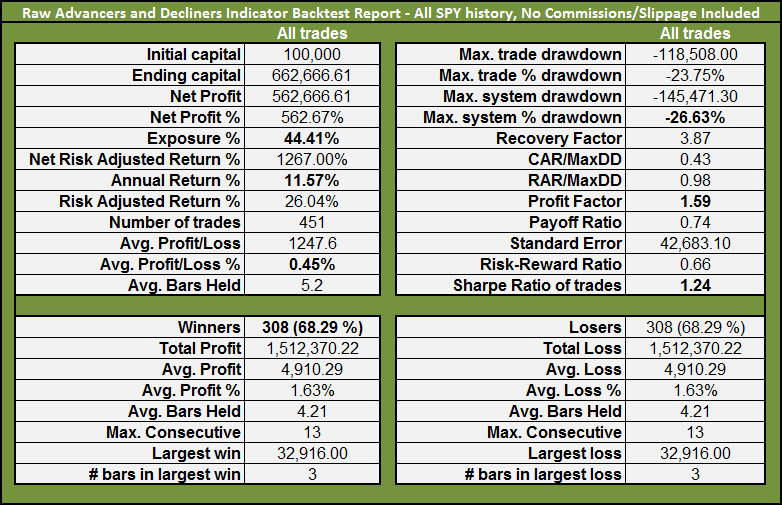
Backtest Report:

All of the more relevant metrics are in bold type above.
Equity Curve:

Historical Profit Table:


Hi Wood, thanks so much for your work….what if your raw advance/decliners indicator was combined with Danny’s ‘statistically significant’ buy breadth indicator triggered and you bought leveraged index funds…only while the market is in an uptrend….
Sbonar – My buy/sell breadth is way more than just advancing and declining stocks, and doesn’t involve a signal. I’m unsure what if any advantage there is to combining them. AD/DEC, % of stocks above an MA (or other bullish percent charts), etc etc, can certainly be very helpful, but these are already in existence and are not a unique way to measure breadth. What I measure is in fact unique, and is why my breadth gives better signals than the traditional breadth indicators you see around.
Shed, a semantical[sic] issue, but one I’ve seen misused several times recently:
A literal meaning of “proprietary” in relation to software is that it has a copyright owner who can exercise control over what users can do with the software, in contrast to public domain.
Giving someone instruction on how to build something that is already in existence and is widely used is the exact opposite of a “proprietary” indicator. Telling them how to construct the universe to which is applies furthers that point.
my 2 cents on the issue of “propriety.”
—————————-
Is there a typo in the report or am I drunk?
68% win rate and a 68% lose rate? I can tell by the R:R of .66 that the 68% win rate is likely correct…
I should add that “better signals” is not related to buy/sell signals of the market but signals of coming market strength/weakness, which cue me on how I should be trading.
The indicator isn’t as important as mastering the setup. Too many people skip this. Breadth knowledge is great but doesnt replace a trading setup.
Danny, good eye. I pasted the wrong column into Excel. I’ll fix tonight and edit it. Thanks!
And yes, proprietary is the wrong term. I struggled with that last night, but was tired, and just said, “F it.”
good show, and you know I was just busting yer balls in re various semantical issues.
I look forward to the other backtests
Thanks, Wood. Your posts are often very helpful and unpretentious.
Thanks Tilo!
I updated the backtest report with the correct metrics for the losing trades.
Great post.
So far, I have not been looking at market breadth indicators. Now, I am inspired. Looking at market breadth and trading SPY makes a lot to sense
Thanks
Thanks guruji.
I didn’t pay much attention to them for a long, long time.
Funny no one has mentioned that equity curve!!!
How is it going?
First of all, I would say that you did a great job! The analysis has plenty of details and the results got my attraction a lot…I am working on your numbers trying to replicate your main results..I got Annual return = 9.73% (total = 234%, 13 years of data)…you have 11.57% as annual return.
Anyways, taking a deeper look at your numbers I see Annual = 11.57% resulting 562.17% total return.
Am I wrong here or (1+0.1157)^(13 years) – 1 is far from 567%??? btw, you wouldn’t get the report equity curve too…Please, let me know, if I am missing something..rgds, Marcello.