In the comments of Part 2, Jeff Pietsch suggested running the system over the Fidelity Select Fund portfolio used in this series of tests to gain some insight on how the system would perform over a longer time frame. Not a bad idea, and simple to test. Long story short, with every setting, parameter, etc. the same as Part 2 except run over the Fidelity Select Fun portfolio, the system does a CAGR of 12.03%, with a pretty equity curve. It does suffer from drawdowns bigger than I would like, but would easily be improved with the addition of a moving average filter. The FSF portfolio generates its first trade in 1985, and by 1987, the system is fully diversified across four different funds.
The point of all this is was determine if our settings of RSI(65) and a minimum hold time of 65 days, are robust. (Return to Part 1 how these settings were determined). I do not think that I am able to say without a doubt that the settings are robust, but it is safe to say that they work very well using the 40 Fidelity Select Sector funds. I’m not sure why the FSFs tend to work better than ETFs, but my go-to suspicion in these kinds of circumstances is that funds that are priced once a day are not as likely to have the edge traded out of them.
Using 2 RSI Calculations and Weighting them…
In Part 2 I discussed using a technique which uses a longer and a shorter RSI calculation, weighting each differently, and then summing them to create our ETF rank.
I decided to use RSI(65) for our longer length and RSI(30) for our shorter length.
How do we weight them? I used a higher weight for the longer RSI length and a lower weight for the shorter length, so that the calculation looks like this: Rank=(RSI(65)*.6)+(RSI(30)*.4)
I have some thoughts about the weighting process, but I’ll save them for the summary/caveats.
Results with 2 Weighted RSI Calculations
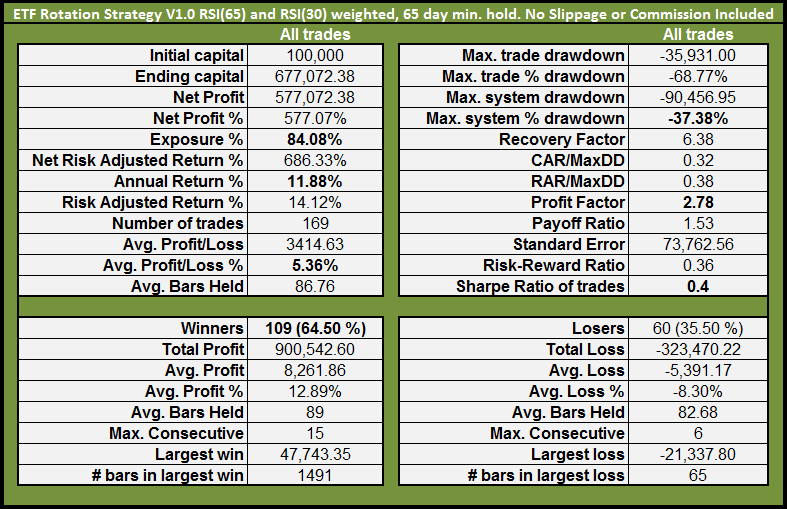

Summary of Results:
Using 2 weighted RSI calculations to rank the top 4 ETFs improves results, doubling the compound annual rate vs. the previous version. All metrics, including maximum system percentage drawdown, have improved versus using a single RSI(65) calculation to rank the ETFs.
Caveats:
If the parabolic equity curve has suggested curve-fitting, then consider yourself astute. Indeed, the .6 and .4 weights are near optimal. It is pure accident that I started with .6 and .4. I was simply looking for a greater weight for the longer RSI length. Using weights of .7 and .8 for the longer length and .2 and .3 for the shorter length result in CAGRs similar to using RSI(65) on its own, but with slightly improved drawdowns.
To gain understanding of the influence of the weights, I ran a walk-forward optimization on the weight parameters, allowing each weight to be anywhere from .1 to 1, adjusting them in increments of .05. The results were very promising and showed that the optimal weighted values consistently maintain their edge long enough into the future that the out-of-sample results are comparable to the in-sample results.
But there was something more interesting about the walk-forward results, and that is that the weights seem to adjust according to the market regime and volatility. While I haven’t thoroughly testing this premise yet, it seems that we need a higher weight for the longer RSI length and a lower weight for the shorter RSI length when the market is demonstrating a medium to low volatility uptrend, while the shorter RSI length needs a stronger weight than the longer length during periods of high volatility. Anyway, in the future, I may try to quantify this so that the weights are switched automatically based on the market regime.
Next, we will take this 2 factor system and add another factor, the moving average filter. We want to determine which is better for mitigating drawdowns: Inverse ETFs in the portfolio, or a moving average filter.


Hey Wood – great stuff as usual – you know I love me some rotational systems. Does this system still hold for 65 days? Second question – what is the universe of ETFs that you’ve currently included?
Hi Damian, good to hear from you.
Yes, it still holds for 65 days, but due to the first couple of years only having a few ETFs from which to choose, the first few trades were held much much longer than 65 day, as there was nothing else to rotate into. This fact skews the avg. bars held metric.
For the portfolio, go here: http://ibankcoin.com/woodshedderblog/2010/02/03/proposed-etf-portfolio-for-rotational-system/
In the comments section I posted the final version of the portfolio.
Hi, Wood.
Excellent work (we should nominate you to be designated a National Treasure!)
Follow up on Damian’s question about holding period: I’ll pass on that my work on momentum systems (ranks based on rate-of-change rather than RSI) generally showed that whatever predictive power there is falls off with holding period. As minimum holding period increases, it becomes a tradeoff of reduced excess returns versus decreasing trading costs (versus reduced taxes if you hold at least a year). The upside is that one can seriously consider one-year holds with momentum systems.
Did your 3D charts in Part 1 include trading costs?
Interested folks can check CXO (http://www.cxoadvisory.com/blog/internal/blog-momentum-investing/Default.asp) for a survey of academic work.
Thanks!
lol..Thanks TopTick, but I’m not worthy!
Interesting point you make about holding period. You’re saying that as holding period increases, we can expect reduced returns? Intuitively, that makes sense.
I did not run the 3D charts with trading costs.
Also, thanks for posting the CXO link. I keep meaning to link to it and discuss some of the implications and caveats that they uncover.
Here is a recent report from CXO which has some important caveats for us: http://www.cxoadvisory.com/blog/internal/blog2-03-10/
“You’re saying that as holding period increases, we can expect reduced returns?” Yes, reduced returns in excess of the average return at the same time.
“I did not run the 3D charts with trading costs.” That may be an interesting result, then, since you found a ‘plateau’ centered about 65 (RSI) and 65 (days held). My statement would imply that the returns would tilt up at the shortest holdings.
If I can grab some time, I’ll see if I can a) reproduce that and b) see if it is a feature of ranking by RSI instead of ROC. There might possibly be a relation to the phenomenon of long-term momentum / short-term reversion, exploited sometimes by combining opposite ranks by long- and short-term (e.g., rank high by combining 12-month high ROC and 1-month low ROC), or sometimes exploited by skipping some time (e.g., rank high by ROC from 13 to 1 months ago instead of ROC from 12 to 0 months back).
Top, yes, I have observed that the returns on the 3D charts do tilt up at the shortest holdings.
At some point I will run these with much shorter min. hold times, like 5 days, but at this point I’m still working from the baseline of the FSFs which have to be held at least 30 days.
I did run some 3D optimizations, and if I remember correctly, the ROC graphs were less peaky than the RSI graphs, which I interpreted as meaning the ROC ranking might be more robust.
I think you’re right when talking about long-term momo and short-term reversion, which also explains some of the weighting anomalies. In general, a highly volatile market SHOULD be more mean-reverting than a low-volatility market.
I also like this idea of skipping, and I’ve noticed it is something that CXO reports on…Ahhhh so many ideas and so little time!! 😉
Hi Wood,
Is there an email address for you on your blog pages? I couldn’t find one. Anyway, I have some data for you, and would like to know how to ship it.
Hi Wood. I’m a little confused. With a CAGR of 15%, does that mean that the previous Fidelity system you constructed has worked better? These were the criteria from that system…
“What these tests used was a 90 day rate-of-change, and a 50 day moving average filter. The system picks the fund with the highest ROC90 (after being penalized for volatility–see part 3 for the explanation) to rotate into. If after a 30 day hold there is another FSF with a higher ROC90, it is rotated into, unless the SPX is beneath the 50 day average. If the SPX is beneath the 50 day average, the system rotates into cash instead of a new fund. Once the SPX is above the 50 day, the process begins again.””
Dave, yes the ROC90 still looks superior for the Fidelity funds, but that is an unscientific observation. We could evaluate the two systems by comparing the Sharpe ratio, or using CAR/MDD to gain a more objective observation. In terms of robustness, my gut feels that the RSI65 with 65 day min. hold is MORE robust than the Fidelity system parameters, but again, that observation is anecdotal.
In this exploration of rotational systems, my overall goal is to get a sense of how differing ranking mechanisms like ROC and RSI (and I’m sure there are others) work over various portfolios of ETFs or mutual funds. At the end of all this, I will take what I have learned and build a rotational system that will hopefully be robust and be an amalgamation of what I have determined to work the best. At that point, I intend to start trading whatever the system is in my wife’s Fidelity 401K, in real time.
It would be interesting to add PSQ in with the FSF ROC 90 system, to see if and when it rotated into that particular inverse ETF during 2008, since we already discussed how that was a bad trade in this system. Excuse me for my ignorance, but what does CAR/MDD mean? And what does “robustness” mean? Thanks!
Dave, CAR/MDD is compound annual return divided by max system drawdown.
@Toptick
woodshedder73 at gmail dot com
A few comments on ETF pool composition for this study. I am looking at the list published in the end of the comments in part 1. Do you need DBC having DBA, GLD, SLV, USO, and UNG? Do you need VTI having all sectors, SPY and small caps? MDY (mid-caps) would be a better choice for added coverage of the investment styles. IYR is same as VNQ. Do you need both? PPH is highly correlated with XLV. EWZ is highly correlated with ILF. I would get rid off PPH and ILF. Instead of ILF I offer EWW (Mexico) that is less correlated with EWZ. To complete emerging market choices, I would also add RSX (Russia) and INP (India) but eliminate EEM as it becomes redundant. How about adding XHB (home builders) and XRT (retailers)?
Looking forward to see your final version. Good luck and thanks for sharing your ideas and studies.
Ruschem, thanks very much for your suggestions. They are very good and I will consider them and will make some changes to the portfolio and will post the changes with the next post.
Ruschem, good points on highly-correlated ETFs.
With highly-correlated choices, a simple ranking system could pick several very similar ETFs which increases risk.
The tradeoff is that for backtesting, some of the newer ETFs have limited history (RSX is less than three years old). An approach for testing would be to look for conventional mutual funds that have a longer history, but for trading the system, go with the ETFs.
Removed VNQ, USO, VTI, UNG, ILF and MOO.
Added EWW, XHB and XRT.
Why removed VNQ, USO, VTI, UNG, ILF and MOO?
lol….I’m writing a post right now addressing that.
The simple answer is because they were redundant.
Wood,
I was thinking about your approach to ranking ETFs. While I like RSI based system (RSI is one of my favorite indicators) there are a few points that I am not quite sure about. First, using blended RSI(65) and RSI (30) is somewhat redundant because the entire RSI (30) set of data is already included in RSI(65). Adding RSI(30) to RSI(65) simply adds some more weight to the last 30 days regardless in what proportion the two are used. Instead, I suggest using three independent periods. For example, X*RSI(21) today + Y*RSI(21) 22 days ago + Z*RSI(21) 43 days ago. In all, this system will use 65 days worth of data but split into three independent (or almost independent because of the way RSI is calculated) periods. What it does, it measures the consistency of outperformance or underperformance in each of the last three months. I did RSI ranking both ways (yours and mine). Most numbers were very close but there were notable differences as well. I didn’t run the backtest because I don’t have good backtesting software and lack skills to do it in excel.
Another problem that I see with RSI ranking is that it’s a measure of the internal strength and it really doesn’t tell the whole story. As a result, an ETF may have a high RSI rank but only a very low absolute return. This is why it seems that some kind of a combined RSI and ROC ranking should do the best. Ideally, I would filter ETF pool using RSI ranking (maybe 8 best) and buy four with the highest ROC out of these eight. What do you think?
Still look forward for your final version…
Ruschem
Ruschem, excellent comments, and very interesting and creative approach. I don’t know if your suggestion will improve anything or not, but I intend to try it out in the future and find out.
Ultimately, ROC will be the better measure to rank with, but I have always wanted to test out RSI, so here we are! However, filtering using RSI and then buying the top ranked ROC of that group is also an interesting idea that needs testing.
Thanks!
I agree, interesting — segmenting the ranking period is a great way to get at consistency in the move, and allows for weighting of the segments. (Of course, weighting brings in more variables!)
Wood, Russchem, I thought Frank at TradingTheOdds.com had an interesting varation on RSI by using the ‘buying power’ (a concept from Williams Ultimate Oscillator) instead of Close in the RSI formula. Superimposing a chart of his 2-day modifed RSI versus classical RSI(2) shows they are almost the same, but the modified version seems more responsive and gives more signals in his use ( http://www.tradingtheodds.com/2010/02/modified-rsi2-buying-power-and-intermediate-term-outlook/ ).
Esthetically, the idea has appeal because it involves more raw data (HLC vs. C), and although these are highly correlated values, it does tease out more information about price action than is available from first difference of closes. Any bets on performance of RSI(21) versus modified-RSI(21)?
Personally, I’ve located that to get just about the most fascinating topics if this draws a parallel to.
Really nice style and design and amazing articles, hardly other things we will need: D.