For history on how we got here…
Thinking About a 4 Factor ETF Rotational System
Proposed ETF Portfolio for Rotational System
The first runs will test a very basic system as I want to be able to see if adding any more complexity to the system improves it (and how it improves it) in any way over simpler versions.
System Specifics
The system will calculate the momentum/strength of each ETF in the portfolio, and then based on that metric, rank the ETFs. Version V1.0 will use RSI as the proxy for momentum.
- The top 4 highest ranked ETFs will be bought on the next open after the signal to rotate.
- Each ETF will be held for a minimum number of trading days.
- At the end of the minimum hold time, the ETF portfolio will be ranked and re-balanced.
Version 1.0 will be using only 2 factors, which are RSI(x) where x represents the periods, and the minimum number of trading days to hold the ETFs, represented by y.
Lets take a look at how these factors play together, using AmiBroker’s 3D Optimization graph.

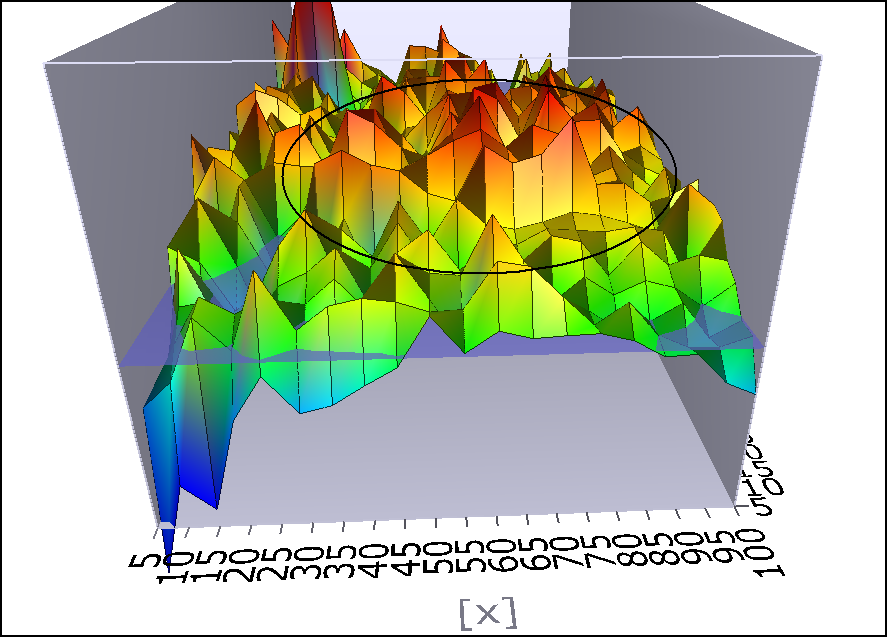
The most obvious feature of these graphs is that they are peaky. This is not a good thing. You know you have a robust interplay of factors when rather than looking like some crags in Switzerland, the graph looks like a nice grassy knoll.
I’ve circled the area that looks the most promising. We’ll be optimistic and call it the grass knoll. You can see that on either side of this area, performance begins to roll off.
So how do we choose the figures for x and y to plug into our factor calculations? Initially, I tend to eyeball things. I look for the area that seems to fall in the middle of the grassy knoll. If we choose a number near the edge of the knoll, it means that any change in the market may serious affect the system.
To my eyes, this looks like a value of near 65 for x and 65 for y. Even as I’m writing this, I haven’t tested those values, but I like them because they correspond nicely to 3 calendar months (approximately 22 trading days in a month). Keep in mind that if we choose the highest peaks for our x and y value, we will likely have curve fit the system.
Come Back for Part 2
In Part 2, we’ll backtest our x and y values over our ETF portfolio, take a look at the statistics and equity curve, and decide what we might do to improve performance.


I’m sorry, but when you say RSI, which one are you using? Found this..”Developed by J. Welles Wilder and introduced in his 1978 book, New Concepts in Technical Trading Systems, the Relative Strength Index (RSI) is an extremely useful and popular momentum oscillator. The RSI compares the magnitude of a stock’s recent gains to the magnitude of its recent losses and turns that information into a number that ranges from 0 to 100. It takes a single parameter, the number of time periods to use in the calculation. In his book, Wilder recommends using 14 periods. The RSI’s full name is actually rather unfortunate as it is easily confused with other forms of Relative Strength analysis such as John Murphy’s “Relative Strength” charts and IBD’s “Relative Strength” rankings.””
Is your RSI the one that compares it to itself, i.e. recent gains vs. losses, or the RSI that compares the stock to the S&P 500?
Hi Dave, thanks, that is a bit confusing.
I’m using Welles Wilder’s RSI. The x we are testing is the period setting.
Woody, what date range was this backtest run on? So many ETFs are so new they barely span half the last cycle and you can find yourself hard pressed to draw any meaningful conclusions from optimizing against them.
000, Testing starts at SPY inception and picks up ETFs at inception.
I’ll say something about this in the next part.