When I last wrote about Lazy Man’s system for trading the S&P E-minis, the system had been optimized on in-sample data and then backtested on out-of-sample data. The out-of-sample results were not very good, but I am always hesitant to write off a system due to a short period of under performance.
I ran a test this evening to see how the system has performed since April 29th, when the out-of-sample results were posted.
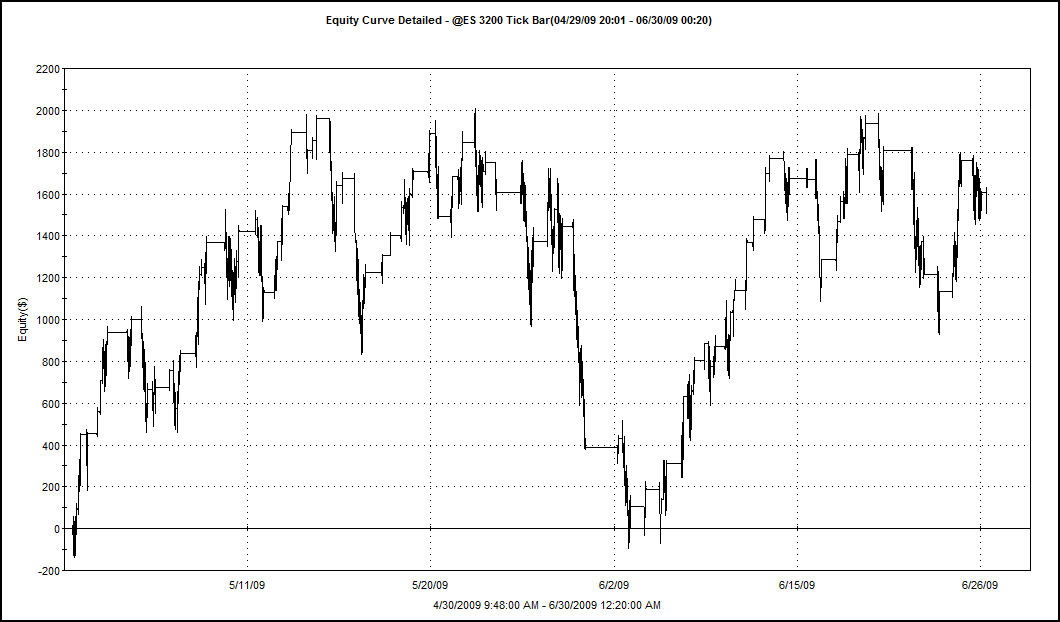
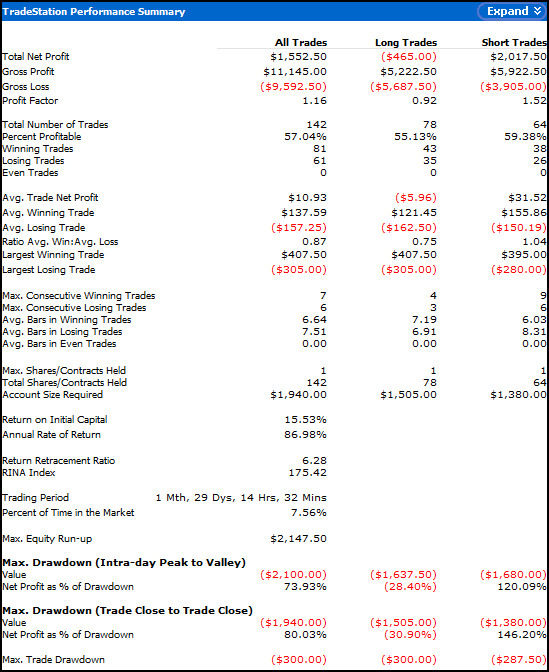
Performance has not been stellar, but has improved. The short trades are out-performing the longs over all metrics. This is odd since the market has had an upward bias during most of this period. I could go through and visually examine all the short trades and hazard a guess as to why the shorts are out-performing, but that is not really the purpose of this post.
The next series of charts show the history of all the out-of-sample data, starting from February 16, 2009, the first date of the out-of-sample test.
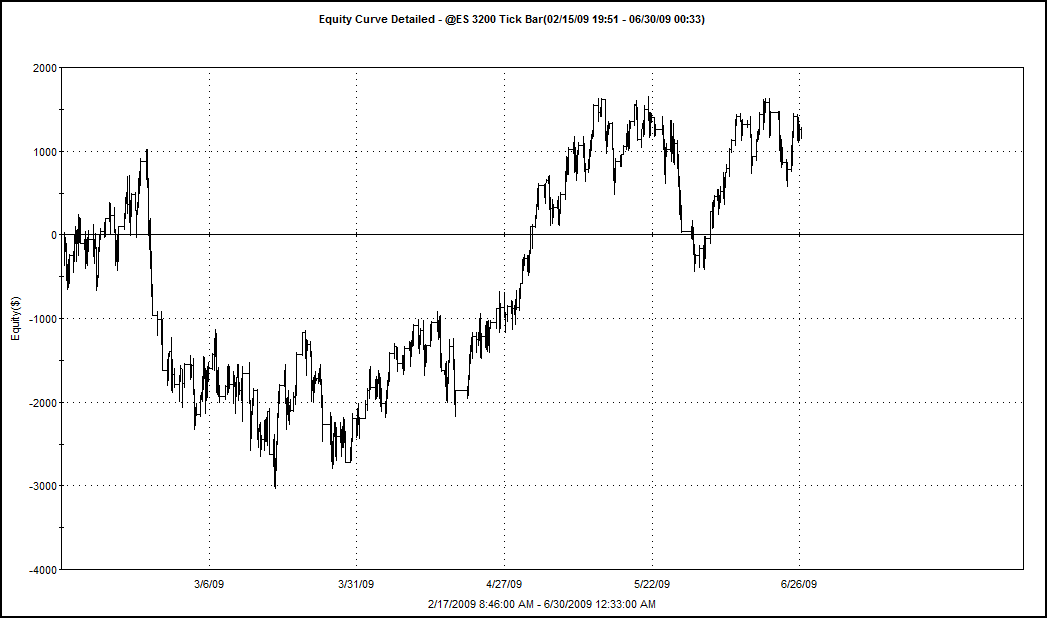
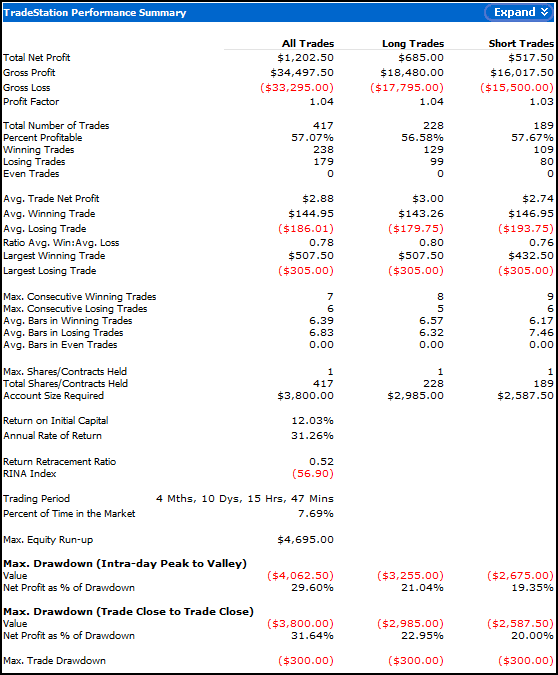
Compared to the first out-of-sample test, we have seen a small improvements in the system. Both the long and short trades are showing positive expectancy, although the average long trade net profit has dropped while the average short trade net profit has increased. Again, over an even longer term, we are seeing the system shift from out-performing on the long side to out-performance on the short trades.
The win % of both the longs and shorts has varied little since the original test, although (surprise surprise) the shorts have slightly increased their win % while the longs have slightly decreased.
Perhaps the easiest way to measure the system is to determine whether it has been profitable. Indeed it has been profitable, although this has come from short trades, primarily, as the long side has actually lost money since the first test.
Summary:
As this system uses fixed profit targets and fixed stop losses, I believe this system could be telling us that the market is changing, slowly. We would expect some change, even if it is shifting back towards “normal,” after the volatility of 2008. I will let the system continue running with the current settings, and then re-optimize before the next update. An analysis of how the optimal settings have changed since the first optimization may provide some important insights into how the market is changing.
All the posts on Lazy Man’s ES System are housed here: The Lazy Man System.


Hey Woodshedder,
I have a couple of questions for you regarding your backtesting.
I am using InvestorRT. Unfortunately for backtesting tick data, I have to import the data myself (which would entail having access to it first) or I have to store the data myself (which means I only have access to data from now on). It is easy enough to import daily data for stocks, indexes and futures, however tick data would probably be much more work.
So my question to you is, with Amibroker or TradeStation (I think this is the platform you used previously) how much data do you have access to and how do you get the tick data?
Also, how long does it take you to backtest your results? From someone who has backtested day-to-day data, it seems like it could take some time to backtest tick data.
Thank you for the input.
Red, I have access to Tick data for ES going back over 8 months now. The tick data is included with the platform, as is all the other data for stocks, mutual funds, etc. However, for more obscure time frames, Tradestation may have to download the data, and then store it. This can be an inconvenience if you must absolutely have the data right now, but I haven’t found it be too big of a deal.
The backtest I ran and posted took a couple of seconds to generate. If I were to go back the whole period, it may take 10-15 seconds.
Woodshedder, your series of posts w/ Lazy Man was int’g because I have used a similar ES strategy but w/ a faster interval (75 ticks) and different objective (scalping for 1-1.25 pts). Those 75 tick bars move very quickly right after the 9:30 a.m. open, in comparison with Lazy Man’s 3200 interval. Did you or L.M. ever improve upon his discretionary exit approach?