I would be willing to wager large that 99% of traders have never calculated the slippage they are incurring when they trade. There are many different styles of traders, and some styles, such as scalping and daytrading make it difficult to calculate slippage. Beyond that, determining slippage is just not something that most traders get excited about, understandably so. However, tedium and drudgery should be no excuse, when it comes to diligent management of your money.
Working-stiff traders and system traders should be calculating slippage. Some of you, like me, are relegated to placing trades during “dumb money” times, like on the open. Maybe the market-on-close order is available through your brokerage. The benefit to trading the open and close is that you can compare the price you received to the nationally listed opening/closing price. The difference is the slippage.
There are three circumstances when slippage absolutely must be accurately determined.
1. You are trading a high-frequency strategy (at least one trade a day) that seeks to make many small profits.
2. You want to be totally committed to your system, mentally, physically, and psychologically. Total commitment can only be achieved once you have completely deconstructed the system (in my humble opinion), and accounting for slippage is part of that process.
3. You are considering purchasing a system or subscribing to a system from a vendor.
Here’s How I Calculate Slippage:
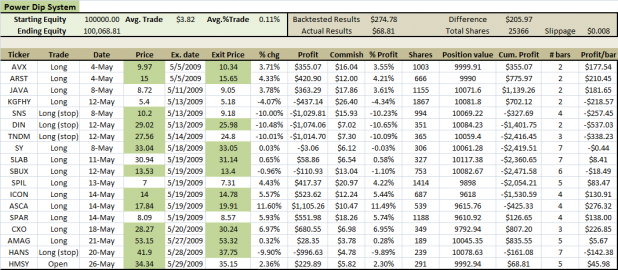
The spreadsheet above has the accounting for the Power Dip System trades during May. The entry and exit prices highlighted in the pleasing green hue denote trades that I actually took in my own account. For those trades, I used the actual price I received. Some of the prices matched the openings, some did not.
The prices in white represent trades that the system took, but that I did not take in my own account. Those cells were populated with data from the backtest results.
So now I have two figures: The actual profits/losses generated from the prices I received (with a few of the trades that I did not take) versus the profits/losses as reported from backtesting. Keep in mind that backtesting is always going to give you the open or closing price for all of your trades, regardless if there was enough liquidity for your order to fill.
In the top right hand side of the spreadsheet I have listed the Backtested Results and the Actual Results. The Difference is just over two hundred bones. Assuming the commissions are accurately calculated, the Difference is the slippage.
To calculate the slippage per share, I added up all the shares traded multiplied by two (remember they have to be bought and sold). I then divided the Difference by the Total Shares. Voila! The slippage is $0.008 per share.
Summary:
Even if you do not have access to fancy backtesting software, you can still calculate your slippage. Just create a new field in your spreadsheet (you do keep records, right?) for the open/close. Then, you can compare the open/close versus the price you actually received.
Do not neglect this crucially important but tedious task. Many traders love the commission schedules of the more popular brokers when each share only costs them $0.005, yet they are probably not at all aware that their slippage is twice the amount of their commissions.
Here is a quick example:
One version of the Power Dip, assuming $0.005 per share commissions and no slippage, has turned 100K initial equity into $1,291,559.30 for an annualized return of 25.06% since 1/1/1998.
The same version of the Power Dip, now assuming $0.005 per share commissions and $0.008 in slippage, has turned 100K initial equity into $905,094.92 for an annualized return of 21.23%. In this example, slippage has cost almost 400K, over a 10.5 year time span.
A 400K discrepancy might cause some heartache, had slippage not been accounted for early in the life of the system.


Yup, and let’s not forget “slippage” of the 2X and 3X pairs vs their underlying. URE, SRS average around 2X, but they’re regularly 1X above or below the mark.. Synthetic option combos for liquid indexes might actually track better, not sure, but the fees man, the fees..
I have to concur with manatrader above on fees.
Most of my systems require at least 100 share lots to perform when adding in commissions.
Most markets use an opening/closing cross now, so you should always get the listed open/close price. If you are getting slippage on the open or close, it means your broker isn’t doing their job properly. I have been trading at the open a bit for the past year, and every trade has been at the listed opening price (except for one which I submitted less than a minute before the open). One potential problem is that some stocks open on multiple markets, and only one of the opening crosses is the official open.
The other form of slippage (market impact) is harder to calculate. If you submit a buy order for 10k shares of QQQQ at open, you should get the open price still (it looks like the opening cross was about 100k shares yesterday). But that price might be a little higher than it would have been if your order hadn’t been there. It is impossible to calculate that slippage (unless you have access to the opening order book and can look at the contra-side orders, even if it’s only after the trades are done).
jkw, I use Tradestation, primarily. I would say that 80+% of entries get the listed open. It seems to me that it is the closing of trades at the open where I do not always get the listed open.
And this does not even cover shorts, where the uptick rule would really screw things up.