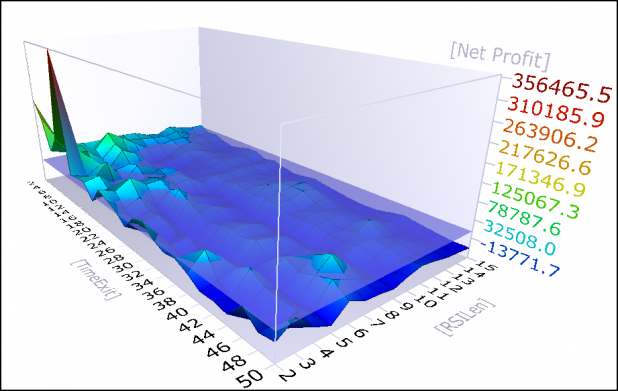
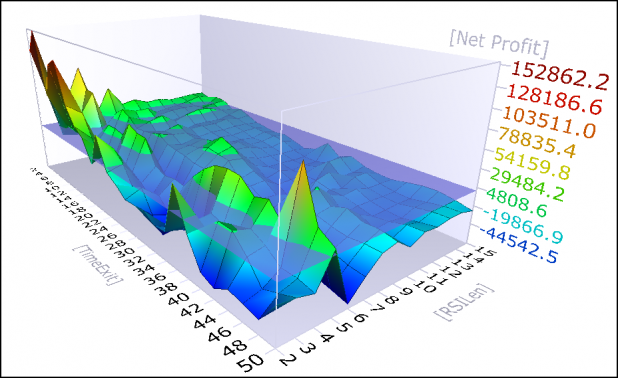
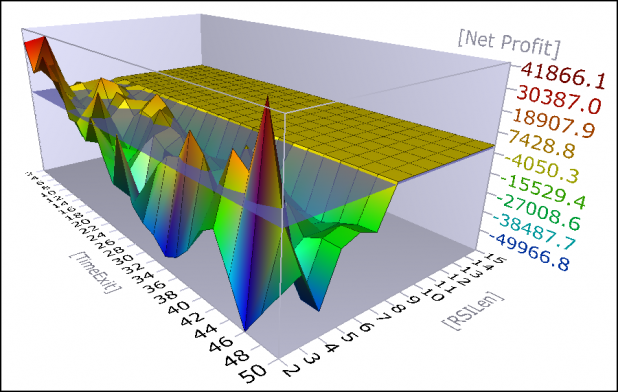
This post continues my objective of examining the period settings of RSI to determine which periods offer predictive qualities. The previous study looked at the SPY. This study examines the QQQQ.
Parameters:
All short-sells and buys-to-cover were executed on the open of the day following the buy/sell criteria being met. For example, if RSI(?) closed at 71, then a short entry was executed on the following open.
A time exit was used, starting with a 2 day exit (which means an exit on the open of the 3rd day) and increasing in increments of 2 with a maximum length of 50.
The minimum RSI period length tested was 2 with a maximum of 15.
QQQQ was tested, using all history available. Future tests will include more ETFs and stocks.
The test uses 100K of starting equity with gains compounded on each trade.
Results:
Overbought = 70
Overbought = 80
Overbought = 90
Summary:
I have decided to refrain from discussing these tests in depth until the end of testing, when I will summarize and draw conclusions based on all the data.
I must note though that these results are similar to the SPY results, and they suggest that a period setting greater than 6 offers little value.


That is one kick ass graph you got there lol!
tmi, those are courtesy of Amibroker. That is their 3D optimization chart.
Wood. Thanks. (thinking out loud)… I guess I expected this would look different. Are you testing the system or the RSI period? Cuervos? Don’t we need to factor out the system being used and the period. A short term system (I think that’s what you’re using) should work better with smaller RSI values. I can’t find my Wildler book. It’s packed away someplace. I still think this looks like an interesting area of study.
Thanks. Interesting results so far.
Will be watching this series.
Nice graphs except I didn’t understand them until I used the 3-D glasses I heisted at the last 3-D Disney movie.
Anyway, this is kind of what I see happening with the Q’s strictly based on observation (which probably is meaningless).
The large cap tech via the Q’s and especially the large cap semis via SMH led the way up off the bottom. Based on my observations the past 7-10 days or so I would say there is much distribution going on in these Q’s stocks. There has been selling at gap opens (especially SMH) rebounds and then either weak rallies or sell offs into the close.
This is the opposite of what happened off their bottoms plus the volume has been rather weak going up compared to the down volume.
I believe they are ready to fall hard and lead the rest of the market down. An example would be CSCO. The analysts wet their pants on the earnings and yet it has been selling off after the gap up in the AH.
Just an observation
TC- I am in full agreement and will likely taking a QLD position on Monday.
Hopefully on a gap up. Chips look like shit too.
____
Jakes Crackberry- Do you mean QID?
I have no idea what Wood’s chart’s mean.
They looks purty though…
The graph shows all the RSI period settings coupled with a time exit 2, 4, 6, 8, day etc..
So the graph shows the results of RSI(2), RSI(3), RSI(4), RSI(5), etc. coupled with the time exits.
If RSI is set at 14 and it closes above 70, and the breakpoint is at 70, then the system would sell short on the next open, and would record the results of exiting the short on each time exits.
The graph is an optimization report that shows the results for every combination of RSI period setting when used with all of the time exits.
So far, these show that RSI settings between 2-5 periods coupled with short time exits, 1-8 days, produce the most net profits.
Hey WS,
Would you be using MatLab for your tests by any chance?
Something I’ve been meaning to get around to.
BriGuy, these tests used Amibroker, but I also use tradestation and excel.
I do not have MatLab but I understand a lot of system designers are using in it.
WS,
I use Excel alot too. I don’t think TS and AmiBroker are available in Canada. I would be interested to see what macros you have developed to automate things. Any way that can happen?
Thanks Wood.
Now it makes more sense.
An opensource Matlab is called Octave: http://www.gnu.org/software/octave/
Thanks for the interesting article and research. I have been using RSI (2) and (3) as indicators for my Leveraged ETF strategy. I am still working on how overbought/sold they need to be to have an acceptable trigger. I do not have the cool 3-d modeling software, though.
I am currently working on a speculative trading strategy that only trades 3x Leveraged ETFs for smaller account appreciation. If anyone is interested you can check it out at my website. http://www.brute-force-attack.com.
thanks,
Global 34
Mr. Woodshedder will be away from the terminal today.
He is going to the O’bama rally to show his support, here in Richmond, VA.