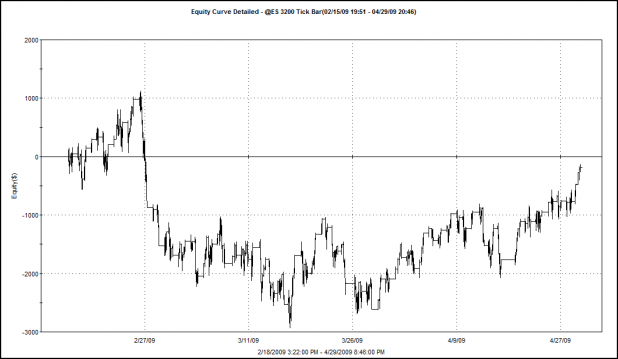
Equity Curve, Lazy Man System Out-of-Sample
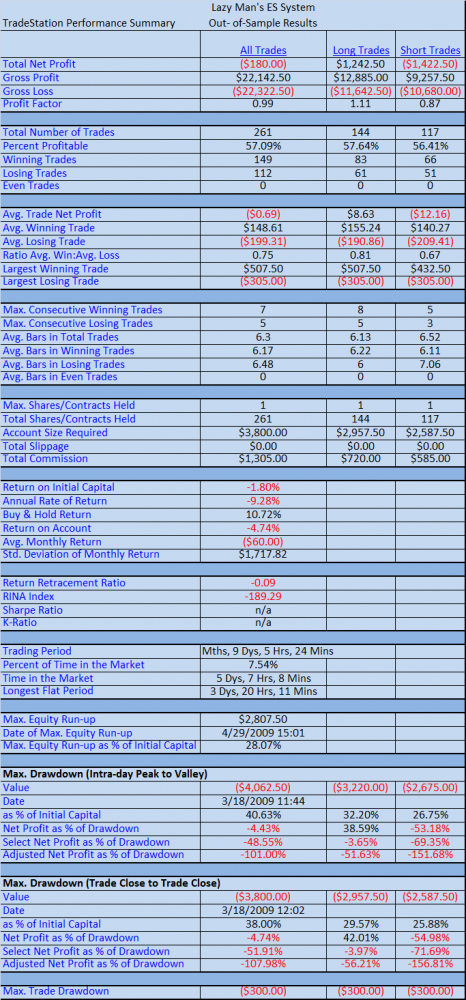
As evident from the above report, the system did not perform nearly as well during the out-of-sample testing. There are likely many reasons for this, but here are several that I’m considering:
1. The system is still working well but has just entered a drawdown or phase of under-performance. Or…
2. Due to the lack of more than 6 months worth of data, we do not know whether this type of under-performance is normal or abnormal. (More on this at the end) Or…
3. The system was curve-fit to the in-sample data set.
————————————————-
The system was tested on data from 2/16/2009 until today, 4/29/2009. The same parameters were used:
RSI Long Exit above 85 and RSI Short Cover below 10
Profit Target: $700.00
Stop: $300.00
Observations…
As I was looking over the trade-by-trade report, I noticed that not one time did the profit target trigger during this test. This means that every exit was triggered by the RSI level. Obviously, something changed between the in-sample and out-of-sample data. My guess is that the out-of-sample data was less volatile, meaning the profit targets were never reached. From December 2008 to the present, we know that volatility has decreased.
And this brings up an important point. When one uses static profit targets or stops, he or she risks that increasing or decreasing levels of volatility will render these static targets and stops ineffective, unless constant readjustment is applied.
Beyond the example demonstrated in this test, anyone using fixed-percentage stops and static profit targets during October and November of last year found out the hard way that both the stops and profit targets could have been doubled.
Why then would I use these stops and profit targets for this system? Primarily because Lazy was curious as to how the system would back test using them. I have to say that I was curious as well. In the end, it seems that this system should adjust with volatility.
What Now?
These experiments could continue for much longer than most normal people would want to read about in a blog. From here, it is natural to wonder though: Which of the exits (besides RSI), if any, performed well over the out-of- sample results?
I will stop here though, as I think the Lazy Man system needs to marinate for a time, and I need to move on to other ideas. I will soon put all of the posts about this system on one page to make for easy reading / referencing.
Loose Ends
It was suggested that a Monte Carlo analysis would help in evaluating whether a system is robust or not. I wanted to run a MC on this system, but had neglected to do so. Bman’s comment reminded me to do so. Below are a few graphs of the data from the first in-sample optimization.
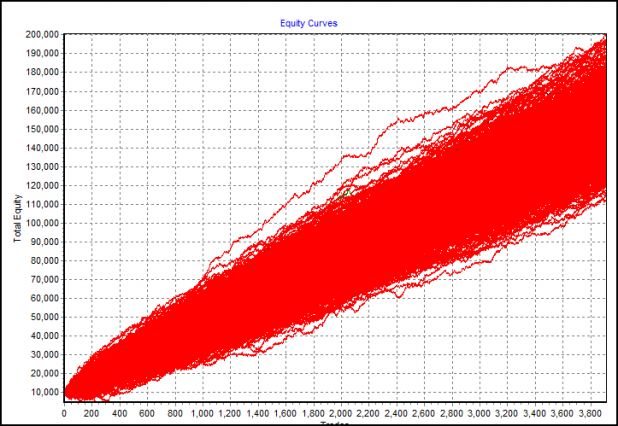
Monte Carlo Simulated Equity Curves
This represents 1000 different equity curves with each curve being made of a random ordering of the actual system trade results.
Looks great, huh?
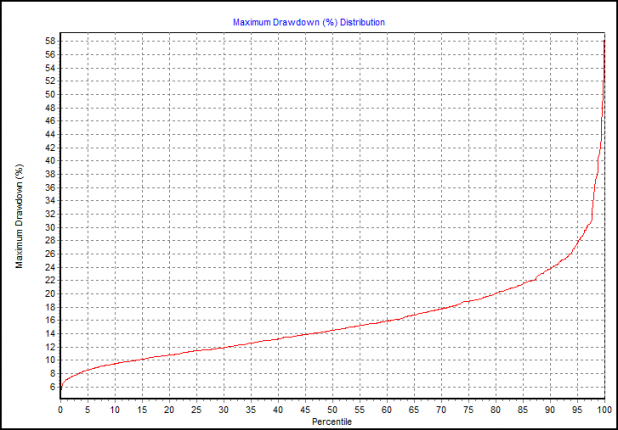
Max Drawdown Distribution
This graph shows that 95% of the trials had a percentage drawdown of 28% or less.
Looks great too, no?
It does, until these results are contrasted with the results from the out-of-sample tests where the system has experienced a drawdown from starting equity of 28.22%
Simply put, neither I nor the data know what we don’t already know.
The data set looks great, in sample, but the out-of-sample run produced is similar to one of the unlucky red lines in the very bottom-left quadrant of the equity curve graph. Look for the curves that immediately dip and lose money.
When I run the Monte Carlo on the out-of-sample data, the graphs demonstrate truly horrendous performances. The out of sample results show a system where 44% of the trials lost greater than half the starting equity. The Max Drawdown graph shows that 95% of the trials had a drawdown of 64% or less. This is quite a contrast to the Monte Carlo results from the in-sample data.
Without a doubt, more than six months of tick data is required for further development of Lazy Man’s system.
I will continue to monitor this system and post updated results and equity curves from time to time.


“And this brings up an important point. When one uses static profit targets or stops, he or she risks that increasing or decreasing levels of volatility will render these static targets and stops ineffective, unless constant readjustment is applied.”
Spot on! Accounting for volatility is essential for any short-term (intra-day) trend following system. The $700 (14 point) target was far higher than anything I would ever expect so I can certainly see why it did not do so well.
I have often thought about targets based on %ADR (5 or 7 day maybe) and this, I think proves that I need to move in that direction with my trade log.
one way to manage changing short-term (intraday) volatility is to assign stop and target factors, where the factors are multiplied by the average (high-low) range of the previous X bars. You can then optimize these factors, so that your stops and targets are ‘self-adaptive’ (you could also optimize X, although my guess is that would quickly lead to an overfit system).
I think I started reading this series somewhere around your second post. I have learned a lot since then – thank you all.
I think I started tweaking Lazy’s system in the first five minutes I read that second post. In the end, my changes were pretty simple, I basically added Linear Regression Slop data to the entry and I used Trendline MAs for the only exit strategy. These two things make up for some parts of the weaknesses you described above, in that it forces the system to only take trades in volatile environments, and it let’s the trades run probably longer than a technical indicator would. I made very minor changes to Lazy’s basic entry (although I use no MA) and my periodicity is different ($1 range bars), but I think that both capture the same idea Lazy is after.
Unfortunately, my data is even more limited that yours Woodshedder at five days.
The short trades dragged my grand totals down a bit, but I wanted to mostly use the same variables (even though the price seems to drop quicker than it goes up), but I did not want to force curve fitting on the shorts just to try and match the longs. I will post the full results for you guys when I get a chance to write something up. The quick and dirty –
Longs;
Total Trades: 15
% Profitable 66%
Avg Winning Trade/Losing Trade: $238.75/$137.50
Shorts:
Total Trades: 13
%Profitable: 38%
Avg Winning Trade/Losing Trade: $245/$119.64
Although the number of trades is small that is still 28 trades in five days. This is just for ES, although I did test it against one other Future, and the results were similar.
I will post my full results along with a discussion soon. Thanks again for all the hard work and help!
Well, that answers my question Wood.
If the MC matches the out of sample testing then however they’ve coded it up, it must not encounter the issue I was concerned a bit about.
SkyTrader – random number generation is as hard as it can get for software engineers and the place where shortcuts can often be taken to horrific results.
The wikipedia link http://en.wikipedia.org/wiki/Random_number_generator has this line which is part of my point:
Most computer programming languages include functions or library routines that purport to be random number generators. They are often designed to provide a random byte or word, or a floating point number uniformly distributed between 0 and 1.
Second point: I took a look at the standard deviations for last fall in the DOW a while back – I found that there were huge sigmas – 4.5 or so. Under a gaussian curve those are nearly impossible as 95% of all points come within 2.5 standard deviations of the arithmetic mean.
Lastly my concern can be explained this way (to borrow from Van Tharp)
Take a vase and a series of 1000 balls. Each ball has a return scribbled on it from the sample data set. During the MC, a ball is pulled and the return on it written down. This is your MC test.
Now, if each ball is under a uniform distribution and has the same opportunity of being drawn as the next – do the results of the MC mirror the data curve or do they mirror the uniform curve of the balls being drawn themselves?
Hope that explains my pause.
As always, nice work Wood.
Thanks for the reply Cuervos, it got me thinking about a number of things and helped clarify others. I think this is a very interesting issue and would love to hear more from you (and others) about it.
From what I understand, when doing an MC simulation on trade data, one mixes up individual trade outcomes. I don’t expect the distribution of these individual trades to be Gaussian at all, however — rather it depends strongly on the R/R applied and the volatility near the trades (if this distribution was truly a normal Gaussian, you wouldn’t make any money– there would be equal total wins and equal total losses — or would you expect the distribution to be Gaussian but with an offset? Still not sure about that. This is something I will plot soon and check in detail). Is this where your comment about a lognormal distribution comes in?
I understand the difficulties with designing good random number generators, and see how this could have an effect on an MC test, but I’m not sure where Guassian statistics come into play with trading MC tests in particular. I suppose it is when you quantify the scatter of all the MC trials, but given that I don’t expect the pool of original trades to be Gaussian-distributed, I’m not sure that using Gaussian stats to quantify the MC results is the right thing to do. BUT this does seem to be what is done, so I must be missing something or being over-critical of some assumptions made. There’s probably a whole literature on this that would help me out here, but I’m lazy. Anyone want to clarify or expand on this?
Does this help Sky?
http://en.wikipedia.org/wiki/Stock_market_crash#Mathematical_theory_and_stock_market_crashes
Essentially, the crowd splits into whether or not the market follows a Gaussian distribution or a log-normal distribution.
http://en.wikipedia.org/wiki/Lognormal_distribution
To muddy the waters somewhat – I’ve noticed that while the market itself seems to be log-normal – the derivatives tend to fall within a normal distribution. Example: one can use a ZScore with regards to the “returns” (subtracting yesterday’s market score from today’s market score) and make some fairly accurate timing mechanisms.
note: if you search through my posts for ZScore you’ll see a prototypical mechanism.
And when examining Extreme Value Theory – the times when the market is moving past the 3 Standard deviations – then those market behaviours follow a separate distribution altogether.
Finally, the closest kin to Monte Carlo methods is called the bootstrap method: http://en.wikipedia.org/wiki/Bootstrap_(statistics) which has been used in academia for a while now, especially when the data sample size is not large enough for a reasonably statistically significant pool to infer from.
To wit: when using MC or bootstrap methods – it’s generally understood that reliable results are not found until one creates 10k samples (see wikipedia link)
Wood – please moderate my above comment. Thanks.
Woodshedder,
Thanks for sharing your experience, even when the results are not what you expected.
Let me just say, catering to the 0.0001% is a brave task.
Congrats to you.
Management.
lol, The Fly must have been drinking some tonight…handing out compliments and all. Even if they’re somewhat backhanded.
“Somewhat?”
rofl.
_____
Fly, I will be moving on to topics of a broader appeal, direckly.
Wood — sorry for hijacking your comments section and pushing these issues here. I’ll let you know when I post some results you might be interested in, and we can discuss them there.
Cuervos — thanks for the info. Interesting stuff.
Hey there this is a good post. I’m going to e mail this to my buddies. I stumbled on this while browsing on aol I’ll be sure to come back. thanks for sharing.