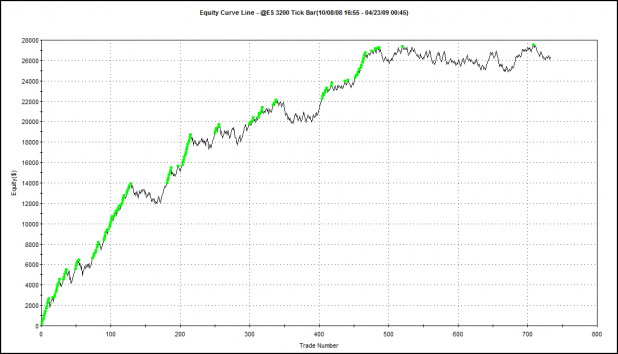
This was a very basic test. I simply coupled Lazy Man’s entry with his time of day requirements (9:30-3:00) and set the optimizer to calculate the best Profit Target and Stop. The system was optimized for highest net profit. I tested values between $50-$2,000.
I was surprised that the best stop turned out to be 3x the size of the profit target. I assumed it would be the opposite. However, the $900 stop has only been hit twice. As noted previously, the stop-and-reverse nature of this system means the system never moves very far against itself before closing out the losing position and opening one in the direction of the new trend.
Note the win % increased, as expected.
Overall, the metrics are mediocre.
The Equity Curve:
The Final Installment
Soon, I will put together what I feel to be the best parts of this system, optimize it, and run it over in-sample and then out-of-sample data. I’m very excited to see how it turns out.


Indeud.
Indeud we trust.
I have a question for Lazy and/or Woodshedder. How much of a benefit to you see in using ticks per bar (I cannot remember off the top of my head if you are using 3200t/bar or 2600t/bar) versus a time/bar setting. And secondly have either of you guys ever used a change/bar or range/bar setting?
Red, before working on this system for Lazy, I had never ever used tick bars. I now think there is a great benefit. I’m not sure I can explain why, or if I even know why, but there is. Part of it may be that there are edges that exist over multiple time frames. If most are using time bars, it may be that tick bars do not have the edge traded out of them as much as time bars do. I believe that any future work I do on futures will always use tick bars.
I have never used change or range bar settings.
Wood,
Wow, the tick bar statement really hit me. I love them for what they have done for my trading. I’ll add a quick post to the PG later showing the differences in the charts for Redshark.
I’ve always wondered about the “edge traded out comment” and I agree that it is sometimes beneficial to be looking at the market “differentlyâ€.
chalk up another win for the good guy.
Its hard to hate on you Fly, so I’ll let you have this hollow victory.
Oh, hey Fly. Good to see you over here.
Redshark,
Well, I was going to post but I want to spend some time with my kid tonight.
I did find this for you though and it does a pretty good job of ‘splainin.
I would add that they did not discuss the edge vs. time charts in that few traders are looking at ticks. Wood makes a VERY good point with that one.
I can show endless examples of charts that smooth out to the point where you might even think that it is not the same price action. It’s really amazing (to me at least) how they reduce chop.
http://emini-watch.com/tick-charts/408/
I would really like to see more on the interpretation of the bars myself. For example, a short bar with high volume usually indicates support or resistance while the same bar with low volume usually indicates a dead market.
Wood,
$900 stop hits must have been in a very slowly trending market – no full cross over the MA so the stop and reverse was not triggered. Price action stayed tight with the MA but continued to grind away from the entry?
I would have to believe that, in that situation, trader discretion would come in and say enough of this noise…
Redshark,
Sorry…
3200 ticks for ES
233-333 ticks for 6E (mini-euro)
400 for ZB (e-mini bonds)
1800 for YM (e-mini dow)
333 for EMD (e-mini s&p 400)
133 for CL (crude oil)
133 for YG (gold) DAMN!!! 1 trade today in gold – would have caught $20 – that’s a lot of damn money with 1 contract!!
These are from memory – look for avg. bars to form in 2-7 minutes (depending on volume/time of day).
You should see nice trends with these settings. You should also see that the chart will take about the same space as a 5 minute chart.
Wtf are you guys even talking about over here?
__
JC,
high level shit.
Lazy,
Thanks for the info. Today, I found a setting in my software that allowed me to set the bars to a set range or a set price change. I watched both of these settings today vs a min bar chart. It was amazing to see the differences, much like what was described on the link you provided. I wrote a quick little trading system loosely based on the info you and Wood have provided with a few tweaks that I use in longer term trend trading. Made my first futures trade with ES, made a nice little profit.
Look forward to learning more from, and by learning I mean stealing all of your ideas.
Thanks for sharing your hard work!
Redshark,
1st trade – that’s freakin awesome – great job.
Yeah I caught a nice little run, which was kind of nice in such a choppy freaking day. At least it felt choppy to me.
Just a little unnoticed Dow Theory non-confirmation. But it could turn out to be BIG. The Dow failing to rally to a new high above its April 17 closing high of 8131.33. On Wednesday the Dow closed 174 points BELOW its April 17 peak .
Today the Dow closed at 8076. The non-confirmation still stands with a differential of 55 points. Transports were up 29 which put them at a new high. This is the only system you need woodshedder.