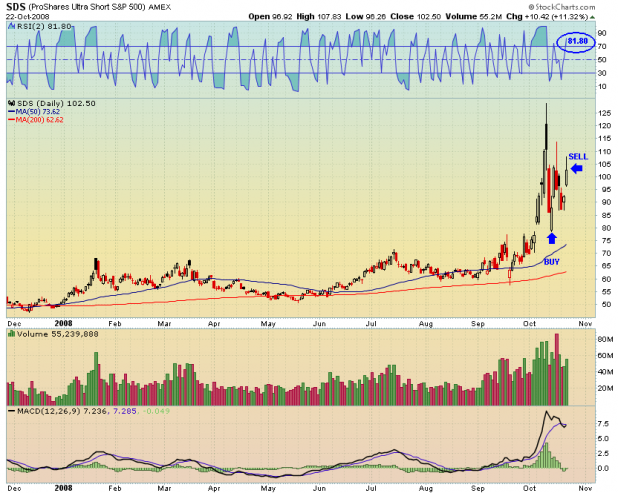
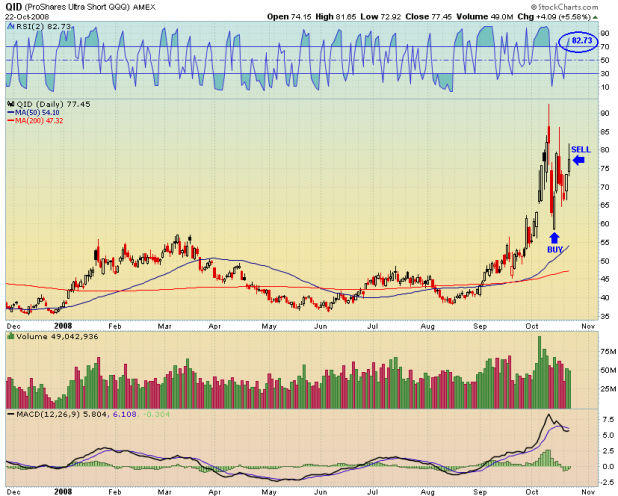
[[SDS]] and [[QID]] both closed today with an RSI(2) greater than 80. This means the exit criteria was met and the diETFs will be sold on the open Thursday.
In the spreadsheet above, both open positions are marked-to-market with today’s closing prices highlighted in yellow.
The system will have generated a 75% win rate, in 8 trades. Based on the backtesting, this win rate is higher than expected and will likely trend lower from here.
I have included charts of SDS and QID to show how the trades looked.
No New Entry Signals for Thursday.
Â
Â


Just wanted to give you a pat on the back. The system is obviously working out well.
Ducati is an asshole.
Thanks Ozark.
By the way, one side of my family is from Iron Mtn., MO, which is right near them Aux Arks.
Shed – good on you. why do you think better than expected results? is RSI2 a better indicator in volatile markets?
Boom, only the exit signal uses RSI2.
When testing with a 4% stop, we had about 60% winners over the last 2 years. With a 6% stop, that number jumped up to around 70%.
The stop determines, in a large way, the percentage of winners. I think better than expected so far only because of the small sample size.
When I use scottrade I can get the RSI, but if I look at a 3 day chart with 1 min intervals, it is much different than a 5 year chart with 1 month intervals.
How is the RSI determined in the system, and how would I figure out whether or not SCC or EFU has broken 80, if I were still in them?
Thanks.
Since the max draw down is’t very big, have you back tested the shorting the opposite ultra ETF?
So if system says “long on UYG”, you would instead short the SKF, and if it said “long SKF” you would short the UYG?
Seems like shorting the opposite would work better, provided you have the cash on the side to avoid the margin call.
I believe the system uses daily RSI(2) values.
_______________
Along with ‘derr’s idea…say the system gives you a buy on UYG. You would go long UYG, long XLF, long IYF, and short SKF. Yeah, it would increase your drawdowns (which don’t seem to be too big), but it would quadruple(?) your profits?
Dpeezy,
This would be about the same thing as trading the system as-is at 4% risk per trade rather than 1% risk per trade. Rather than deploying 25% of your equity per trade with a 4% stop (.25*.04=.01) you would deploy 100% of your capital per trade with a 4% stop (1*.04=.04). The drawdowns would likely be more than most could handle. Max DD would have been about 30% backtested but with the short backtest history, I would double that number for a realistic scenario.
Whosthisidontknow:
First, like many indicators/oscillators, RSI uses a lookback period to make its calculation. For example, the standard RSI lookback period is 14 days. Another example might be MACD, which uses moving averages. Of course a moving average is very simple calculation of the average over a specific lookback period. Regardless of what the indicator/oscillator is, it is going to use past data to arrive at the current value.
For this exit, I use RSI(2), which means a 2 day lookback.
However, and this is where it gets a tad more complicated, on a chart, the lookback period is set by the time covered in each bar. So if you are looking at a 3 year weekly chart, with RSI2, it is calculating 2 weeks worth of data (each bar being 1 week, looking at 2 bars). If you are looking at a 3 year daily chart, with RSI2, then it is looking back at only 2 days worth of data.
What about a 10 year monthly chart? An RSI14 setting would look back at 14 months worth of data.
So to follow the system, you would need to set your RSI to a 2 period setting, using a daily chart.
If you do that, you will find that tonights reading will match the readings on the charts I posted above.
LOL Iron Mountain …. that is not a bad place at all compared to other small towns around these parts. It has been years since I made it over that way.
Im not sure if this question has been asked, but how has the market behaved on the day following a no new entry signal from el bamboo grande?
thanks in advance
Gwar, I’ve never thought about it, really. All the dates are available in the spreadsheet above, if you want to take a stab at it. I’d even get you the trade by trades from the backtesting.
system idea is interesting.
how are you determining the optimal stop? what have you found to be the best backtesting tool?
Bazily, backtesting to determine optimal stop. Although the stop that is optimal is one that fits both the strategy and the psychology/risk aversion of the trader.
Best backtesting tool is hard to say. I haven’t used very many. I’d say any tool that is relatively intuitive to code and allows for testing across the entire universe of stocks, or just a portfolio, would be near the best. The most important thing is to be able to test money managment strategies, which will lead to stop development.