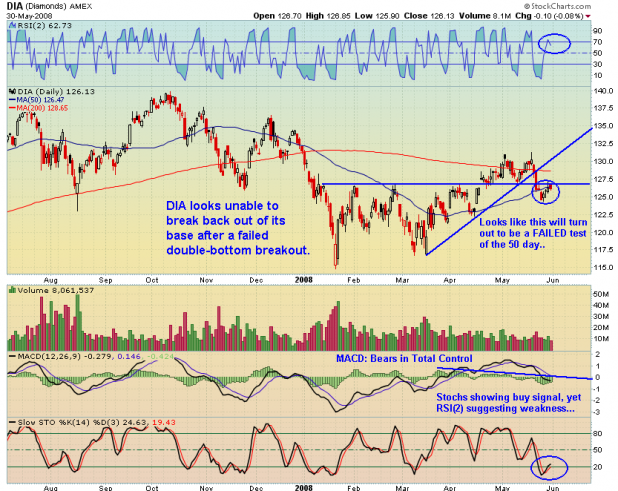
My money will be on the bears as we head into the first week of June. The technicals have been weakening as the momentum from the 2 month bull run subsides. The [[DIA]] is back within its base after a failed breakout, and it looks as its attempt last week to claw its way back out, has failed.
The MACD for the Diamonds has been in negative territory for almost all of May. The RSI(2) reading is not extreme, but is more overbought than oversold. The Stochs, however are giving a buy signal. I believe the Stochs are likely to stay oversold here for a bit longer and that this buy signal should be ignored.
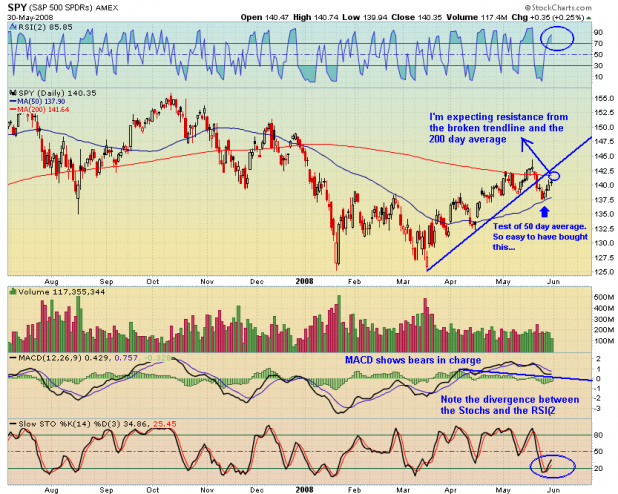
The [[SPY]] has been a tad stronger than the DIA, but has approached its broken trendline from beneath and looks like it has met resistance at the 200 day average. The SPY has a divergence between the RSI reading and the Stochs. Again, I’m likely to take the RSI signal and ignore the Stochastic reading here.

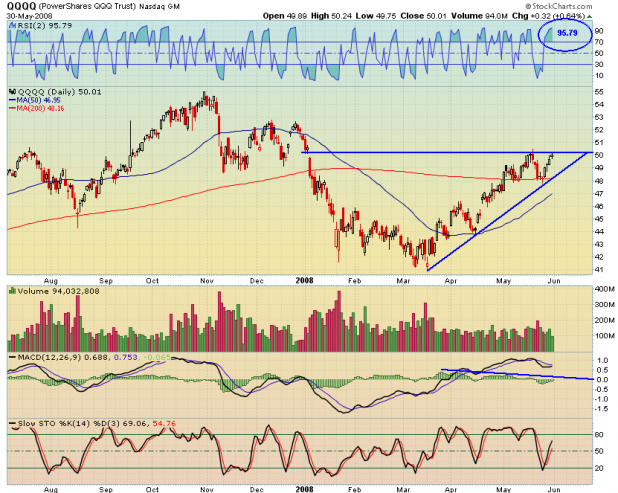
Without a doubt, the [[QQQQ]] has been leading. This chart is very sound, technically. Of course the RSI2 is high, and the MACD is negative, but the ETF has been able to bounce successfully from its 200 day average and is still above its uptrend line, which started in March. That is all very bullish.
However, the Qs were unable to surpass the May high, and they printed an indecisive little candle on Friday. Should there be weakness this week, the ETF will possibly make a lower high. Bears should not ignore the strong support at 48, nor should they forget the rising 50 day average.
Due to these factors, I will open short positions on the indexes, but I am likely to take a smaller position in the Qs, for fear of more strength revving up before any short position can get ahead.
LIkely to cast a pall over trading towards the end of the week is May’s Employment Situation, due to be reported Friday at 8:30 a.m. I think this report will just add to the slowing momentum.
One item of consideration for the Bears should be the statistical edge the first three days of every month have over the rest of the days. Read about it at TraderFeed: Is There a Bias to End-of-Month Trading?


Good analysis – I think the Dow and to a lesser extent the S&P look like they are setting up bear flags here. S&P looks like a possible H&S pattern as well. Nasdaq possible double top. I lean bearish this week as well, but I think oil is going to have a big say on what happens. If it stops pulling back and heads higher, no doubt in my mind this market heads lower – perhaps the straw that breaks the camel’s back. But if oil keeps pulling back, I can’t imagine the market selling off a big amount, even given the technical outlook.
Expect a very volatile market this week.
From Raymond Merriman at mmacycles
“Heliocentric Mercury now begins its passage through the volatile sign of Sagittarius, June 1-12. Usually financial markets will commence a powerful 3-8 day rally or plunge during this time band. Add to that the observation that markets which are rising from the time Mercury turns retrograde will usually suffer a sharp collapse around the 8th calendar or trading day, and you get a picture of some fireworks likely to unfold this week. The 8th day of Mercury retrograde coincides with June 3-5. June 3 is also the new moon day – a Gemini new moon. Gemini is an erratic sign in terms of market behavior too, so it all points to a very volatile trading week coming up.”
Also be aware that there will likely be a significant turn (a relative high or low) in the markets that will last months.
The Bradley model is roughly 70% accurate at predicting major turning points within 4 trading days of it’s occurence. The next significant Bradley date is June 7th. And it’s 4 day trading range would be June 3-12. This isn’t an ordinary Bradley date either, it’s one that should be of much greater significance, indicating potentially a stronger and longer lasting move from it’s peak/bottom.
I think we could see a upward move on Monday and possibly in to Tuesday and then plummet for 3-8 days from there, where I believe the market will form a significant turning point. Probably sell into strength on Monday.
http://www.robertew.com/bradley/br2008.jpg
http://www.amanita.at/e/faq/e-bradley.htm
Just give me a buck or two on my QID trade, that’s all I ask!
Wood,
Just had a look at DIA on a WEEKLY chart, as opposed to your DAILY…technically, it would seem to corroborate the DAILY.
The only difference being that there is some technical space available to go higher prior to bumping into your favoured 50MA
This would be a distinct possibility in that I wouldn’t have drawn my HORIZONTAL S/R line where you have. Mine would be a little higher for RESISTANCE, and a little lower for SUPPORT
jog on
duc
Thanks Duc. The 10 week average never seems to correspond exactly with the 50 day average, for obvious reasons, I guess.
Strange, to hear you evaluating, and discussing technical analysis.
Dogwood, if you don’t get your buck, its gonna be a bad week for the bears.
Wood,
Hell, I’ve a 50/50 shot at being right.
But actually this is a sentiment driven market currently. There are not many, if any compelling valuations. Thus it is nowhere close to the bottom of a true bear market.
If its not the bottom of a bear, it’s tough to argue a new bull market.
Thus we are left with a rangebound, choppy, nasty market. TA has much to offer in this type of market.
jog on
duc
Who posted the cheeky picture? I’ve pinched it.
Is the set up we are seeing on the S&P looking like Apr-May 2001, March 2001…or May 2003?
We are at a critical juncture here this month.
ADawg, I’m expecting a long, slow, grind, much like after May of 2001.
Which index are you looking at?
Duc, that would probably be Jeremy, Vincenzo’s boss, and the Admin here.
That’s my take on it too Wood. Friday’s trading was in a very tight range with a couple failed attempts to break higher in the afternoon. I feel good about my QID trade, but am prepared to day trade around it if the market rallies Monday or Tuesday.
Wood,
Indeed.
Have a look @ DIA on a PnF chart.
Looks very bullish.
What is Alpha’s take on the PnF?
jog on
duc
The offense is still on the field.
DJIA not in big trouble until 12,400.
SPX is starting to rollover, but still has some support at 1350. A break below that would be bad news for the bulls. The
200 DMA is 1425. Looks like we still could go either way.
I’m cautiously bullish.
Duc is WAY out of character tonight, as a point in fact.
Asking for someone else’s opinion?
Pah!
el-midge,
That didn’t take long…When the eagles are silent, the parrots begin to jabber.
jog on
duc
Uh oh…
“Dooc” getting sententious again.
_
Went long QID, UWM, MZZ this a.m.
Did you note the huge volume surge Friday at the close in QID? What is your exit rule for QID today?
Norcal RSI(2) > 80
If QQQQ’s break through the 20day you might as well hold till it hits the 200 day. QID should be somewhere around 40.30.
This is the perfect case where the QID and inverse QQQQ’s are not even close, scamming etf’s.
Wood – Do you know if stockcharts.com allows you to scan for RSI (2) conditions? For example, RSI (2) >80 >2 consecutive days? On the QID exit, would you also incorporate a time-stop (e.g. exit at end of day)?
Cubs, the leveraged/inverse ETFs are not designed to correlate perfectly to the underlying index over long time spans. A careful read of the prospectuses shows that they intend to mimic as close as possible the DAILY performance of the underlying index. So lets say that on Monday, the Qs drop 1% and the QID drops 2.05%. That last .05% is not adjusted for, ever, based on my read. On Tuesday, the whole process begins anew. So over time it is reasonable to expect that they do not track exactly a 1:1 correlation.
Norcal- send me an email woodshedder_blogspot at yahoo.
DUG looks to be continuing it’s move up. Looks like it could pop $5 or so from it’s current consolidation.
latex gals lesbian lesbian gals latex