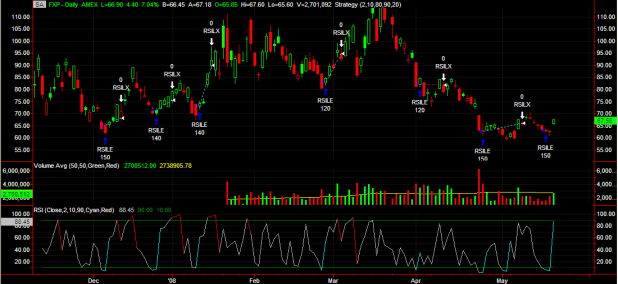
The RSI(2) strategy has been working extremely well on [[FXP]]. The last entry signal was given Thursday for an entry on the open Friday. The latest exit signal was given today, for an exit tomorrow on the open.
The chart above shows the entries and exits with RSILE = Long entry and RSILX = Long exit. A $10,000 account size was assumed with each trade allotted the full 10K. The number of shares purchased is listed below each entry.
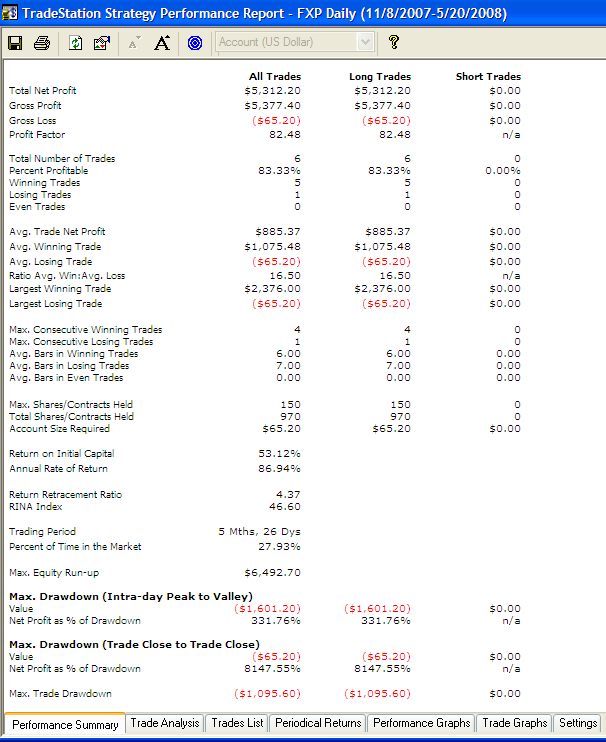
The performance report is listed below. The results are fantastic.
Not included in the performance report is the open trade from Friday. If the trade is closed tomorrow on the open at today’s closing price, add another $650.00 to the profits.
The typical caveats apply here. Past results are no blah blah of future blah blah blah. In other words, FXP may never again work as well for this strategy as it has over the past 6 months. Statistically speaking, 7 trades do not provide enough data to generate significance. On the other hand, should this stategy keep working this well for another 6 months, one will have doubled his initial capital after only one year.
I have yet to develop a stop-loss for this strategy. Stops are not necessary until they are necessary, and every trader has differing squeal points. It looks like setting a stop of around 20% would have kept you in all the trades while risking only 2% of a 100K account.


if China tanks overnight and US opens lower Wed. morning, would that affect the RSI(2) signaling you stay in FXP on the open?
Yea, this is just silly. I think you are right about simply using a moderate-sized catastrophic stop. I have tried a few things (for protective stops) and nothing has really worked that well but I have a few more ideas. I will eventually run some maximum adverse exursion tests when I get a little further into it to help come up with a good number for a protective stop that won’t cut to many winners short. The only thing I am really seeing that I am uncomfortable with is the short trade history on the ETFs but I am also running it on a couple of stock portfolios to generate a lot more trade samples and it is holding up nearly as well there, particularly if the stocks are trading above their 50-day sma.
Buylo, no. Once the RSI(2) closes above 80, the strategy enters a sell for the next open.
One of my goals in system creation is to create ones that can be traded by people like myself who work full-time and have to place orders outside of the normal market sessions.
I guess my question should be: are there any market conditions that would affect the RSI (2) intraday, so the buy or sell signal would change rather quickly?
Bhh- in previous testing on Stockfetcher, 12-15% seemed to get the trader out before taking a big loss while preserving a high win ratio. It was run on QID QLD SSO SDS DDM DXD.
I like the idea of trading 10 ETFs using a 20% catastrophic stop as then maximum drawdown is 20%, unless one reloads and gets stopped out of all again. The win ratio is so high that I doubt that is probable. I think you’ll find the system recovers very quickly as well.
Of course next we’ll have to look at a short strategy for stocks trading beneath the 200 day avg.
Thanks for helping with the testing. I really appreciate it.
Buylo, check out this length.
http://www.investopedia.com/terms/r/rsi.asp
Because we use a 2 period RSI rather than the more standard 14 period, the readings change very quickly, pretty much simultaneously with price. So definitely, the RSI(2) can have large intraday swings, assuming the price is volatile.
Buylo, I think I’m getting the gist of your question, finally. Sorry it took me so long.
Look at it this way. There is an RSI(2)reading that signals an entry and an exit. If you were to find that reading was signaling an entry or exit, intraday, you could place the trade a minute before the close. However, I do not recommend that, but it is only my intuition and hunches that lead me to believe it is better to wait until the next open. I suspect that extreme RSI(2) readings create momentum that often follows through to the next open, which will work in the favor of your position.
This is for the full leveraged etf portfolio I emailed you last night. I am going to email you a full pdf later this evening. I am only running everything through end of 2007 as I want to keep some unused data for out-of-sample testing.
Equity Report for TradePlan
_RSI2 06/21/06 to 12/31/07. System is TS_PERCENTRISKPLAN(100, 1000)
Start Size $10,000.00 List of Sessions:
First Equity Date 09/01/06 BHH_RSI(2)
Last Equity Date 12/31/07
Number of years 1.3306
Return Over Period 285.06%
AnnualReturn 214.23%
Compound Annual Growth Rate 175.45%
Percent Maximum Drawdown 28.95%
Date of Maximum Drawdown 10/09/07
Date of the Longest Time Between Peaks 01/04/07
Longest time between peaks 91 days
Average time between peaks 16 days 03:18
Sharpe Ratio 1.6556
MAR 6.0595
Bhh, that is truly a ricockulous return. If there was a smiley that would high-five, I would put it here. I’m looking forward to the .pdf
Nice returns Woodshedder! Has it played out consistently like this in non FXP equities? Keep it up!
BD
Wood,
I just ran a quick backtest on the Nasdaq 100 using the RSI(2) entry and RSI(2) exit. Results are here.
nice dogwood. I’ve been doing running similar test on equity portfolios as well with similar results. On stocks, I’ve noticed better results by adding a condition that requires the stock to be above it 50-day SMA and being more restrictive with the RSI value, <= 5. This limits things too much on ETFs but with stocks, there are plenty of oppertunities. Also looking at requiring the RSI to be below 5-10 for 2-days in a row…
Bluedog, thanks.
It has played out very well from a win/loss ratio across all equities I have tested, but FXP is likely an anomaly, though it seems to really like the ultralong/short etfs.
I just ran it across 20 years of S&P data and it still has greater than 70% wins and the losers are not much bigger than winners.
bhh, I started testing RSI < 10 for at least 2 bars on one minute daily charts for day trading setups. Any doubt that it works?
this could even help the Fly! (but save it for a birthday surprise)
blah, blah, blah.
What are you saying?
You talkin’ to me?
yeah.
This is a very Ducatiesque post.
BTW: I believe I scared him off, last night.
hi there,
i am new to this site, but find it very interesting and study it regular. as i have full time job so have little time to trade here and there.
I have a simmilar approach which i picked from a yahoo group, works very well. so wondering if u tried your method using option. which will limit the downside to a great extent and probably upside will be OK.
Fly, you must have a sand spur in your knickers.
Bill-
Welcome. I would love to hear more about your approach. I have never tried using options. I never considered that options prices could have RSI(2) calculated for them. I will have to look into that.
hah
Thank You for saying “Statistically speaking, 7 trades do not provide enough data to generate significance.”
That meant a lot to me.
Looking into to this whole RSI(2) thing myself.
I was skeptical – now I’m intrigued.
Wood,
Take a look at DUG, it’s been triggering a signal for a couple days now. I dunno if you want to step in front of the oil train but it’s a signal.
Wood:
Are the sell orders for the next day LOO (Limit on Open @ market)?
Looks like a good indicator. Last time I bought was months ago when you highlighted it in a post. Hopefully I have similar success this time too!
Zen, just sell at market on open. I believe the momentum favors the position so I want to take advantage of any gap.
iio! Good to hear from you man! I haven’t visited your blog in several weeks. I’m sure you’re tearing the market up…I’ll pay you a visit this evening.
Truth, DUG is part of the ETFs screened by the strategy. I think the system has only traded it once or twice though in the last year.
Personally, I’d rather get some QLD.
Woodshedder – I’m trying to code something similar in TS and can’t get the software to take all the trades. Any idea where I’m going wrong?
—
[IntrabarOrderGeneration = false]
inputs: Price( Close ), Length( 2 ), OverBought( 80 ), OBEExit ( 70 ), OverSold ( 10 ) ;
variables:
MyRSI( 0 );
MyRSI = RSI( Price, Length ) ;
if Currentbar > 1 and MyRSI 1 and MyRSI > OverBought then
Sell ( “RSI80X” ) next bar at market ;
if Currentbar > 1 and MyRSI crosses under OBEExit then
Sell ( “RSI70X” ) next bar at market ;
Johnson, when I get home from work, I’ll send you the code I’m using.
I’m a new TS user, so its better that I just send you what I know is working rather than try and figure out why yours is not working.
wow – don’t know how it missed copying that over…
I’d love to see what you’ve got so far. I’ve been testing it using the set of symbols bhh provided somewhere in this chain and like what I see but can’t figure out why I’m not getting every buy signal. As it is I’ve got 60 winners and 4 losers this year testing them one at a time in TS, DUG being the one big loser.
thanks for the code. I’m going to take a look at it this weekend.
-J
No problem Johnson. Keep me updated!