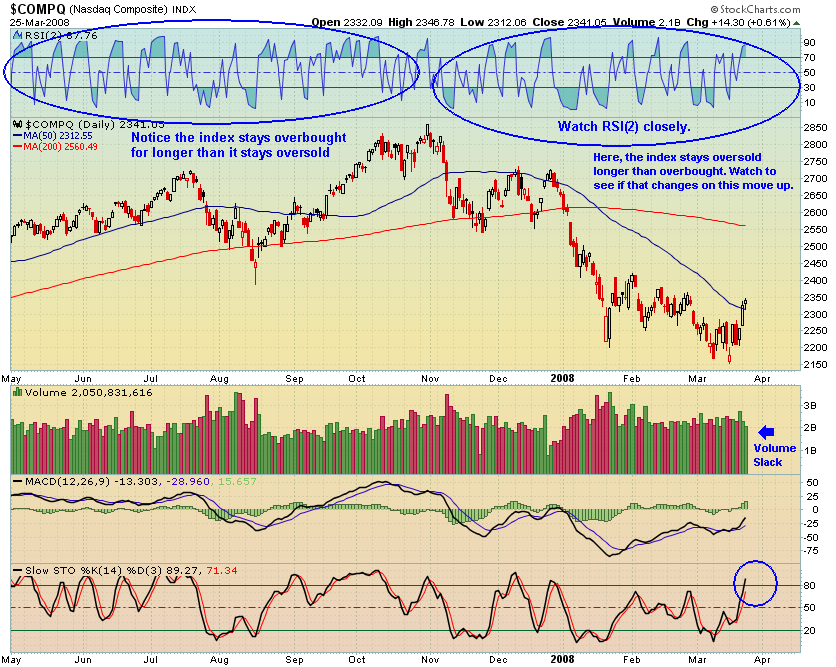
The RSI(2) is painting a clear picture of one difference between an uptrend and a downtrend. During the uptrend, RSI(2) will stay overbought longer than oversold. During a downtrend, it is just the opposite. This Nasdaq chart clearly shows this. What we want to watch for is a change in this behavior. If the indexes start staying overbought for longer than oversold, we will watch for a new uptrend.
Until that happens, all indications point to a pullback.

 The SPY has about 12 more points of RSI(2) before it will hit areas of recent ceilings. Therefore, the pullback may be quick, with 1 or 1.5 strong days to follow, which will allow the indicator to reach the highs necessary for a turning point. If the SPY rolls over here without hitting in the 90s (as I’m somewhat expecting it to do), the run up will be proved weak, according to the RSI(2).

I will be really, really surprised if the Dow Jones does not have a pullback here. I will look to see the 12325 area on any pullback, or about a 200 point drop from today’s close. Should the Dow Jones hold this level on a pullback, I will be a buyer.
I still have not made any major buys after proclaiming a bullish bias here. In fact, I doubled my short of [[LEH]], and bought [[QID]] and [[DXD]] near their lows today. I think the momentum is wearing off this recent push, although I am still bullish on the indexes as long as they hold above the 50 day average.
Should any test of the 50 day average be successful, I will start charting more breakouts and other bullish patterns.


pure guess? We get 150 pts off tomorrow which has people coming out of the woodwork saying the bears are back on top. They will be vindicated for perhaps another day before the bulls squeeze them all. If we get a no-conviction down day, that will be the op to build longs for a swing trade.
Or, the market drops by 10,000 points and the Confederacy rises again!
Civil War II, Jericho-style!
RSI, MACD, Ooo-MawMaw, Shama-Llama-Ding Dong. It’s all a bunch of hooey. The secret is understanding and recognizing the goat tits pattern.
I like Danny’s scenario.
Treepart- we all need something to believe in. One man’s goat tits is another man’s horn-o-plenty. Just wait until we get a “pregnant goat tits double bottom reversal.”
I also agree with Danny. More to go on the upside after a 1-2 day pullback.
Just please, stay “bullish.”
For at least until I can bank some major on this overweight Skiffles position.
__________
Seriously folks, pay attention to what the “lahge” money is doing. Last week, we had one of the largest “selling on strength” days we’ve experienced since about a week or so before the January cascade.
Unless all that “lahge” was just “fucking around,” I’d be reluctant to start looking for long positions any time soon.
Wood;
I can’t thank you enough for your charts. In times like this with High volitivity and manipulation. I don’t trust the charts more then 67%. I like support and resistance etc. However your RSI 2 is great!!!
Wood —
Are you a believer in Dow Theory, w/ regard to “transports leading,” etc.?
If so, chart yourself out a year or so of the Dow Transports ($TRAN) and do the fibs from the July 18th high to the Jan 22nd low.
Pretty freaking awesome, no?
And check the pattern leading up to the Jan waterfall.
Look familiar?
I think I’ll post this chart to the PG.
Wood — or anyone — what do I do if the chart is too large on the PG post? Is there a way to shrink it?
JakeGint:
Great chart. I believe the chart on the Transports are valid information in bear markets due to less manulipulation. Thank you for the input I forgot about looking at the Trans.
Larry aka BPOE, thanks.
When RSI(2), stochs, and MACD are all lining up, it creates a pretty reliable signal.
Wood if your around, could you sometime take a look at XHB chart. Wtf is that shit, some sort of reverse coil, triple top. I’m thinking of getting in around $20 but I don’t know what is going on technically. My baby KBH is the same chart so this is why I’m really curious.
They say after the last leg down the rebound up will leave the bad companies behind. As of now all homies have traded the same.
I win.
Another time machine miracle!