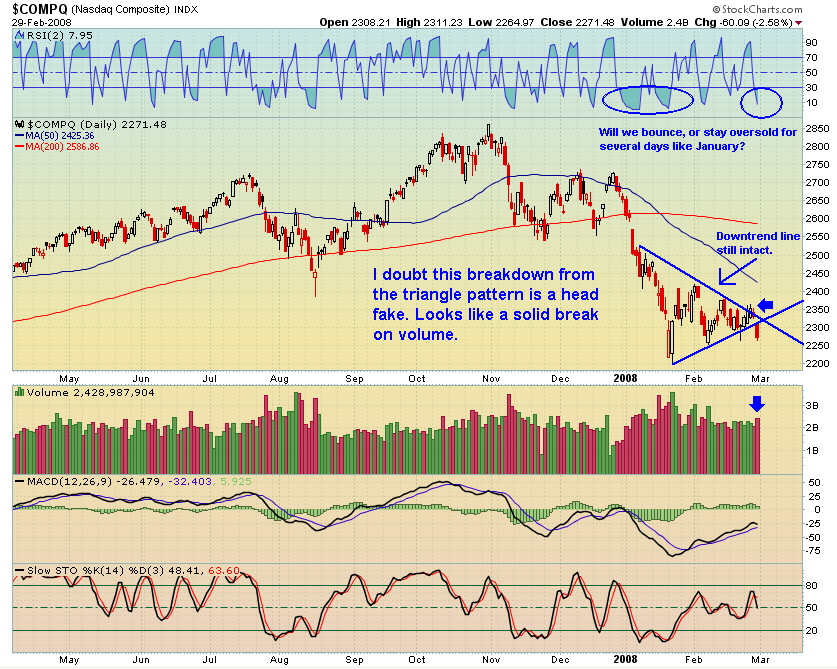
The Nasdaq’s breakdown out of the triangle pattern leads to a high probability of a re-test of lows. I am going to slowly position for the lows to get broken. My target for the Nasdaq is now 2000, or a 12% drop from these levels. At 2000, the Nasdaq will be roughly 30% from its October 31, 2007, high. This level of correction is consistent with historic averages. I have not decided when to remove my long hedges, but I know that I do not want to be holding them on the next leg down.
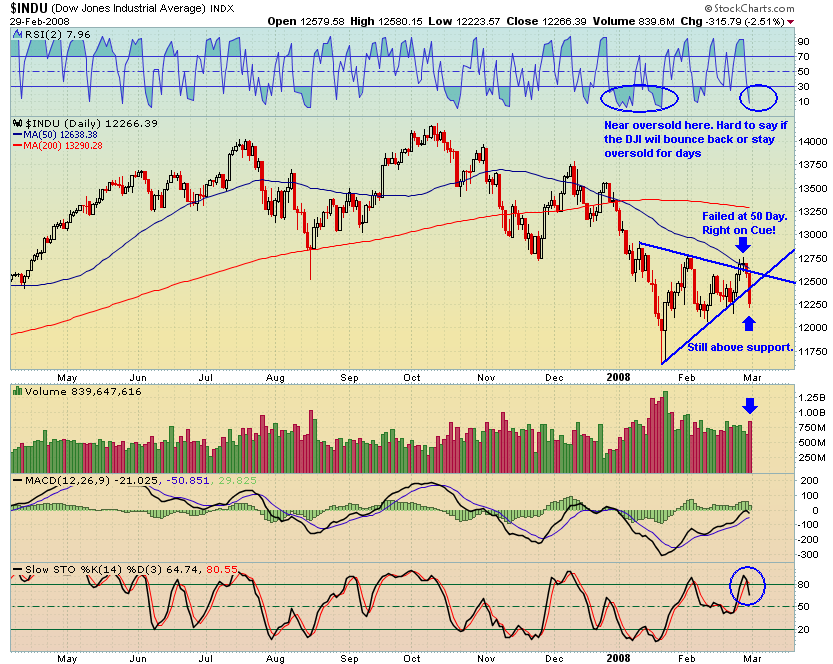
The Dow Jones, despite barely breaking above the triangle, reversed hard to close well beneath the pattern. However, it is still sitting above support in the 12,000 area which has been holding strong for just over a month. I feel the Dow Jones will test and plunge through the January lows. My target for the Dow is 11,000. That is roughly a 10% drop from Friday’s close and will represent a 23% drop from the October 2007 high.

The SPY, similar to the Dow Jones, is still sitting above support. I believe support will fail and the SPY will test lows. Ultimately I see the SPY hitting 120, and that is my target. That would be a 10% move from Friday’s close and a drop of 24% from the top. These levels of corrections for the Dow Jones and the SPY are much more in line with historic averages than what we are seeing currently in terms of a percentage drop from highs.
The VIX is currently nearing overbought levels. I would expect a short-term overbought VIX and indexes at minor support might slow down the descent. However, a quick flush down Monday and then some stabilization into the afternoon will probably finish off Friday’s momentum, leaving a few days for consolidation before breaking the lows.
I encourage traders to take a look at some 5 year weekly charts of the indexes. We are witnessing major breakdowns. These patterns are completely different than anything we’ve witnessed in the past 5 years. In my opinion, those traders that can establish short positions, and sit on them without getting shaken out, will be participating in one of the best trends of the past 5 years.


damn that looks scary, good thing I’m loaded up on short ETFs
PPT to the rescue? Surprise?
http://www.federalreserve.gov/boarddocs/meetings/2008/20080303/advancedexp.htm
Shed – I’m looking at your INDU chart.
Does this breakdown pattern need a confirmation? if so, how soon do you expect to see a one? like this week? What are the odds of the breakdown failing, just as the previous breakout failed?
Lastly, when would this wedge pattern be read as bullish higher lows? What marks a reversal pattern in a wedge like this?
Mucho danka.
Q4- good find. Certainly looks like they are considering another surprise rate cut. I had assumed they would save that for later this week when we have -100K jobs. Whatever.
Boomer- Good questions. However, I’m leaving for work. When I get some time this morning I’ll see if I can answer them. Aside, two of my musician friends who I’ve gigged with made Keillor’s and PHC talent under 30. They play on his March 15 show. They’ll give Welch and Rawlings and run for their money.
Great Post. are you going to by some QID or do you already own?
Gunners, went long QID early last week.
10-4. jump in or wait for a pull back? in your opinion?
nice writeup. if we bounce at the open, please to add more qid.
richard
be patient, it could very well be a fake, especially after it finished the day returning towards 0 and rallying at the end in fairly light volume.
Nice post Wood. I’m still however not convinced that we are not in anything more than correction mode at this point. Textbook correction is 20% or so drop weak rally then retest. I’m too chicken shit to get short so in cash I sit. I’ll probably look to buy under 1300 S&P.
No downside volume today. Instead we’ve got Dojis on the DOW, SPY, QQQQ. I would expect the market to move upward towards Friday’s job report, (possibly as a cushion) should the report be bad but I have a feeling this wedge we’re in will continue for a few days yet, on the upside tomorrow. Namely, I think the shorts are being lined up for a squeeze. Forecast suggests jobs report will be positive. That could spark a short squeeze rally. I suggested go short last Wednesday when we are hitting that upper trend line on the DOW. Now was a good day to cover that. Good luck.
From above:
“The VIX is currently nearing overbought levels. I would expect a short-term overbought VIX and indexes at minor support might slow down the descent. However, a quick flush down Monday and then some stabilization into the afternoon will probably finish off Friday’s momentum, leaving a few days for consolidation before breaking the lows.”
Exactly. I still stand by a breaking of the lows.
I want to converse and debate with you all but I have a major project to wrap up. I’ll get more time soon. Thanks for reading.
WTF happened, did your dad buy CPHD at 29 or something?
i think you are trying too hard to find a triangle pattern by including the pennant from the first week of january.
i see a descending triangle and we are about to rally from it.
check out the charts from 6/2000 to 6/2001. they look almost identical to the last 6 months or so. i think we are due for a rally up to the 2000 day line until reality sets in again. and back then the sp500 did exactly the opposite in december 2000 from what the pattern said it should do because the macd was rising and caused a divergence
the indexes did fall a lot faster back in 2000, but the PE ratios were twice what they are today