
The last 2 weeks saw the indexes challenge 5 year trendlines as established from the lows of 2002. It is interesting that the action of the last few months looks very similar to the action during the 2000-2002 Bear Market. Actually, as the Nasdaq is still well beneath its all-time highs, it has been in a Bear Market since 2000. However, it currently looks the least “toppy” of all the indexes. On the weekly chart, it looks more like a correction than the beginnings bear market.

The Dow Jones has barely managed to stay above its 5-year trendline. However, it is staying above its all-time highs of 1999, meaning it is the only index higher now than 7 years ago, unless one adjusts for inflation.
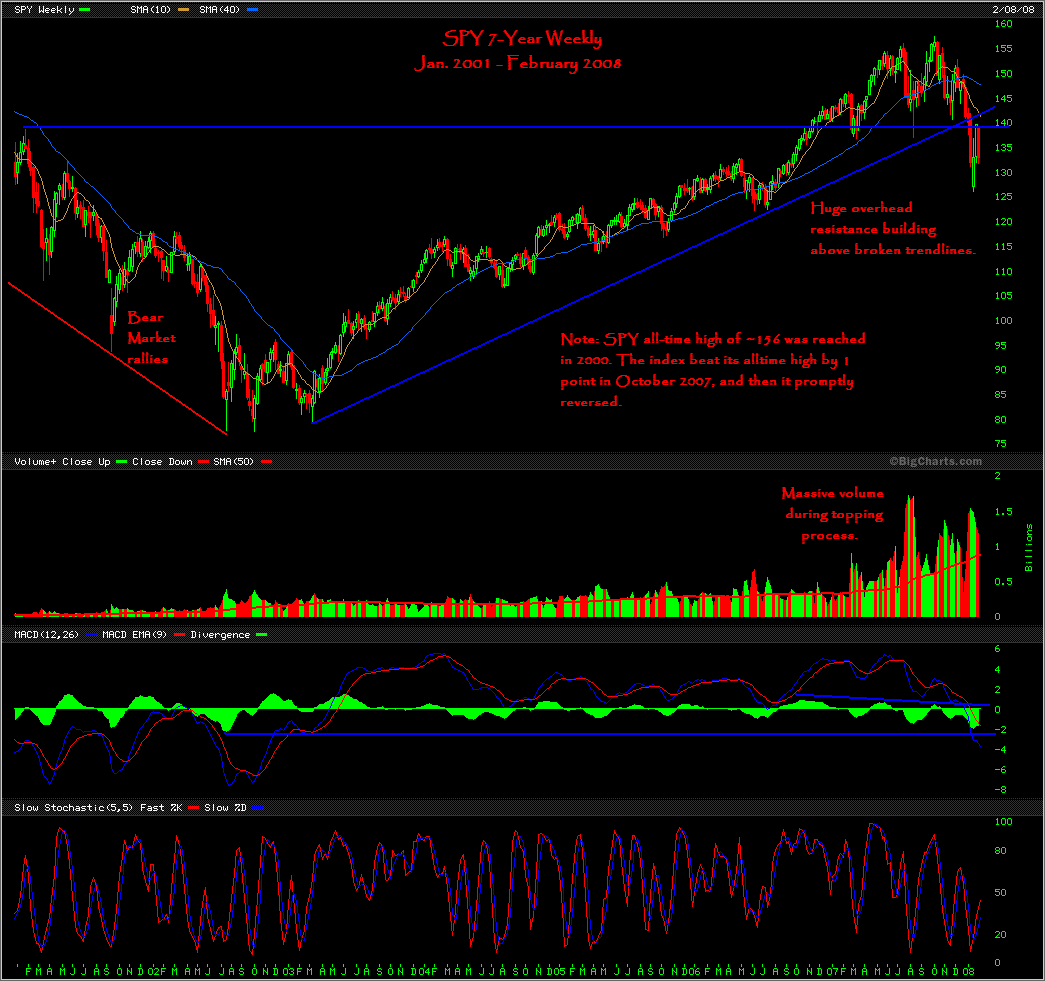
The SPY and the DJI have put in beautiful Head & Shoulders tops. Note the huge Bear Market rallies during 2001. We have yet to see a snapback rally of such a large magnitude. If the downtrend is maintained for some time, it would not be unlikely to see such a snapback rally.
Overall, the last 5 years is starting to look like nothing more than an extended Bear Market rally, as the DJI is the only index still above the highs of 1999-2000.


Wood,
Thus the 2003 lows should be retested.
jog
volume swell= Dem’s taking both house and Senate?
Capture Saddam?
Damn this will bug me for awhile.
Good stuff.
While Ducati is buying fucking REIT’s, “The Fly” will take his bear market winnings and blow up his country, via 4 hand grenades.
Was doing a lil research and came across this info. To me, we have a ways to go before the third leg would happen.
Every leg-down in a bear market is interrupted by a secondary reaction, which may come in two or three phases.
The major legs are rationalized as follows: the first major leg occurs when the euphoric expectations of unrealistically high stock prices are abandoned. The second leg occurs when more stocks are sold based on decreased economic conditions, decreased earnings, a rise in unemployment, etc. The third and final leg occurs when people cash out their stocks because their income has decreased so much that they simply need the money.
Wood,
Nice charts and comments. One question regarding the head and shoulders patterns: since the breakdown below the neckline is about equivalent with the distance from the neckline to the top of the “head” (ie, measured move), do you consider this pattern complete?
Colonic, great question.
I consider the pattern “confirmed.” The question is what usually happens after a confirmed H&S breakdown on the indexes? I’m not sure I can answer that yet.
I think it points to likely range-bound trading until something horrible happens to push us below the January lows. Maybe it is just a confluence of events. I will say that I’m not positioned right now for a break of the lows. While bearish, I think the lows may hold for some time.
Similarly, a break out of the range and above the neckline would signify basing action.