Fellow iBankCoin user, Surf, asked me what my opinion was on the Vanguard Energy ETF (VDE), so I’m just going to walk through a basic analysis of the ETF. For those of you not acquainted with the ETF, here is a general overview:
| The investment seeks to track the performance of a benchmark index. The fund employs an indexing investment approach designed to track the performance of the MSCI US Investable Market Index (IMI)/ Energy 25/50, an index made up of stocks of large, mid-size, and small U.S. companies within the energy sector, as classified under the Global Industry Classification Standard (GICS). It attempts to replicate the target index by investing all, or substantially all, of its assets in the stocks that make up the index, holding each stock in approximately the same proportion as its weighting in the index. The fund is non-diversified. |
The holdings of the fund are major oil and gas names, I have listed them below along with their percent allocation. It’s a pretty basic ETF, nothing fancy here.
|
Selling my recent oil positon, I have no personal desire to re-enter the sector. However, I would actually act upon a trade if it presented itself in two specific areas on the chart: the rising trendline or a break through multi-year resistance. I have provided a 5 year weekly chart and a 2 year daily chart below.
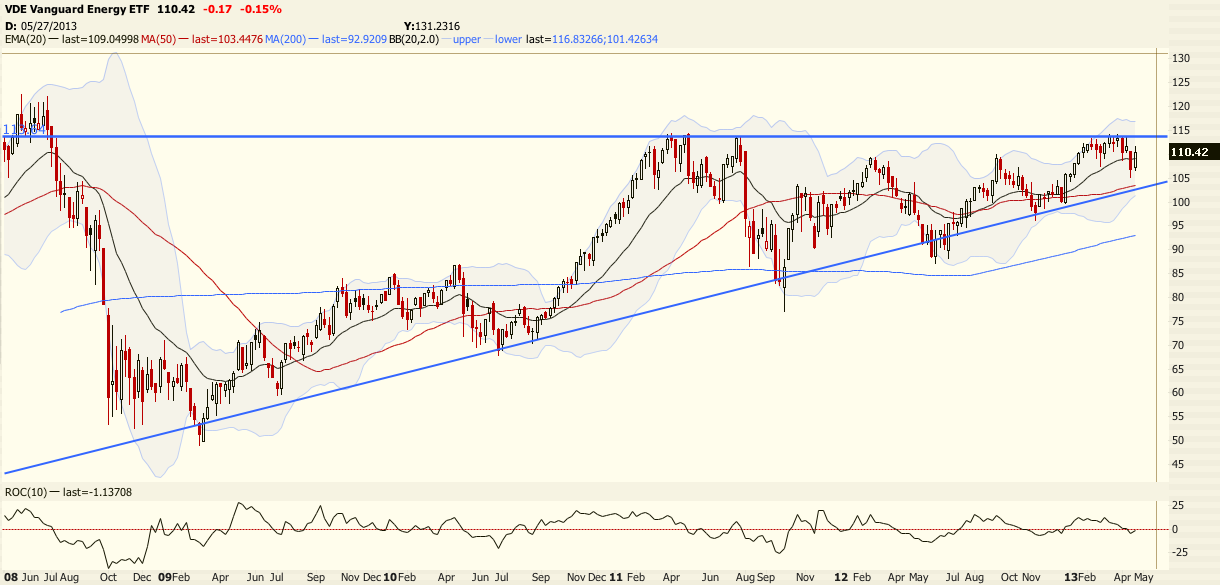

From a technical standpoint, price is currently trading between the two trigger points of the trade. The weekly shows a strong candle, but the daily reveals the possibility for a fade. I believe that the price action in today’s trading session will be a critical factor in seeing how this plays out down the road. My guess right now is that it heads slightly lower, and we roll over to correct into the 50 week moving average on the 5 year chart. A dip to those levels would put me on watch for reversal patterns, which would provide the base for an explosive breach of the upper resistance. However, if we do not fade, then I will look to play a breakout over the horizontal resistance.
That’s my take on it. The general trend is up, so if you own some I would think that you should prepare to stomach a slight correction before hitting new highs.


