Hello iBankcoin!
Sure has been a while, has it not? Funny how things change, both in life and in markets, and how the passing of time creates some weird romanticizing of “the good ol’ days”. They were good, no mistaken qualms about the past here. What I am thankful for though (extra ghost of Christmas past) is the opportunity to rekindle relationships with friends and colleagues of the past, as well as present and future.
That is the general theme of this post — the future. In a world of Government overreach, police brutality, corporate malfeasance, insert pet cause here — I am yet still bullish on the future. I am bullish on human ingenuity and drive, and I am bullish that in the annals of human events, the problems of today are far from insurmountable.
The dichotomy between past, present, and future was inspired by Woodshedder’s post, which provided the impetus to take a different, more meandering direction with my return post, rather than yet another chart of XYZ index (trust me, we’ll get to that).
 The Past: At the time that I left iBankcoin, the good Dr. and I were not on great terms. There was no personal animus per se. It was a volatile amalgam of youth and misdirection on my end, and, well, Fly being Fly (as in, a man of unwavering conviction), both sharing a vision for how great iBC could, should and would be, but disagreeing on how to get there. Both then, and now, it’s his site. Although I’m a fractional owner, I wanted a bigger say on direction. We know how that turned out — site is doing great, and fortunately, so am I.
Over the past year we exchanged a few emails and phone calls, bygones are bygones, and I’m glad to call him a friend through thick and thin. I don’t think I am cut out for keeping my views to myself if I feel strongly, but I did learn an important lesson. In the end, it was because I cared so much about iBC, I was essentially blinded by my perception of what should or shouldn’t be happening, and I was frustrated about it.
To transition abruptly, it is that last sentence that I believe is causing the biggest discord in the USA, tantamount to the general consensus that for many, “things are not right”. Well the lesson is, maybe things aren’t so bad either, and that the finite amount of time and energy each person has in a day is best spent on things one can control to change for the better.

The Present: Not much to report on the present. Well that’s a fib, but erring on discretion being the better part of valor in terms of chest thumping, feels like same ol’ same ol’, except the S&P is higher. I formalized my market research consulting business last quarter, and am leasing the software I designed and developed. In addition to the general achievement of developing software, creating a pitchbook, meeting with clients to demo it, approaching vendors, and having a positive market sales response has been thrilling and rewarding.
Academically, I decided that my social life was just too off the hook, and to ameliorate any semblance of human interaction, I sat and passed the Series 65 exam, and I am pursuing the CFA designation. I wrote level I this past December, and lord willing, will be writing the level II this June (if I passed Level I, which I feel like I did). This should make me a coveted double threat — actual trading experience in the trenches, plus the inhuman ability to price bonds of this duration or that convexity no matter how many basis points the YTM moves.

The Future: The best part of the show. What comes next? First and foremost, I am bullish generally on the markets. I do not buy the deflation argument. Risk assets are going up, stock prices are going up, and yields are down. Would you rather loan to Germany at 80 bps, the only country in the EU that is not completely fucked, or USA at 200 bps? Further, look at real estate. Prices up. REITS? Glad I still hold SRC. Look at hard assets, gold, silver, and oil — all lower. People are dumping hard assets with no yield in exchange for risk assets with yield. Whatever it is, it’s not deflation. Is this trade long in the tooth? Sure. But for the life of me can’t see a catalyst that calls for an immediate end to any of the macro themes at play, just a reversionary lapse in the trend (or two). Unless, that is, Japan and Europe suddenly and magically aren’t deflationary time-bombs, and the US is no longer the new bastion of global financial serenity (shock and awe, amiright?). And if they recover? Great, another bullish catalyst.
Some charts to mull over:
Deflation? Tell that to Capex spending: New orders ex-defense is still robust. Why build out supply if you expected demand to imminently shit the water closet?
Gas Prices Nation Wide Vs. Crude Oil — Huge consumer tax cut, plus input costs down for majority of businesses where oil use or shipping play major part in cost structure. Not to mention, according to Factset, the decline in the oil sector has caused S&P500 EPS downward revisions higher than the 1 yr, 5 yr, and 10 yr average. In bizarro world, this allows for under-promise, over-deliver in future quarters. Companies with high operating leverage (airlines, cough, cough) have been on fire, same with the other 88% of industries not directly levered on the upside to oil prices. Similarly, not much concern yet from the market, which is forward looking.
30 Yr – 2 Yr. Treasury Curve: Simply put, what is the differential in borrowing cost? Bond market isn’t worried yet. Further, while the cyclical change in rate relationships in the 1990s were primarily attributed to easy money / money supply expansion, the relationship now is much more about real return and chasing yield.
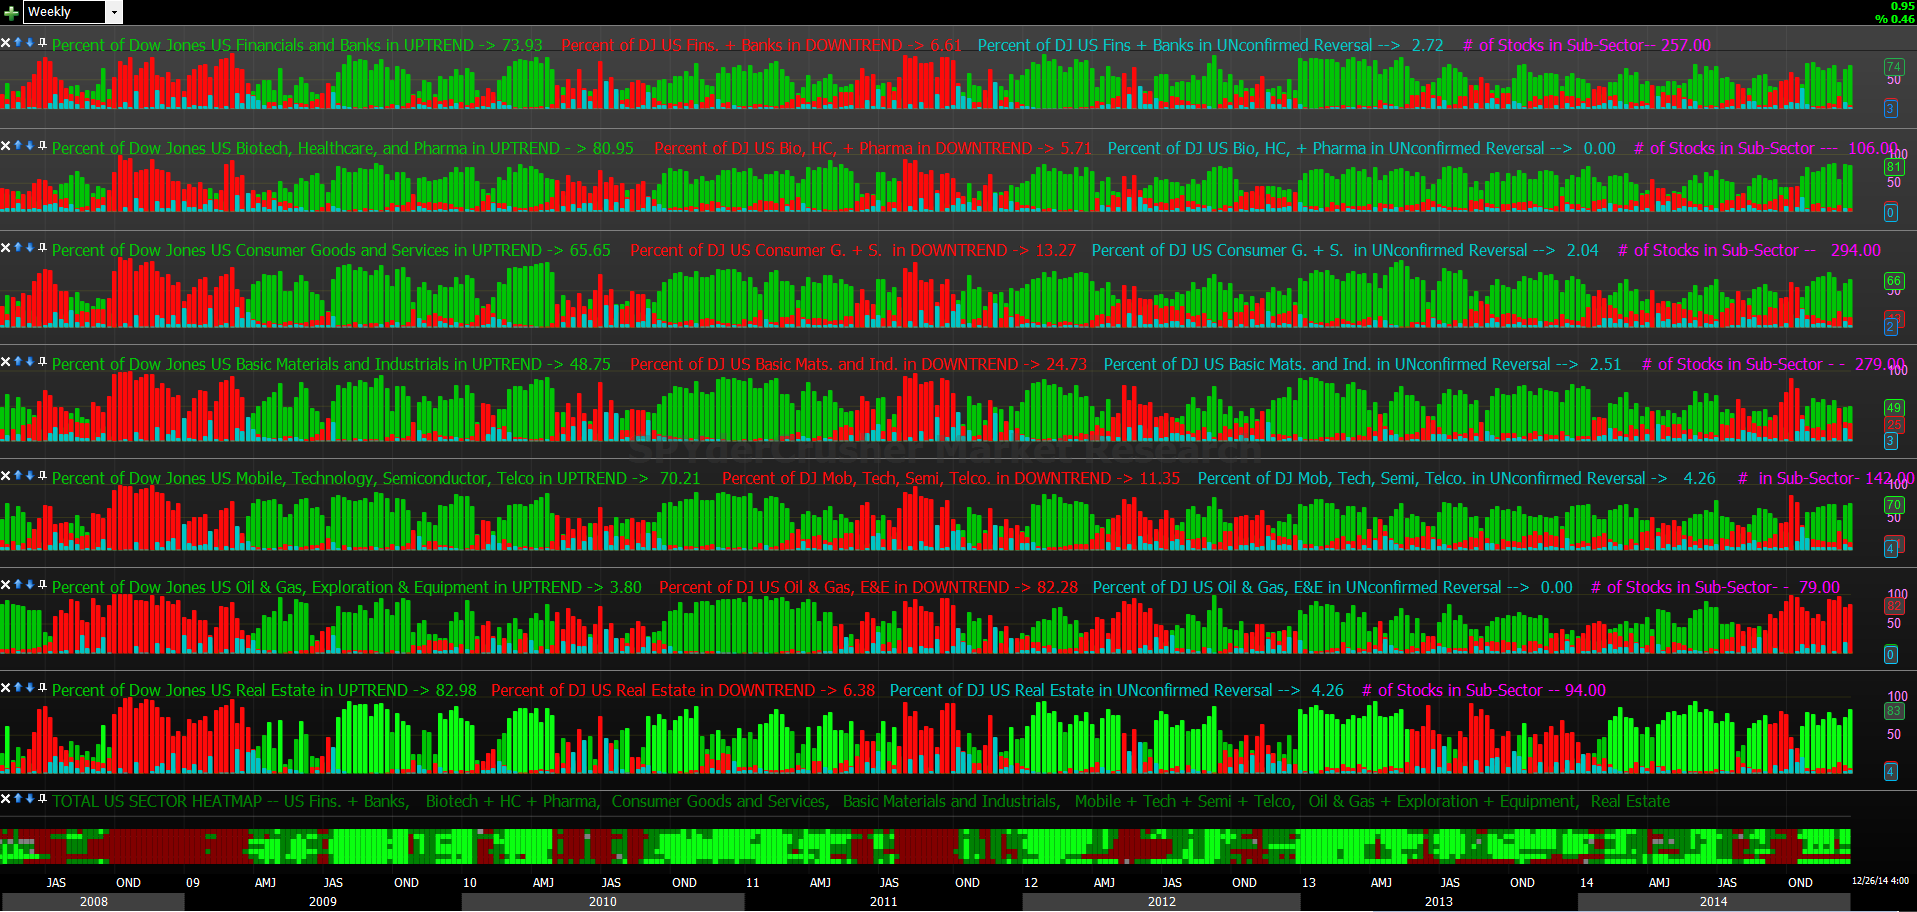
Dow Jones US Sectors Breadth Chart. In this weekly chart, each pane is a sector, and for illustration, can see pane #1 is Financial and Banks. For this, we have stats as to the participation of all the constituents in the group per the GICS classification system. Still looking at Pane #1, Financials and Banks are 74% Bullish, 7% Bearish, and 257 securities are included in the calculation. In other words, a large bullish skew in that group. Looking at each row, you can see how generally all sectors (save for energy) are bullish to a varying degree. This is very positive long term breadth. In the bottom-most pane is a heatmap of all sectors at a glance.
Unlike most breadth models and heatmaps, this one allows you to contextualize the behavior all the way back to 2008 quickly and efficiently. Also, it’s useful for allocation bias – have to like the strength in Biotech/Health/Pharma, Tech, and Real Estate.
———–
Conclusion: Let’s not draw this ridiculously long post out any further. Hopefully I can expand on my views in coming posts. If not, lets all relax with a glass or two of Pappy, and wait with bated breadth for what the future of markets, our lives, our families, and iBC hold next.
– Danny
Comments »