If you have been reading @chessNwine’s blog posts lately you have read about risk currencies and the charts he provides with comments. One pair that has been mentioned is the AUD/JPY or Australian Dollar and Japanese Yen. This involves buying the AUD and selling the JPY. The carry trade involves borrowing the low interest currency and investing in the currency of high interest rates. I am by no means a currency expert and I would encourage the reader to research the carry trade or click the links below for a better explanation. Explaining the carry trade, risks, and how to trade it could be a long blog post and more. All I have is a basic understanding and I do keep watch of the AUD/JPY chart as a measure of risk appetite. This is not the only pair as the carry trade could involve selling any currency of low rates to buy currency of high rates, its just my preferred pair and common among others.
Below are two charts showing the last two years with the AUD/JPY chart on top with a 42 period moving average and the bottom being the SPX. I use this as a measure of risk and when the AUD/JPY is above the 42 SMA, then traders are accepting a higher risk environment and when it is below the 42 SMA, then traders are taking on less risk. With that, it is important to keep your style and timeframe in mind. Would I pay attention to this for daytrades, no I personally wouldn’t as my holding period doesn’t align with this indicator. I keep this as a supporting factor among other risk measures and lets me know that I have a higher probability of being on the right side of the overall trend.
Chart #1 shows from June 2011 to the beginning of 2012. Arrows signify above/below the SMA with SPX Long (L) and Short (S) signals below.
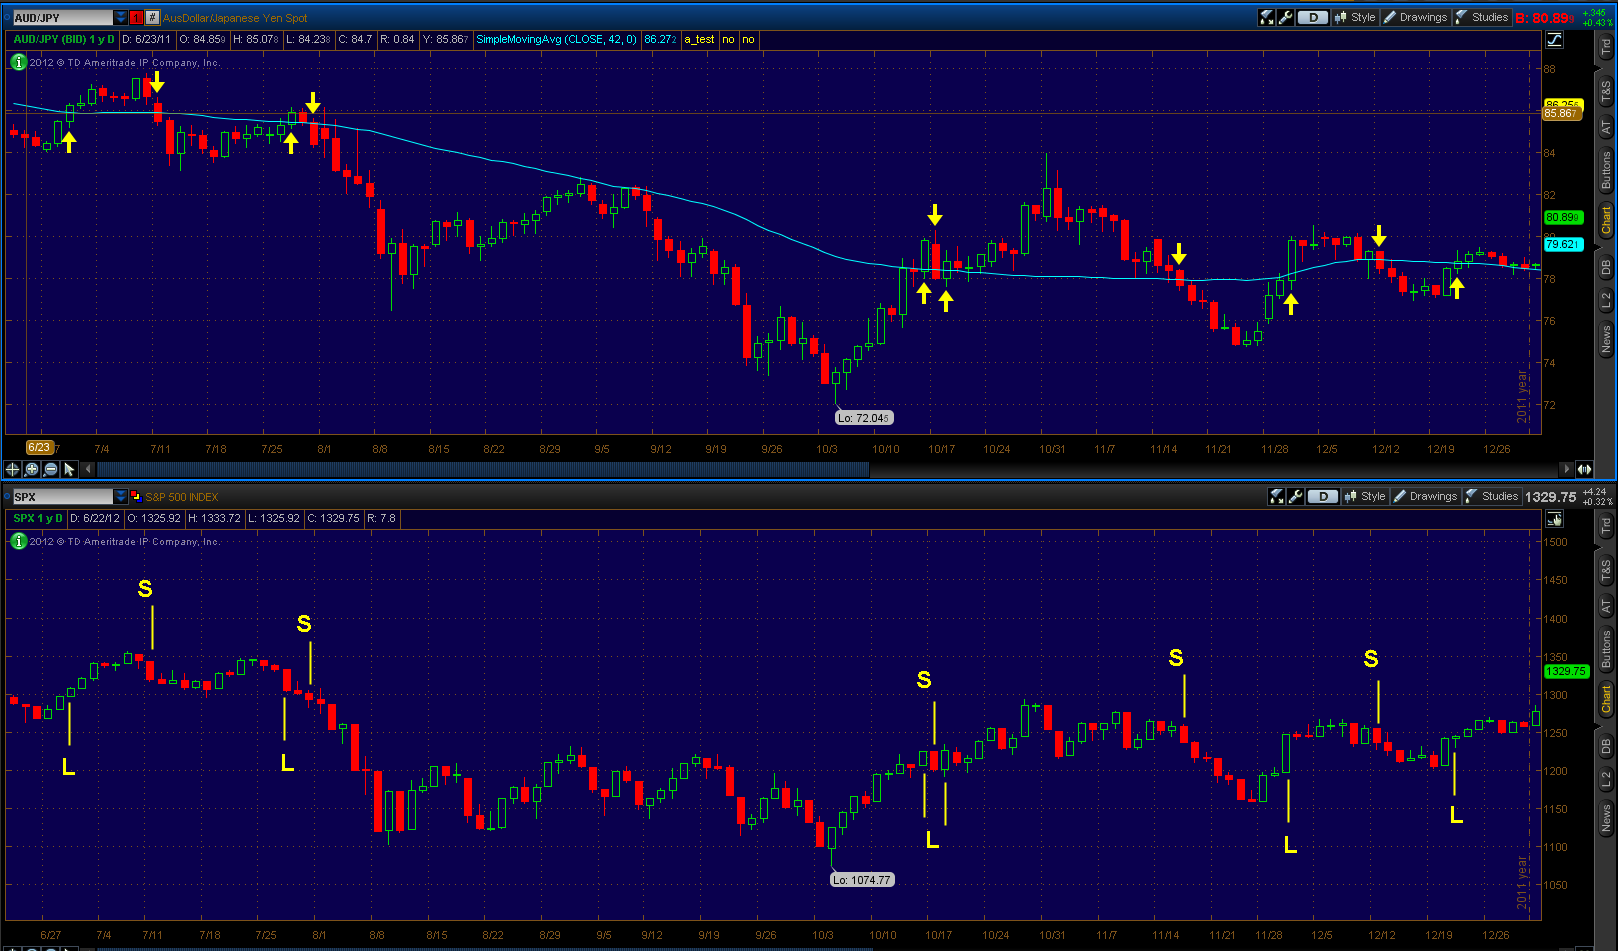
Chart #2 shows from the last “L” signal of 2011 to June 22, 2012.

Its important to remember that this is not a perfect indicator or a buy/sell system. I use it to show me the appetite for risk as the currency market is way bigger than our economy and I think it does a decent job of catching trends.
Also I like to look at the slope of the 42 SMA too. If I get a “L” signal but the 42 SMA is sloping down, I will take this as an alert and wait for the 42 SMA to turn up for a confirmation. This pair is just one thing I watch and anyone can look at it and plug different things in and make it their own.
Links for the month of June to @chessNwine’s blog posts that include information/analysis about the AUD/JPY pair:
Risk Currencies Might Be Sniffing Something Out (June 4)
The Attack of the Short-Killer Hot Tips (June 5)
Risk Rally Climbing Higher (June 10)
Update on Risk Currencies (June 13)
Risk Rally Still Chugging (June 17)
Nodding Along with the Aussie (June 19)
Intraday Look and Analysis: Leave the Punditry to the Fed Watchdogs (June 20)
References explaining the carry trade:
The carry trade explained (video included)
The Forex Carry Trade Explained (video included)
How to trade the carry trade


4 Responses to “A Risk Indicator I Watch”
elizamae
Great post and awesome linkfest.
Thanks for that.
redman59
Thanks for the comment, appreciate it. Was hoping they could provide some direction.
Yogi and Boo Boo
Thank you redman…
redman59
thanks for the comment Yogi