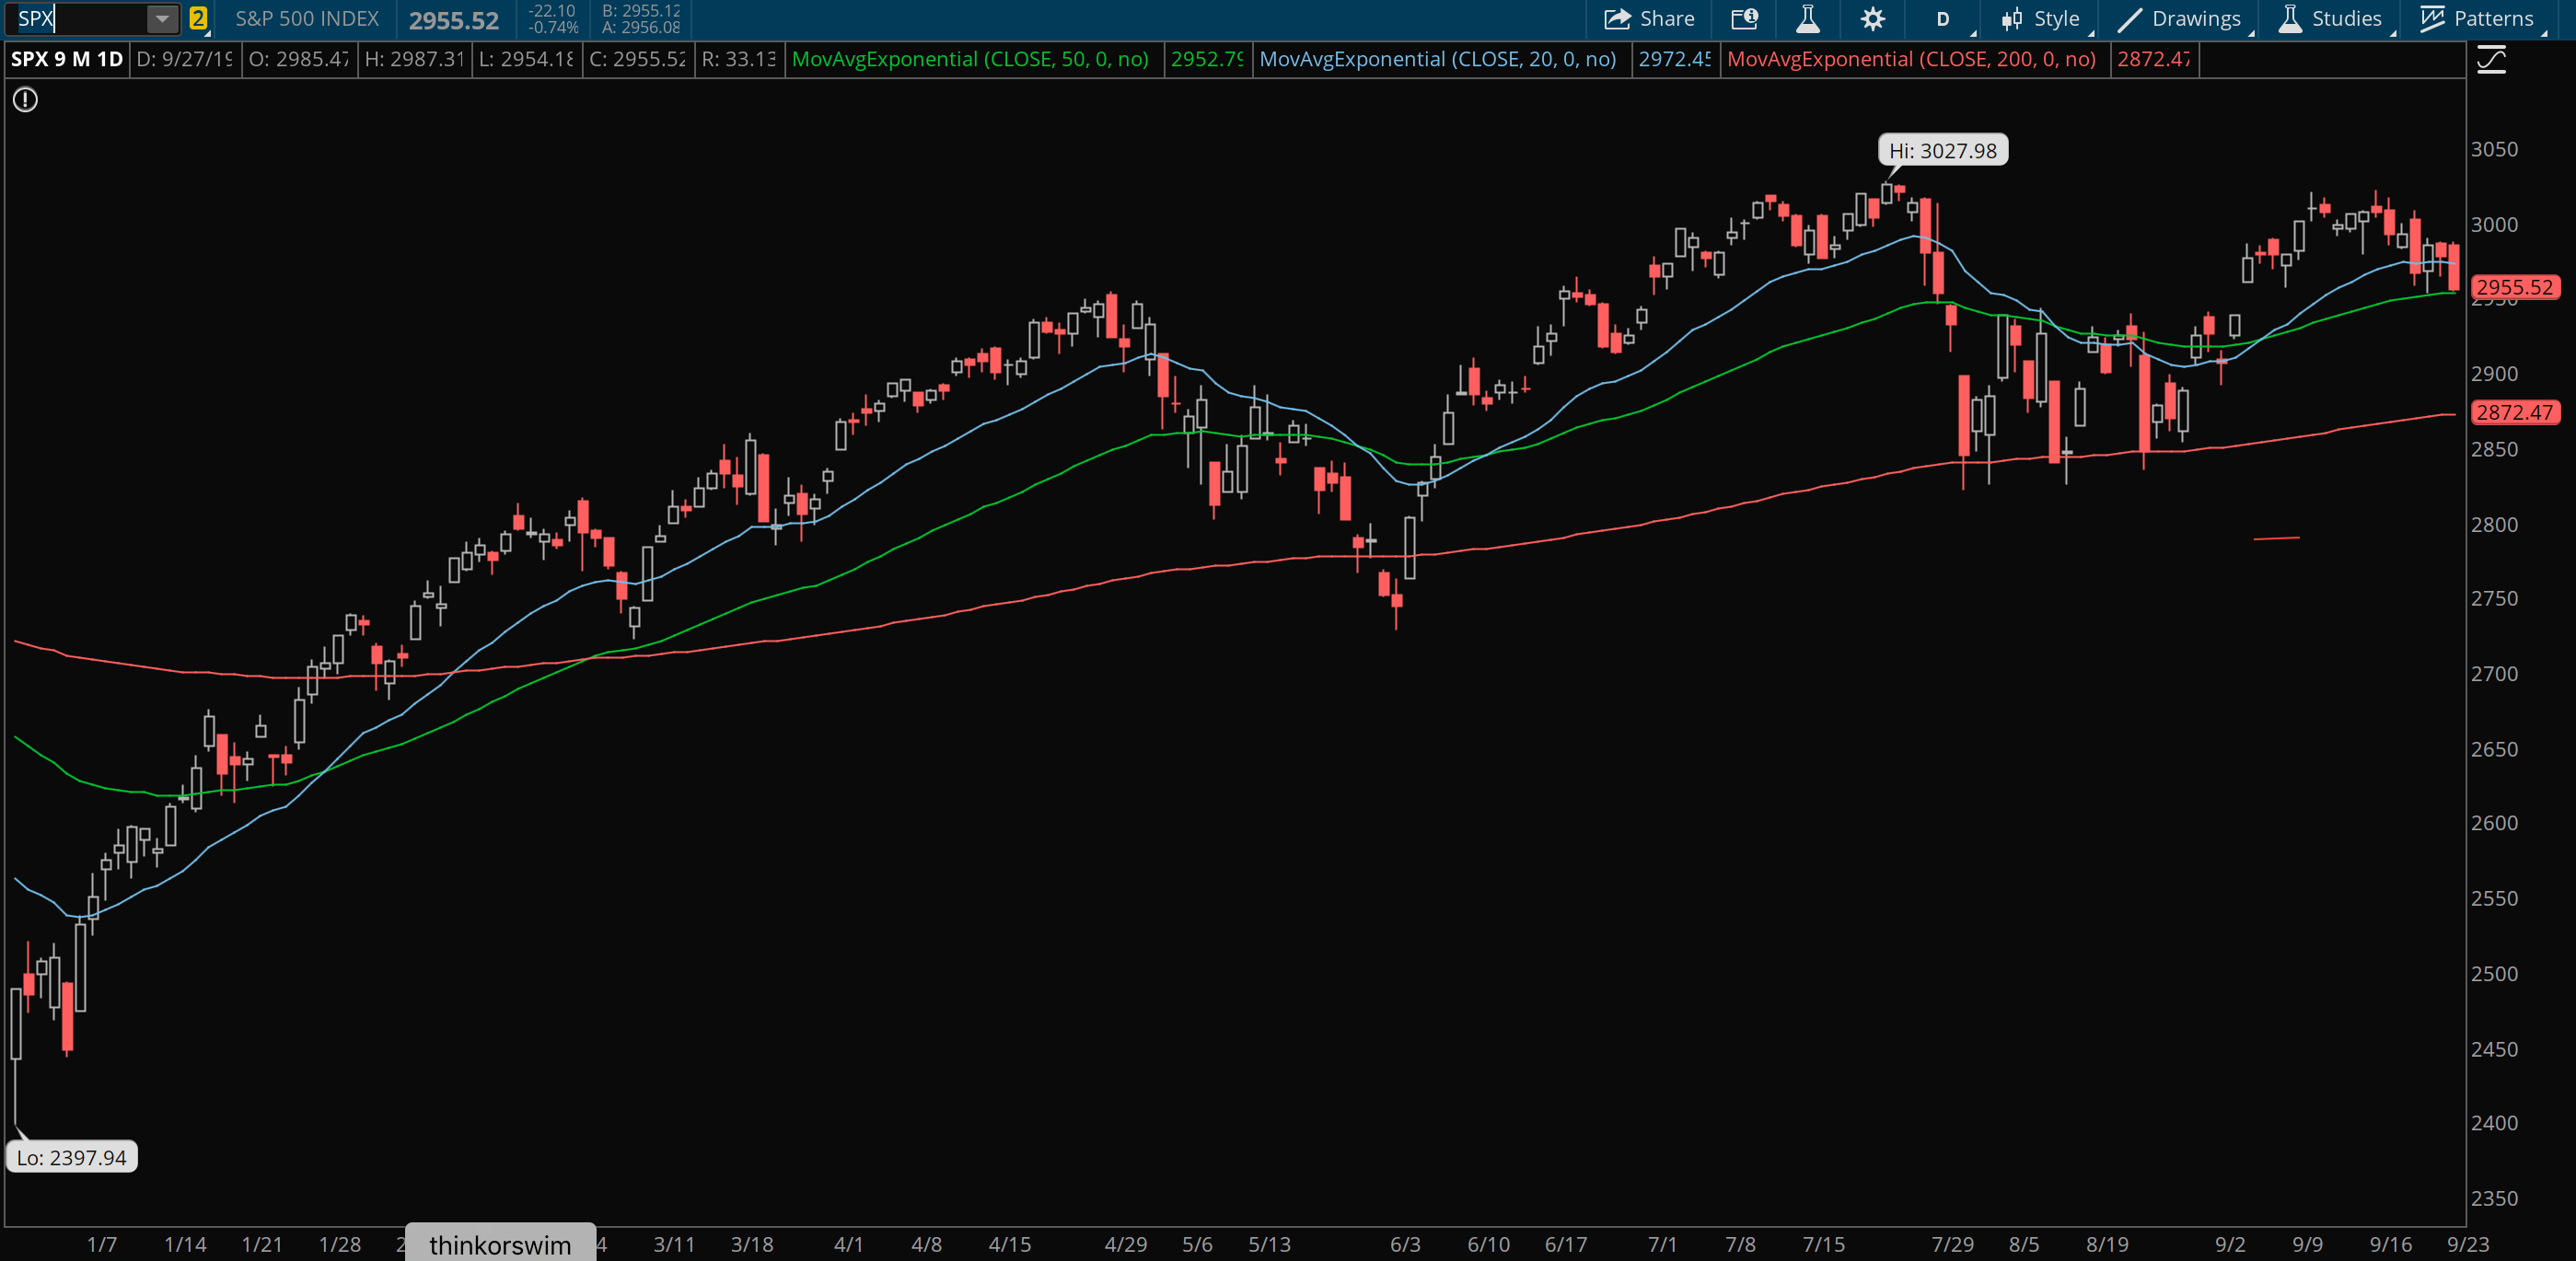
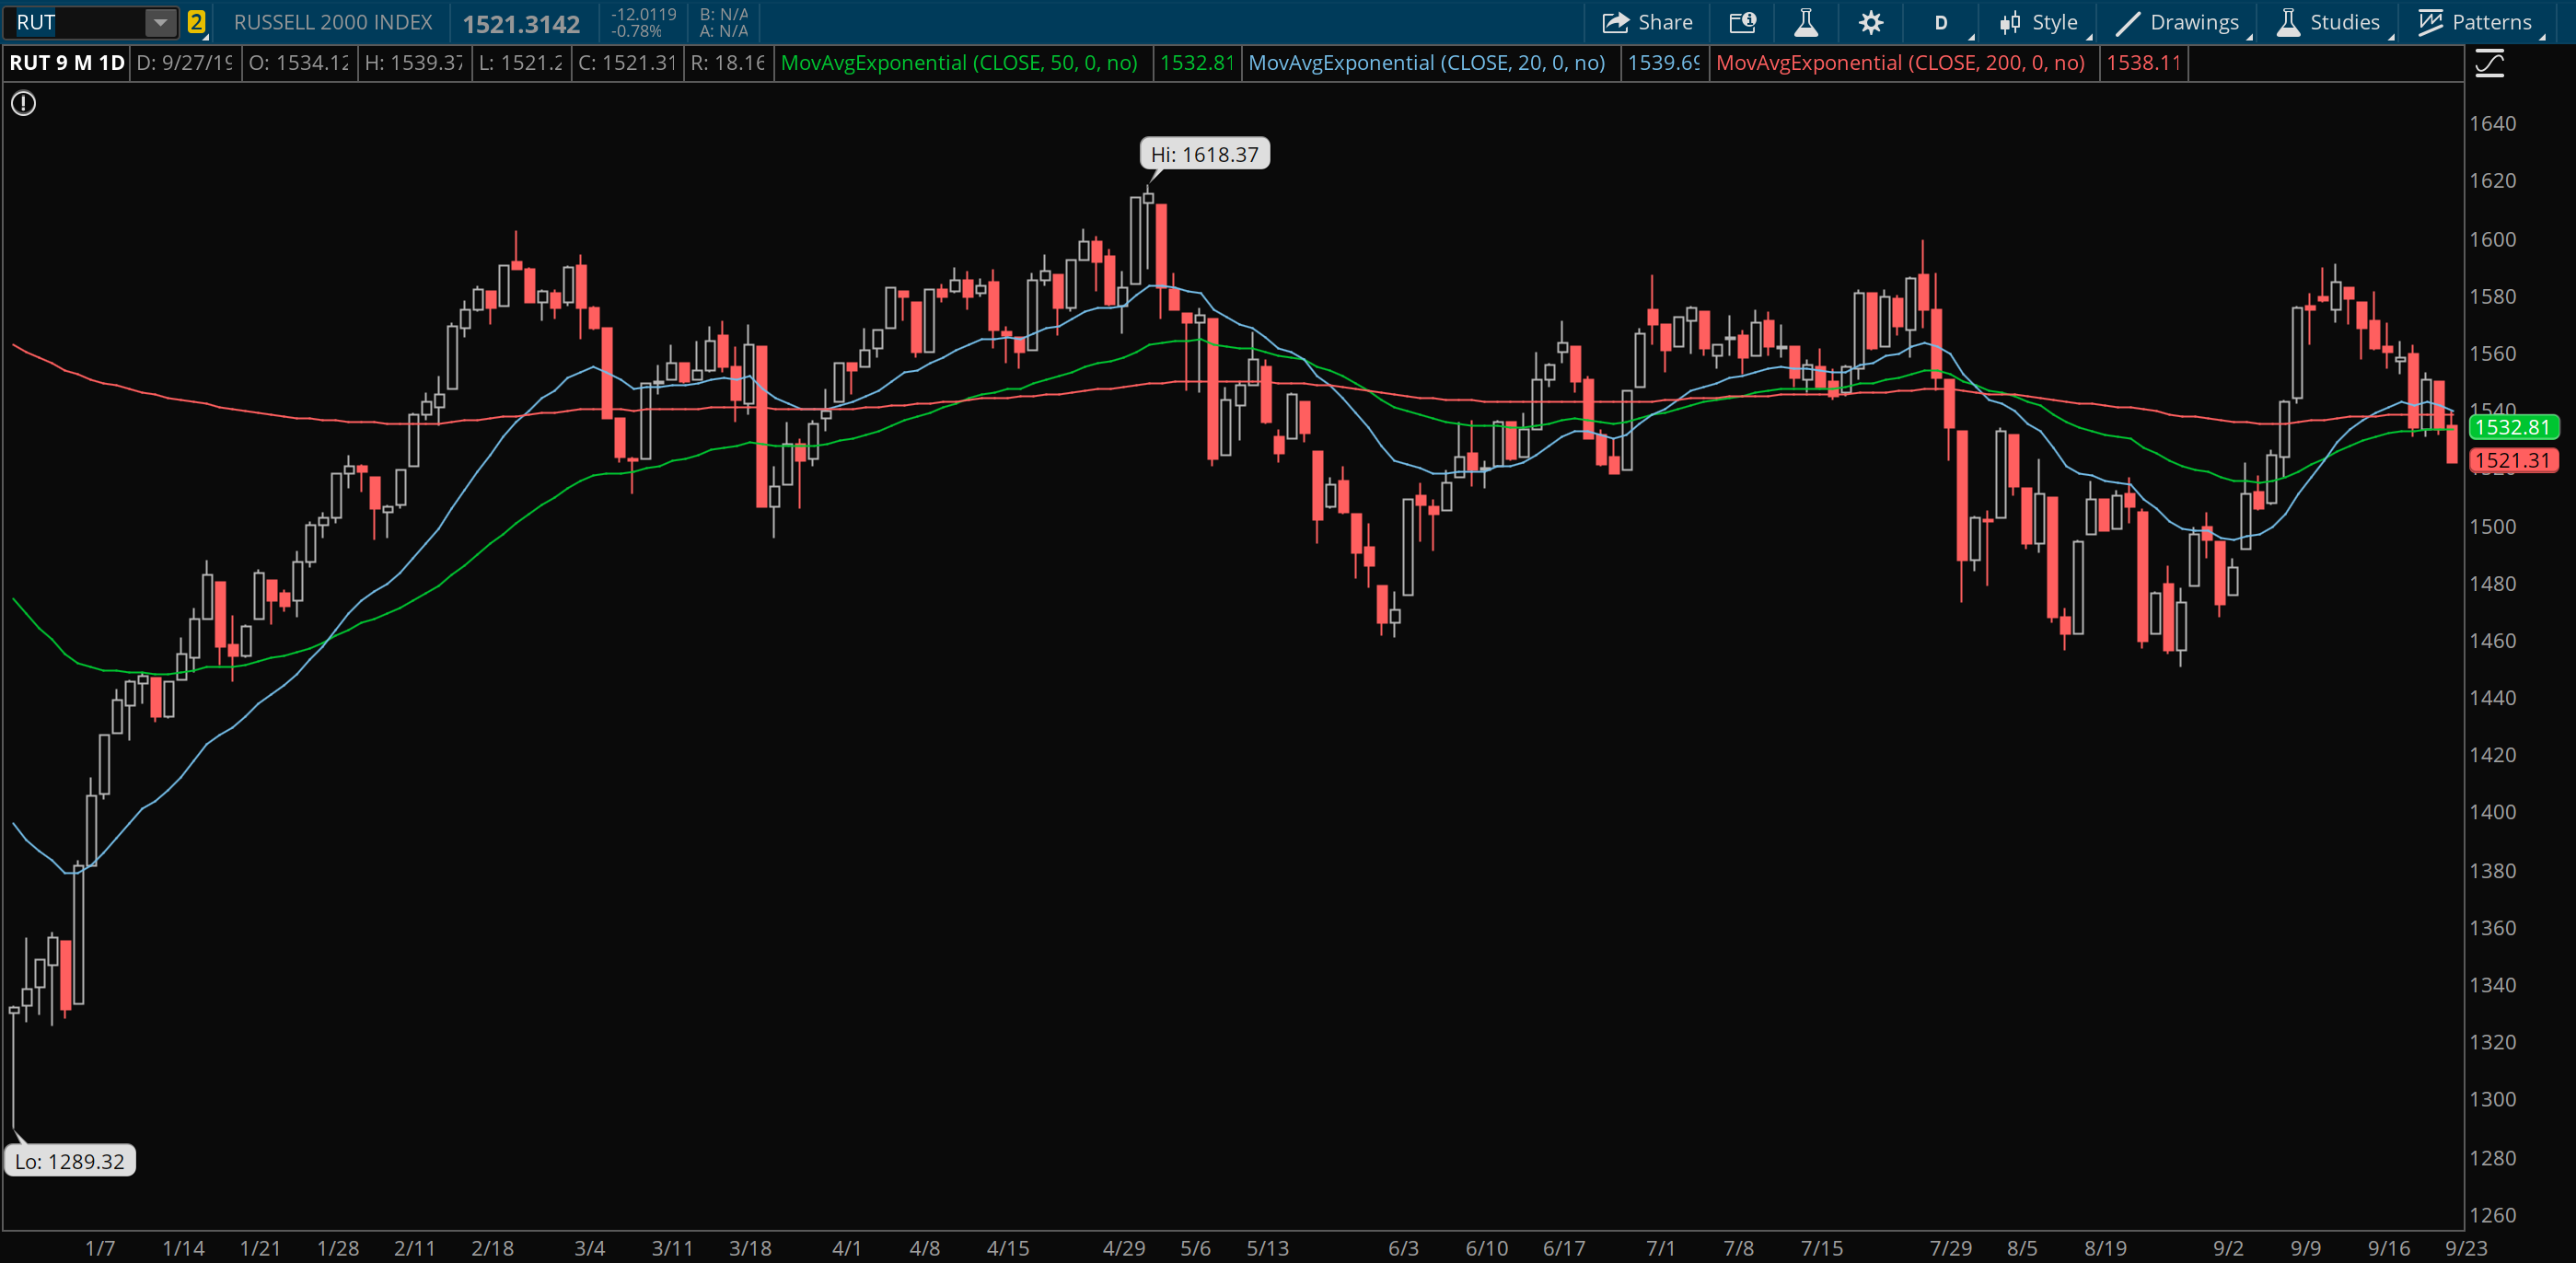
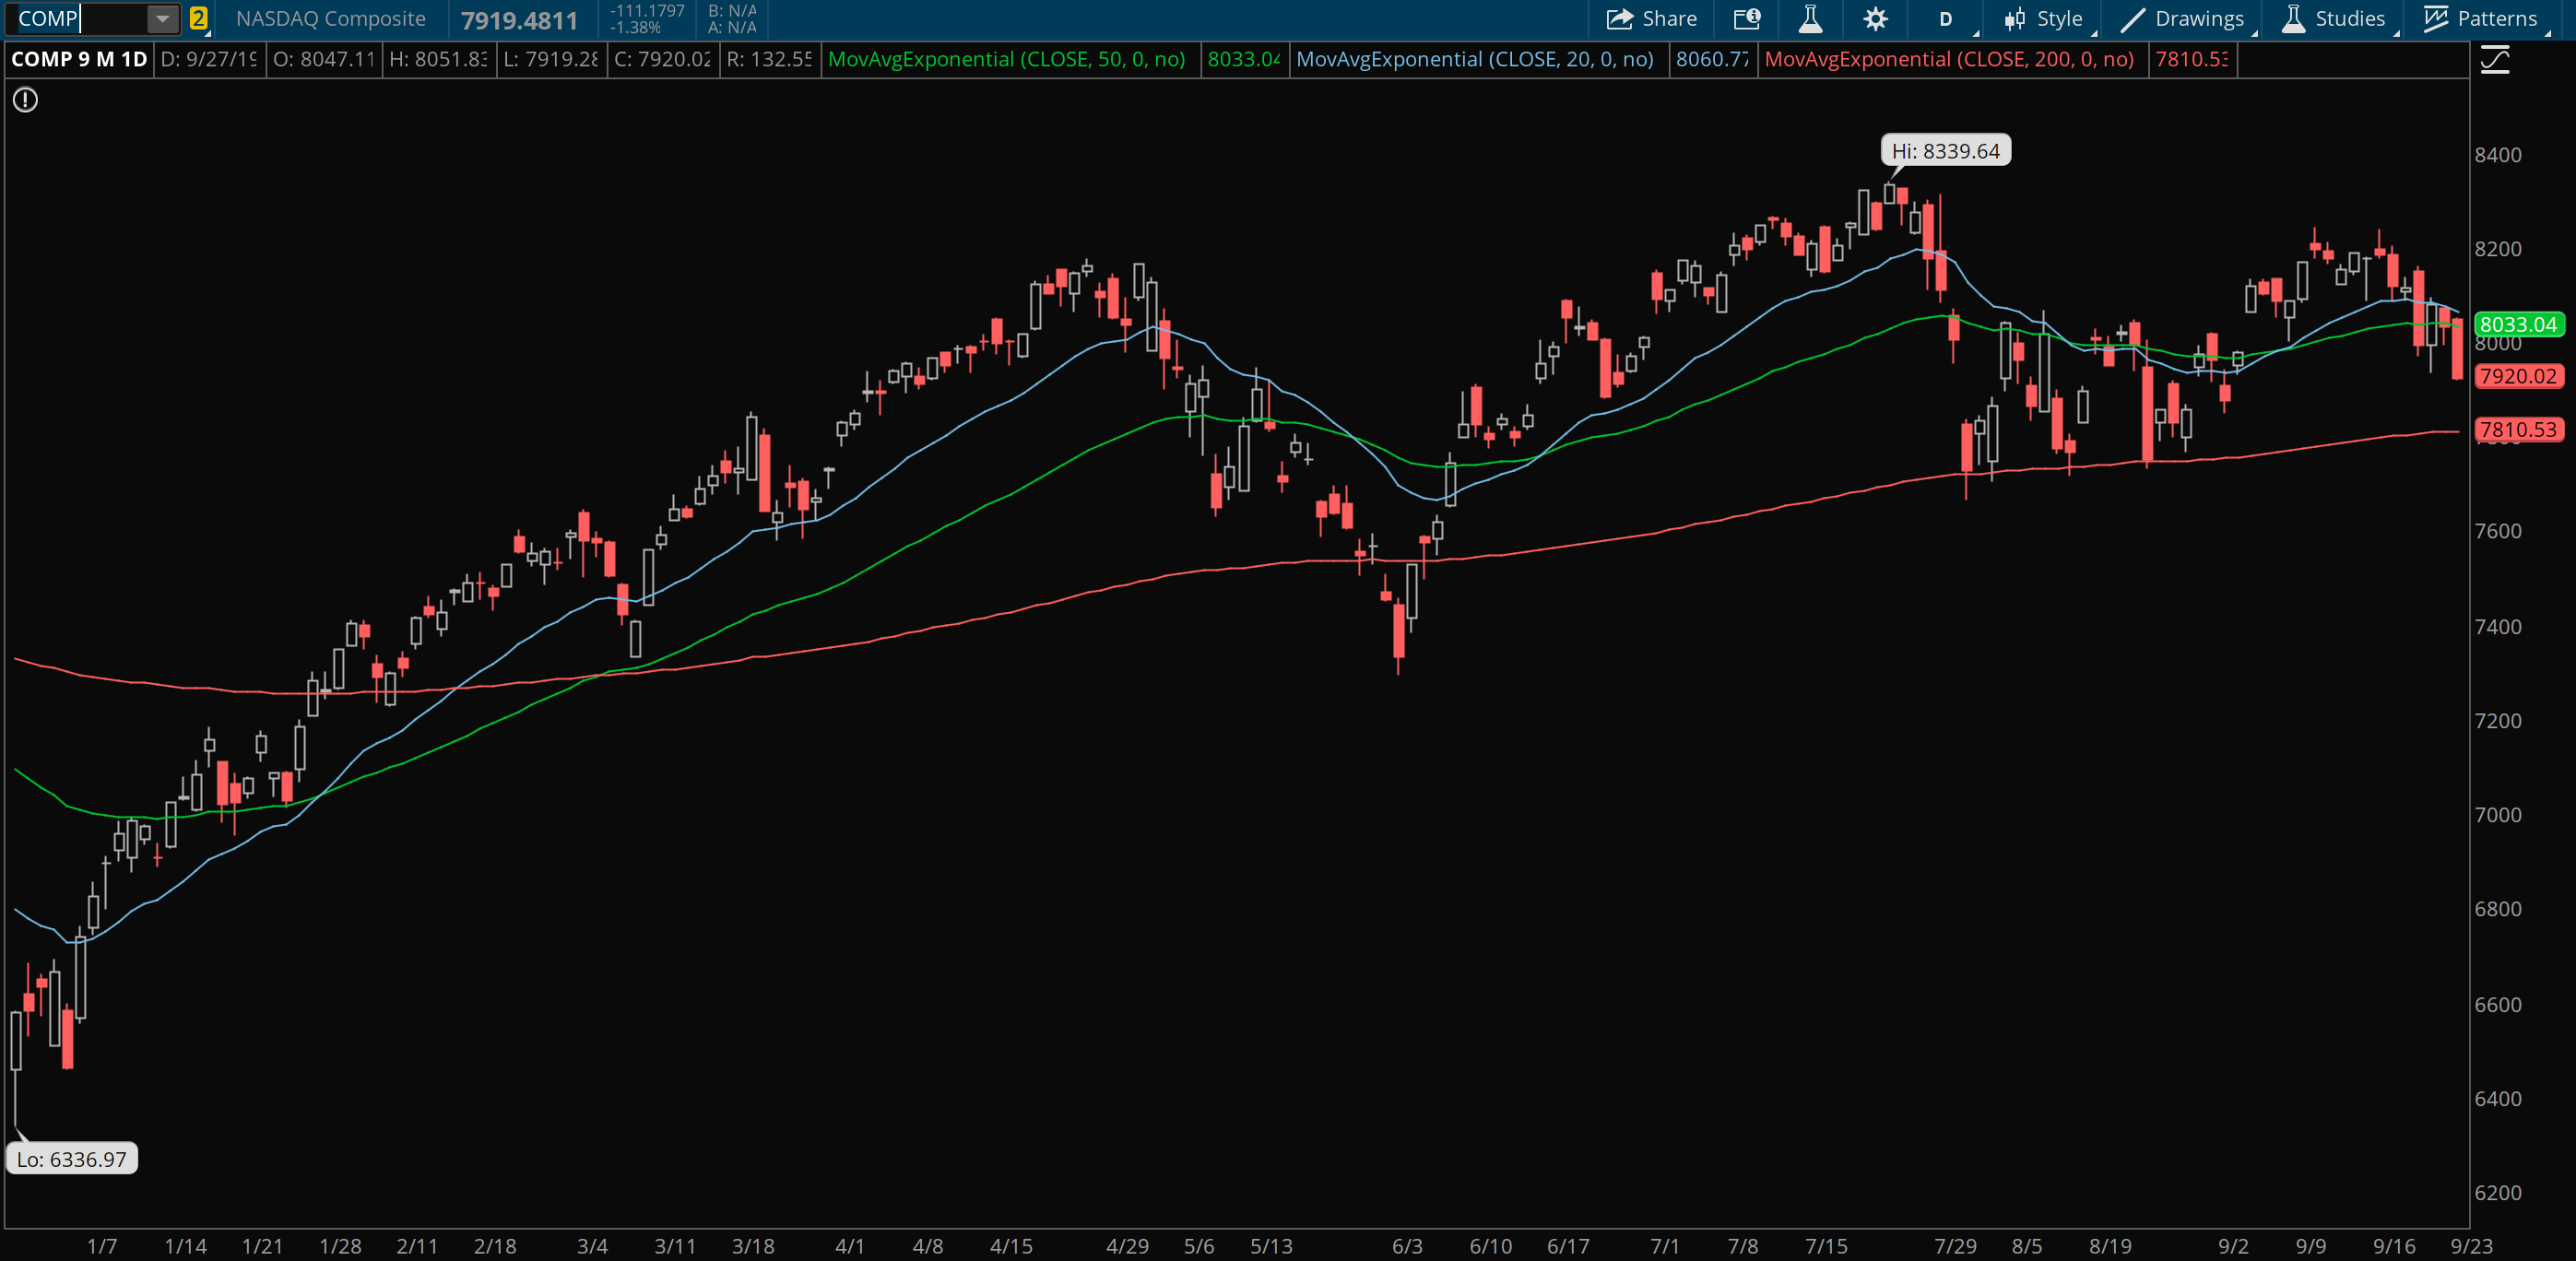
The S&P 500 is trading right at the 50 day moving average, a level where the average investor looks to gauge the current trend. Most sophisticated traders claim that the moving averages are all balderdash, but it is a psychological level worth noting in my experience. The Russell 2000, the small cap index– a measure of risk, lost both the 200 & 50 day moving average today and does not look healthy. The Nasdaq, $COMP, lost the 50 day MA and appears to be gunning for the 200 day moving average. See charts below:
 __
__
 __
__
 __
__
What does this all mean? It could mean nothing. We could get some positive news over the weekend which at these levels could provide a great entry point for stocks. The opposite could be true, and bad news happens, leaving levels & moving averages far far behind. You could say we are at a make or break point for the market here. I sold a bunch of longs earlier in the week and am comfortable sitting on the sidelines until I get a better gauge on further direction.
No need to make stupid bets here, let’s see what Monday brings. Enjoy the weekend all and make sure to join us on the other side of iBankCoin, inside Exodus.
If you enjoy the content at iBankCoin, please follow us on Twitter


The magical chart-crystal ball doen’t work in the oil patch.