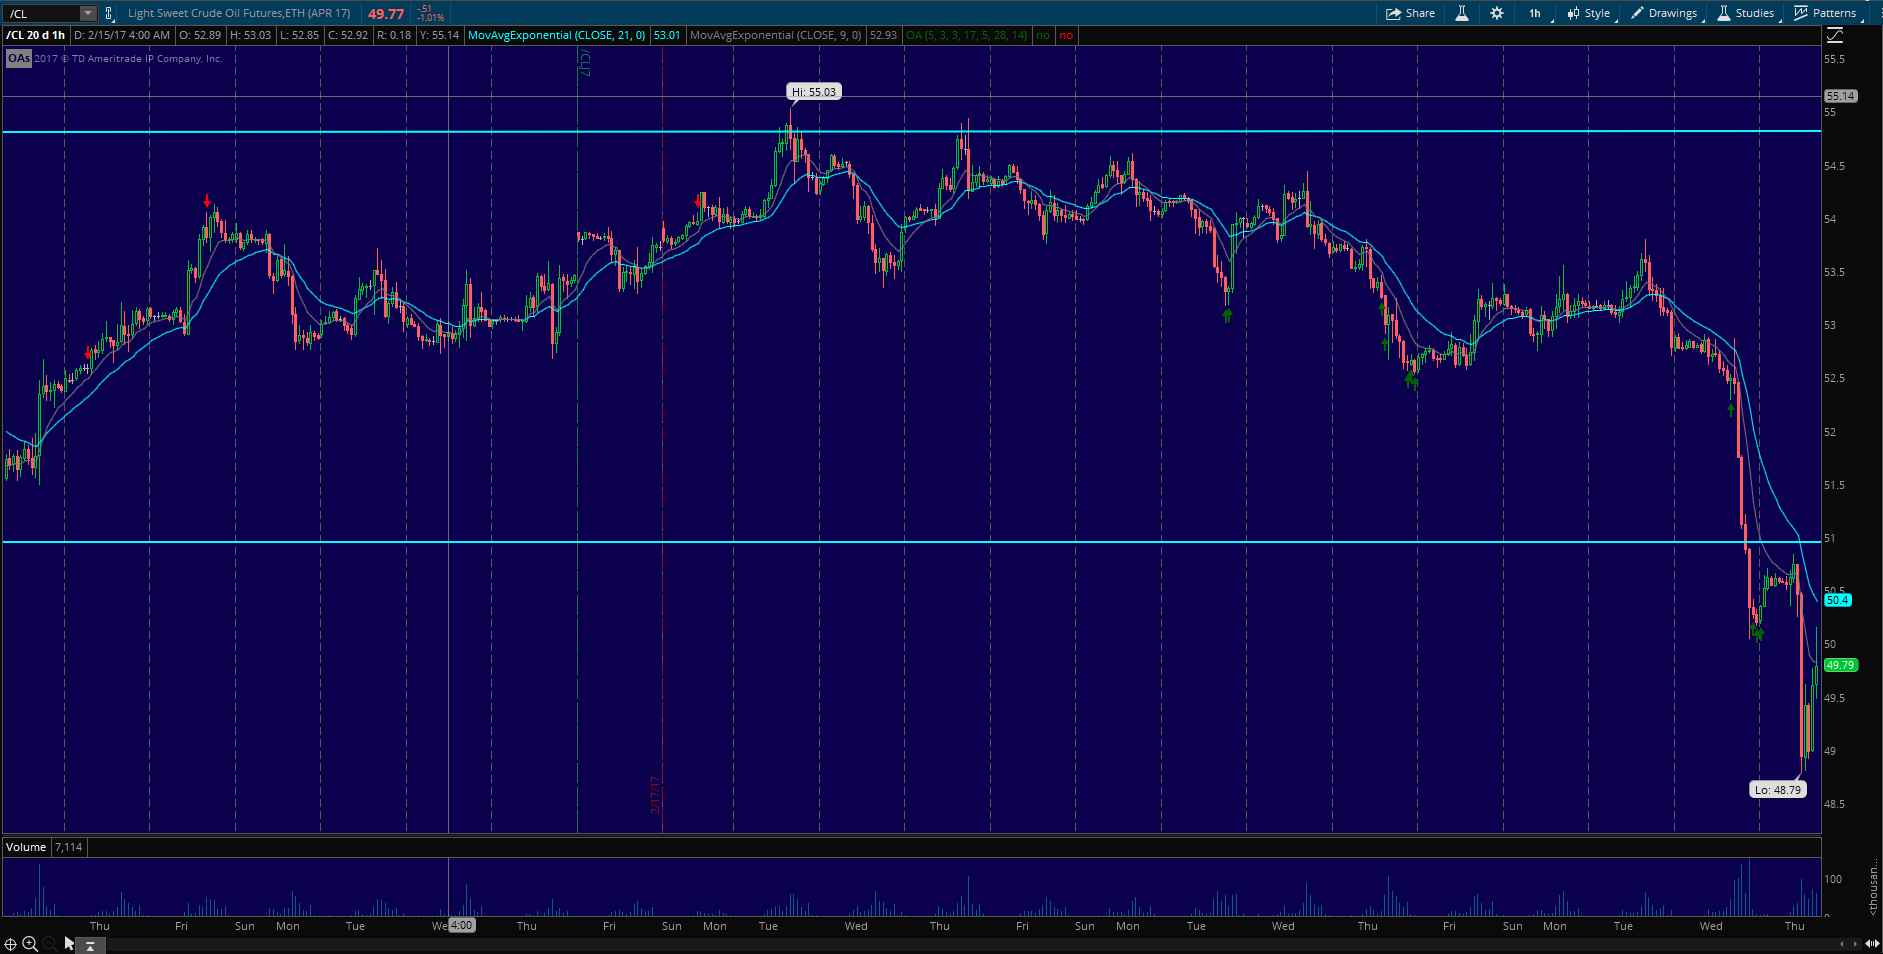
Crude oil is following yesterday’s move lower with some early weakness. Below, is a short term chart showing recent price history with price knifing through the $51 level like butter:
 __
__
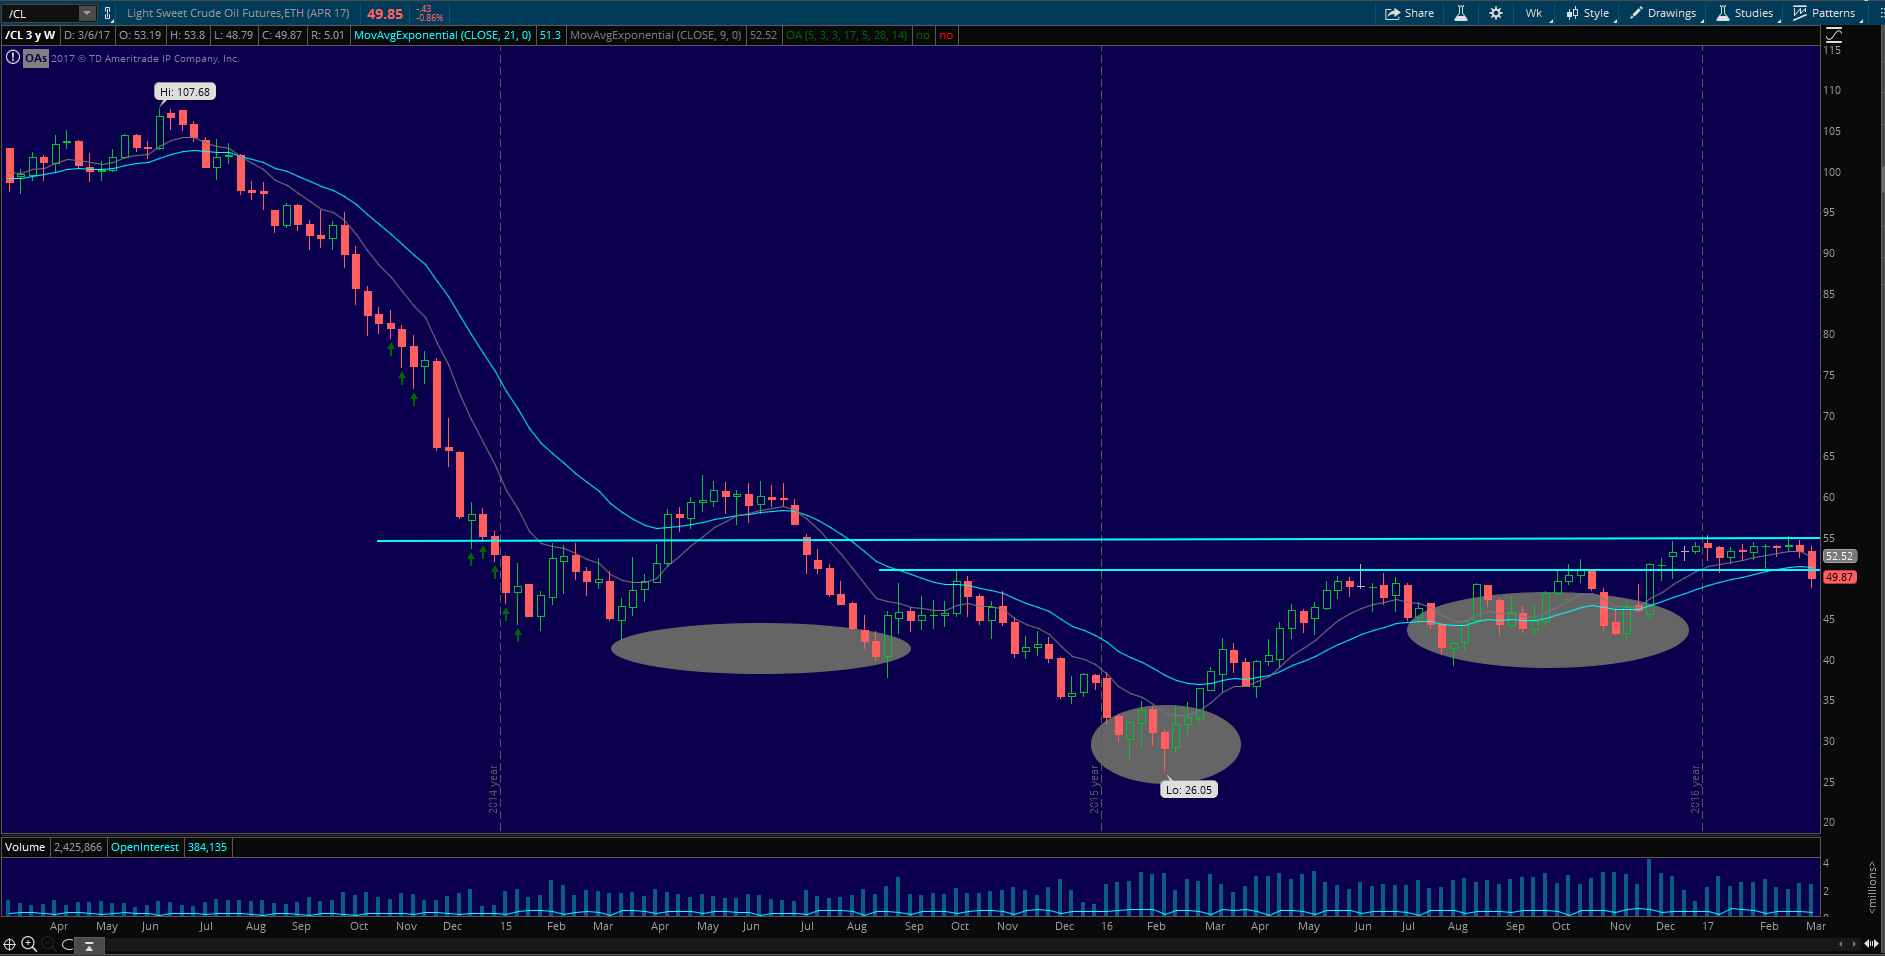
However, once we zoom out to a longer term time frame, the bullish reversal pattern is still intact with price forming the infamous inverse head & shoulders pattern:
 __
__
I’m still a bull on oil and will view dips in oil as a buying opportunity. $51 & $55 are the important levels to watch on the upside. For now, let price find its true value.
Be back later with some screens.
If you enjoy the content at iBankCoin, please follow us on Twitter


don’t know if you follow raul pal, but his latest tweet
“The short term #oil trend is now broken. A break of $45 likely will give the full signal for a break down to the low and massive liquidation”
raoul pal…(sp)
Yep, not in a rush to make any moves. But, will be plotting a few buys soon in a few oil cos.
I did pick up some RIG on the 200 day MA
46.68 is the 200DMA which it bounced off of this morning.
Oil traded at $46.68 this morning?
Cmon out here to Odessa, I’ll show you some frakkin inventory…
I believe you my friend