iBankCoin
Home / Tag Archives: $SPY (page 7)

Tag Archives: $SPY

Some Upside Momentum, But Indecisive

The market drifted lower overnight, not accomplishing much, but setting a higher low: the third in a series of higher lows since the market sold off Sunday night.  The momentum to the upside isn’t nearly as enthusiastic as we’ve seen throughout the year.  Instead it’s a bit more lethargic with price making a higher-high by only two ticks on the last trough-to-peak move.

The moves are also violent and with a smack of indecision, offering large chop often 10 handles wide.

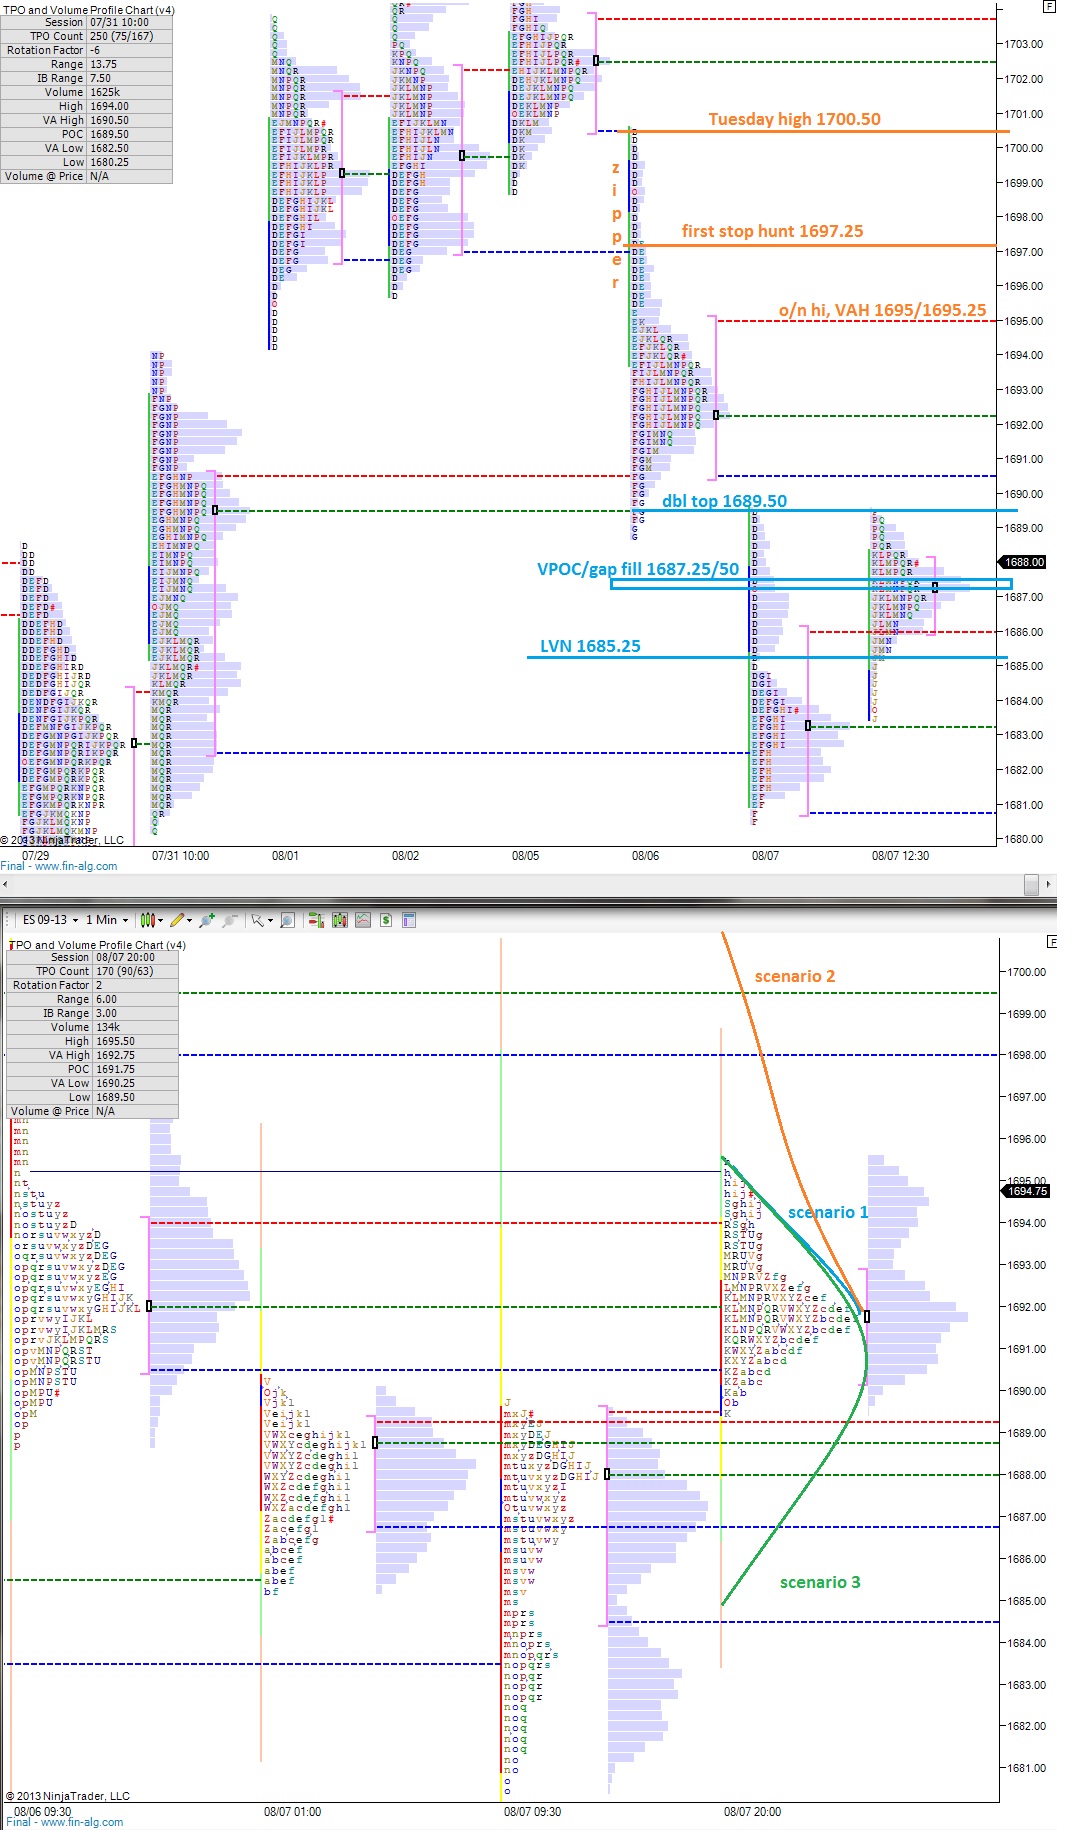
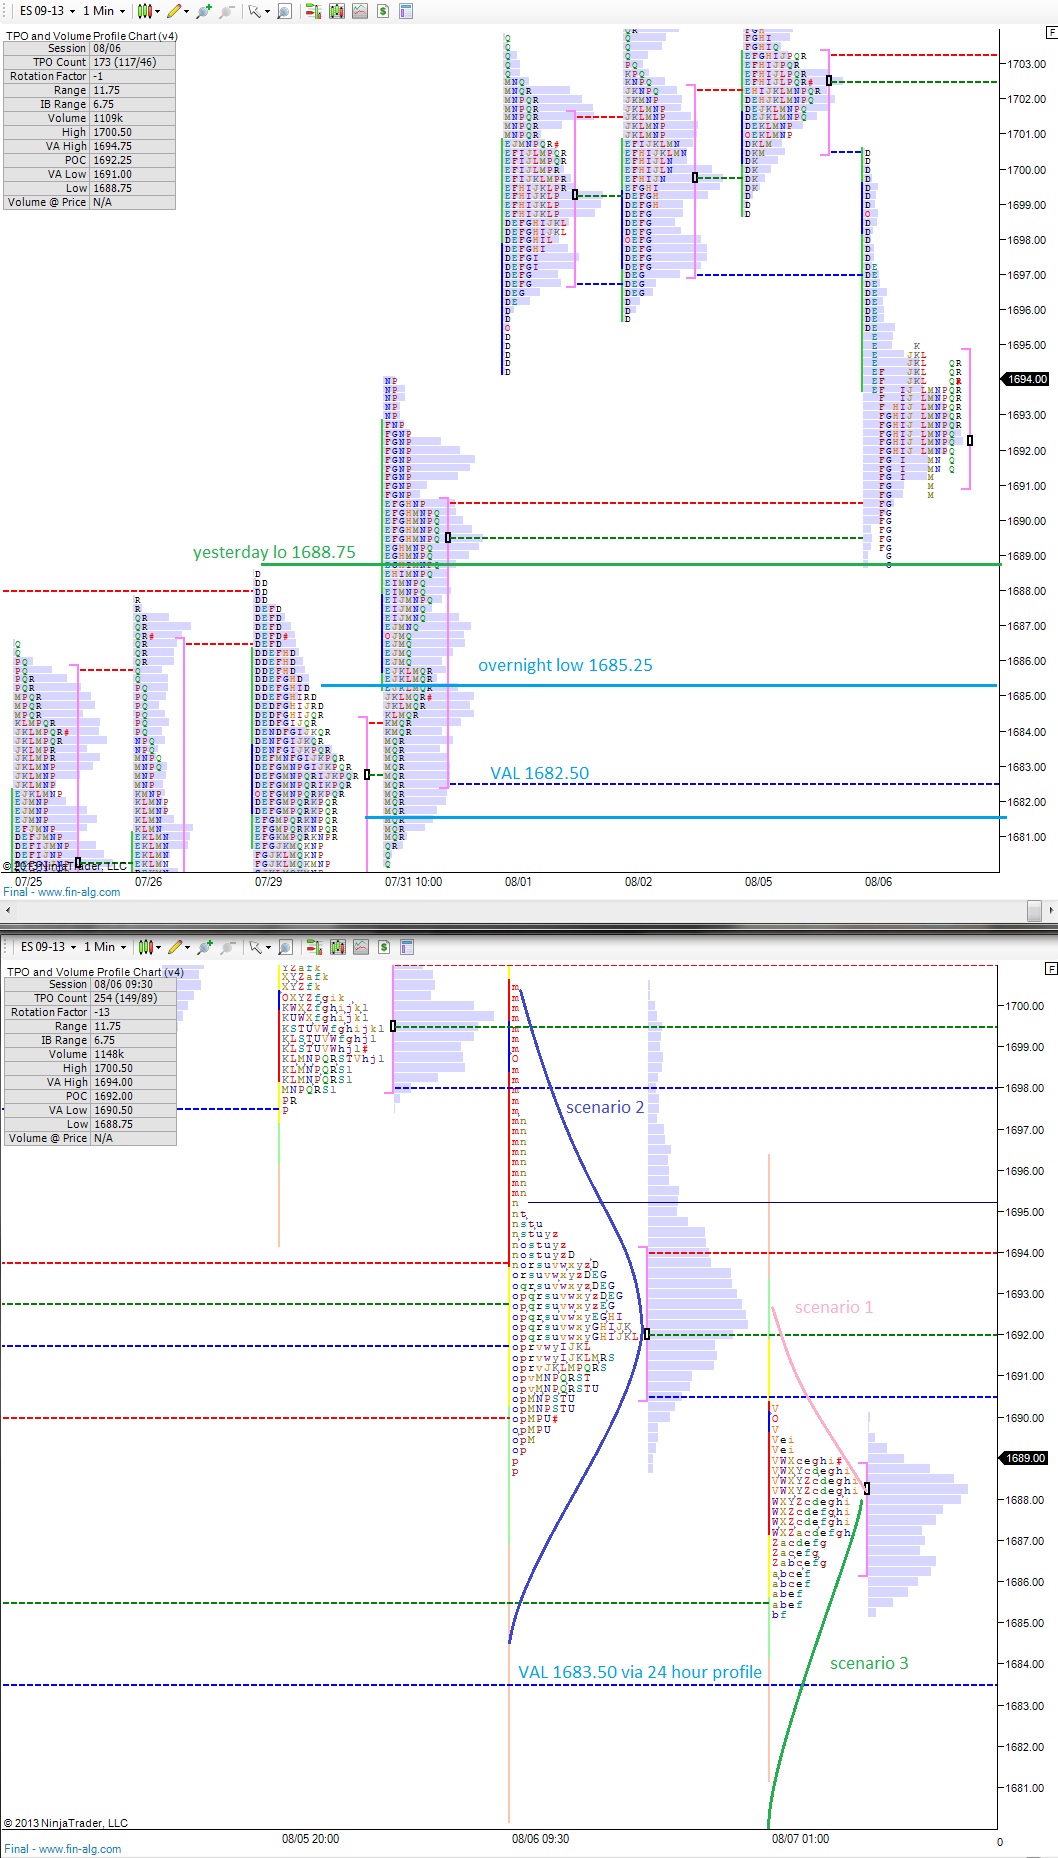
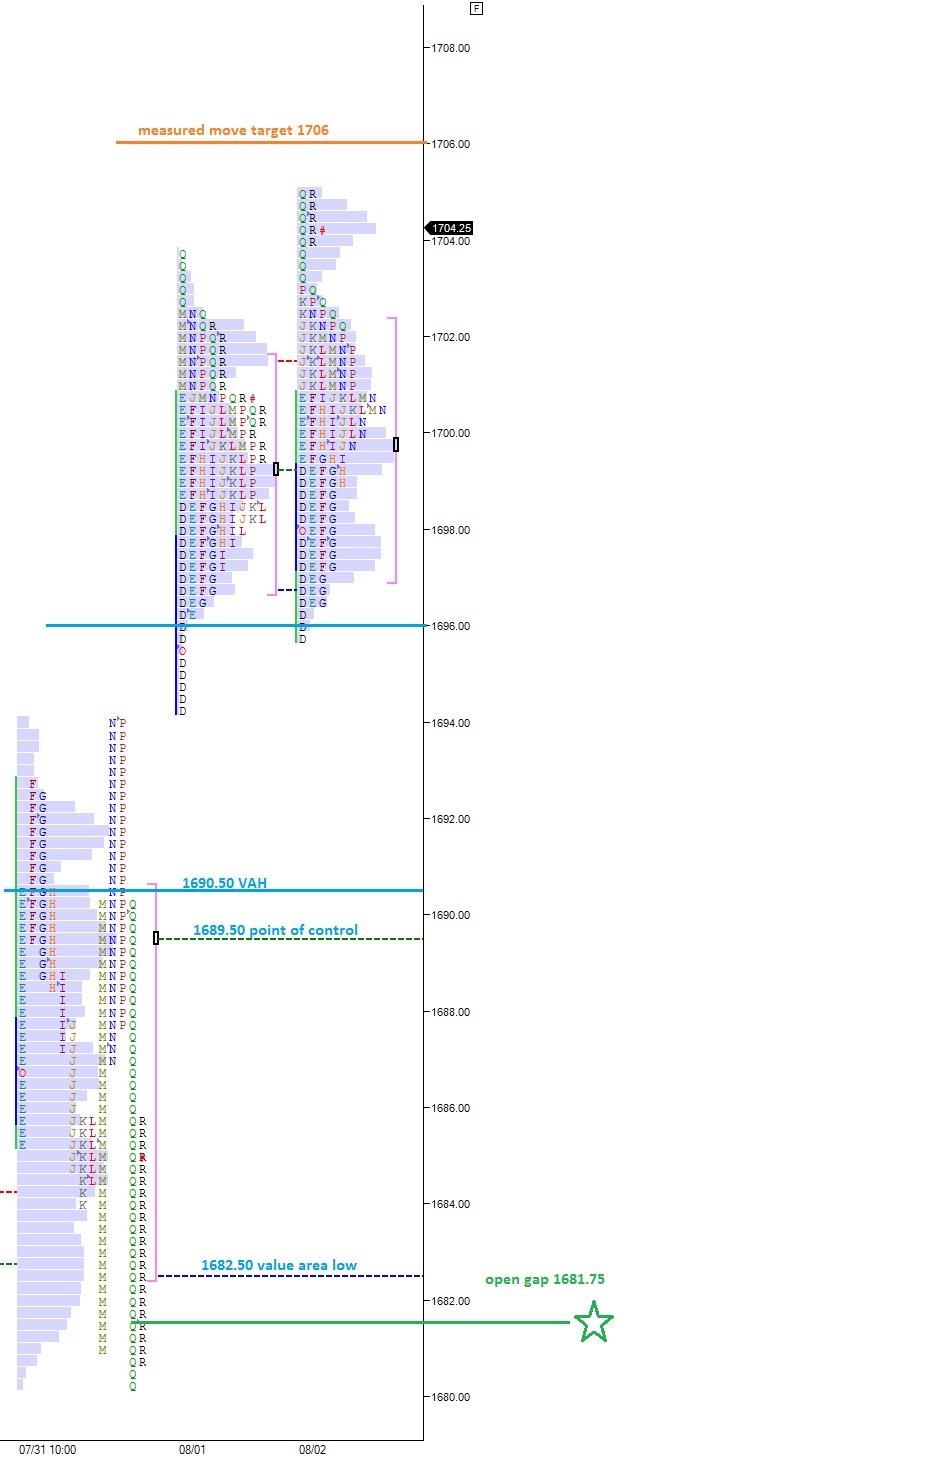
I don’t have much directional conviction currently, but I’ve highlighted some key levels that may give us insight as the day progresses in the following market profile chart.  Sustaining trade over yesterday’s VPOC at 1691.75 would mark good progress for the buyers.  Conversely, taking out yesterday’s value area low at 1684.75 sets us up for scenario 2 on the below 24-hour market profile:
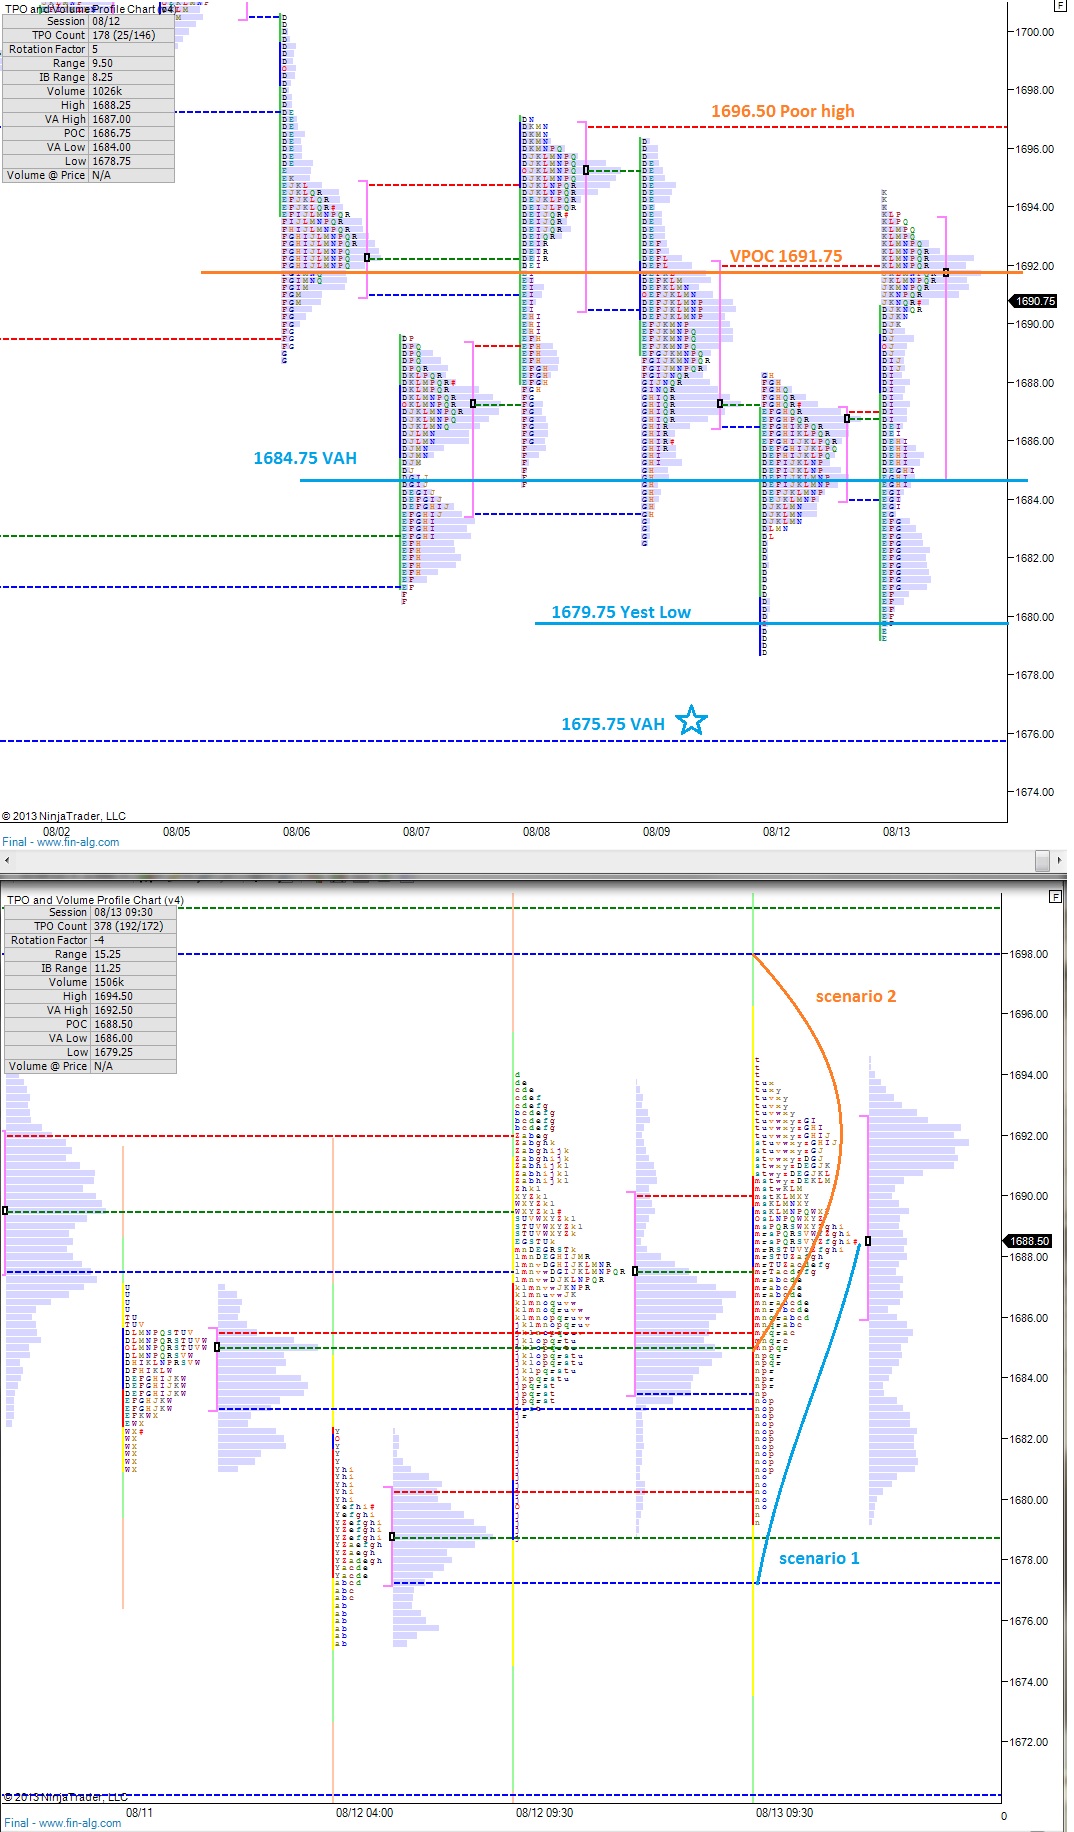
ES_MarketProfile_08142013

Comments »

Digesting The Overnight Strength

There was a sense of pressure building on the offer as we closed out regular trading hours yesterday.   Pair that with the poor high set on the market profile, which built context going into the globex session that we would take out the high.

The market has actually gotten a bit ahead of itself overnight, and it wouldn’t surprise me if we saw a bit of churn this morning while the market decides if it wants to accept the overnight progress. I’ve highlighted a few scenarios about how today may play out, and highlighted levels I perceive to be opportunities on the following market profile charts:

ES_MarketProfile_08132013

Comments »

Monday Weakness and The Opportunity it Presents

The globex session in the /ES has been dominated by the sellers thus far who have pressed us as low as 10 handles off our Friday closing print at 1686.25.  Price seems to have made a run at the first lot of stop orders placed by longs last week, and has since stabilized a bit, although sellers have the momentum currently.  The markets were weak during the Asian session, but another burst lower occurred around 4am EST, around the open of the European markets.

I’ve highlighted a few scenarios for today’s action and highlighted the price levels I perceive as opportunities on the following market profile charts:

ES_MarketProfile_08122013

Comments »

They Have Been Accumulating This Tape for Weeks

Cumulative delta is often mentioned when discussing the trading of futures likely because the information is more available in the futures than it is on stocks.  For any given timeframe on a chart (ie 2500 contract, 3 tick, 5 minute) the cumulative delta for each bar is calculated as follows:

Trades executed at offer – trade executed at bid = cumulative delta

Thus a positive delta means more trades are being executed at the offering price, where a negative reading would mean the opposite.

The data lets us peer into the order flow and see which party is more active or aggressive when entering (or covering) their trades—perhaps using market orders or “hitting the bid” when selling or “taking the offer” when buying.

Zooming way back on the cumulative delta and applying a moving average filter to it, we can see that the /ES_F (the future contract traded on the S&P 500) has been steady accumulated since around 8:30am on July 25th:

cumdelta

The ramp in cumulative delta started at about 1670. Price action since 1670 has been working through an anxious return of confidence phase where we wall of worry higher before getting an actual move.  It’s another reason why I’ve been buying dips all week.   Seeing that level taken out would put two weeks’ worth of accumulation under water.  Bulls don’t want to see that.

That’s my big idea for the weekend.  I’d love to hear your take on it.  Have a good one,

Comments »

Friday Opportunities

The market caught a downdraft overnight that both my algorithms and I were modestly surprised to see.  We’re still riding through choppy indecisive waters, but the sellers have the early edge.

We’re catching a bit of a rally off the globex low of 1686.25 and it will be important to see how the market treats 1690.50 early on.  This level represents the value area low of yesterday’s session and if sellers are able to reject price away from the above value zone, the market could work to discover value lower.

If you look below at the orange scenario on the 24 hour profile, it would also come as no surprise to see the market work back through this large value zone and take out the double top at 1697.

I’ve presented these possible scenarios and relevant price opportunities on the following market profile charts:

ES_MarketProfile_08092013

Comments »

High Opportunity Session in the $ES_F

I only took one trade today on the /ES as I had more important matters to attend to, but I must say this was one of the most high opportunity trading sessions I’ve ever seen.  The market took on a lovely rhythm and formed a near-perfect sine wave across time and price.

We opened right below key resistance at 1697.25, price stalled out a tick below at 1697 soon after the open as sellers aggressively reacted by rejected the perceived premium priced into the market overnight.  After reverting to the mean, the momentum of the sellers was enough to press us deep into yesterday’s session where we saw an aggressive entrance by the buyers only ticks above the low volume node highlighted as support in our morning report.

At these lows, the volume delta gave us a wonderful shade of red indicating heavy volume being done on the bid by either panicked longs or very aggressive short sellers.  Their combined activity, I believe, and the quick reversal put many participants in the hole. Then heavy volume rolled in, but price was stabilized and the traders down in the hole acted like combustion inside a rifle barrel.  Their rush of trades propelled the market at a high velocity.  Five handles of progress was made in an hour’s time and then seven more taking us right back where we started.

May there be many more days like this, in a time where I’ve committed my full attention

Check out the morning report where these levels were highlighted as opportunities

http://www.youtube.com/watch?v=hVFgkirUakM

Comments »

Mapping Out Potential Paths of The Market

The market pressed higher yesterday evening during the Asian session and spend most of the early AM hours consolidating the move before going on another rally as we wake up in the USA.

I was watching the how the market formed a double top at 1689.50 yesterday and made note of the level as vulnerable.  Sure enough we’ve traded through it and should we trade back down to the level I’ll be looking for signs of buy flow.

If we see price holding above 1695, it may not take much effort to lift us back to Tuesday’s high at 1700.50.  Low volume profile tails, in this case a selling tail, tend to get back filled.

I’ve highlighted a few scenarios on the 24 hour chart, and marked up important levels on the RTH profiles:


ES_MarketProfile_08082013

Comments »

More Selling Overnight: Will it Stick?

We’re seeing some follow through in the overnight hours of Tuesday’s weak trade.  The sell orders began rolling in again during the Asian session and stabilized into a chop along the lows during the European session.

Yesterday’s cash session (RTH) shows characteristics of long liquidation, or risk off, with a long selling tail followed by the market balancing out.  The auction that took place was healthy, albeit downward, putting in a good looking low at 1688.75.  This level will be in play early on.

At risk to the buyers is a rotation down through the large balance area we built prior to launching to new highs.  There’s potential downside support at 1683.50 then 1682.50.

I’ve highlighted some upside observations of resistance in the following market profile charts:

ES_MarketProfile_08072013


Comments »

Tuesday Morning Sentiment Analysis

A little bit of softness in the overnight session as we continue to hover along at the all-time highs in the stock market. Overall however, we’re consolidating after more impressive progress higher by the bulls.  If we are indeed to see the market roll over and price correct lower, there are a several levels of support the sellers need to reclaim.

One piece of context to keep in mind early on is the gap above created by the overnight weakness.  I’ll certainly be on watch for buyers to trade us back up to 1702.75 early on considering its close proximity to our current trade price.

On the downside, I’ll be looking for signs of buyers at 1693.50, Thursday’s low, and also our current August low.  Actually, the August low is 1694, but my profiles tell me to watch two ticks lower.  I know it’s a bit granular but it matters.

Any sustained trade below 1693 could result in a larger rotation lower, taking us down to 1690.50 then 1689.50.  Failure at these levels puts us back inside the large value distribution we built prior to making fresh highs.

To the upside, I’m still very interested in 1706.  We’re starting to show signs of buyer exhaustion, and that levels represents the exhaustion point according to my data.  Should this be proven untrue by strong order flow, I’ll be impressed.

I’ve highlighted a few scenarios I could see playing out today and important price levels on the following market profile charts:

ES_MarketProfile_08062013

Comments »

Keeping Our Head Clear at the High Altitude

The overnight session was quiet and balanced, with a slight upward bias after gapping lower a bit.  As a result, we have a profile which suggests we may see a rotation lower early on.  The action overnight was very slow however, and didn’t produce much by the way of an auction.  Therefore, both the poor high (double TPO) and the low are susceptible to breakage.

I’ve drawn out three scenarios on the 24-hour profile chart (first chart below) none of which would surprise me much.

There’s still a gap present in the regular trading hour (RTH) profiles dating back to month-end.  Therefore, although it would seem abnormally weak and corrective for price to trade back down to 1681.75, it should still be in kept in the realm of possibility.  However, my view is that demand for equities is high, especially for the month of August (historically a weak month) and everyone is looking to buy this gap, so we may not see it.

Upside target is 1706 (measured move target).

Other levels which may see demand flow in are 1696, 1690.50, 1689.50, and 1682.50.  I’ve highlighted these levels of support on the second market profile chart:

ES_MarketProfile_08052013_24H

ES_MarketProfile_08052013

Comments »