iBankCoin
Home / Tag Archives: $SPX (page 4)

Tag Archives: $SPX

The Break Is Your Context Today

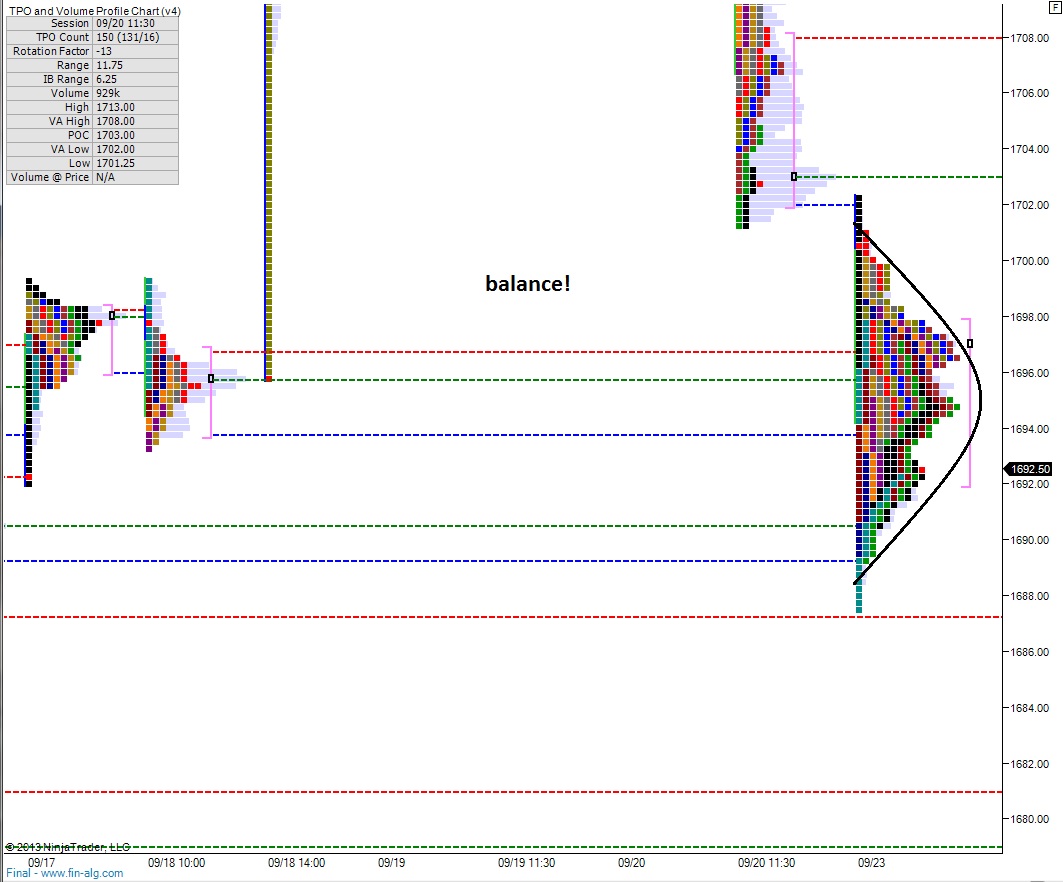
Strong earnings from the likes of MSFT and AMZN propelled the NASDAQ higher in the afterhours session yesterday while the S&P mostly consolidated and balanced.

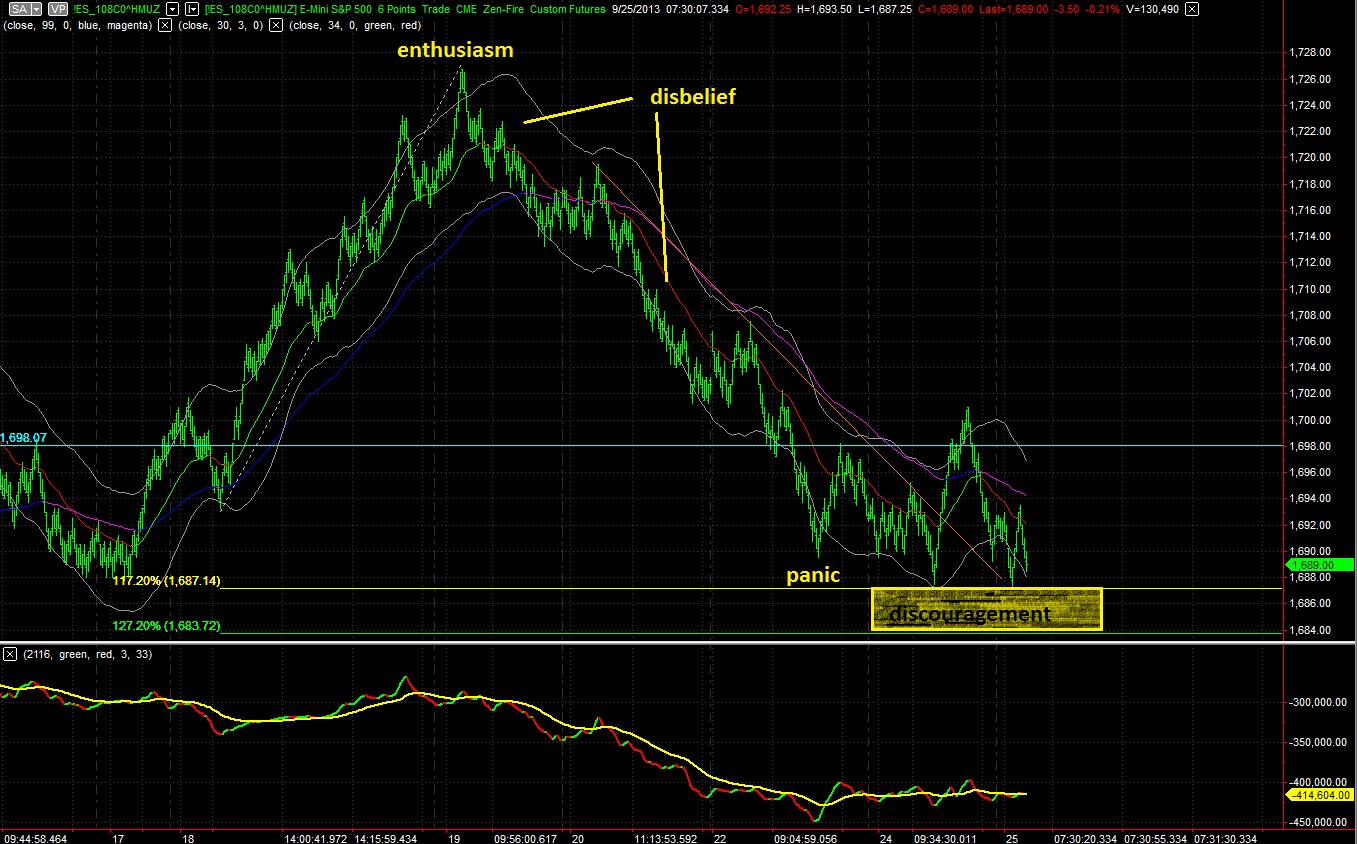
We are again being presented with the concept of consolidation on the S&P where it can be clearly seen we have a confluence of buying and selling—often referred to as a flag or pennant.  Sustaining such a formation up at all-time highs supports the idea of a performance chase into the end of the year.

Of course the flipside is sellers win out, and do so quite aggressively, pressing the market lower and leaving the chasers with their heads underwater.

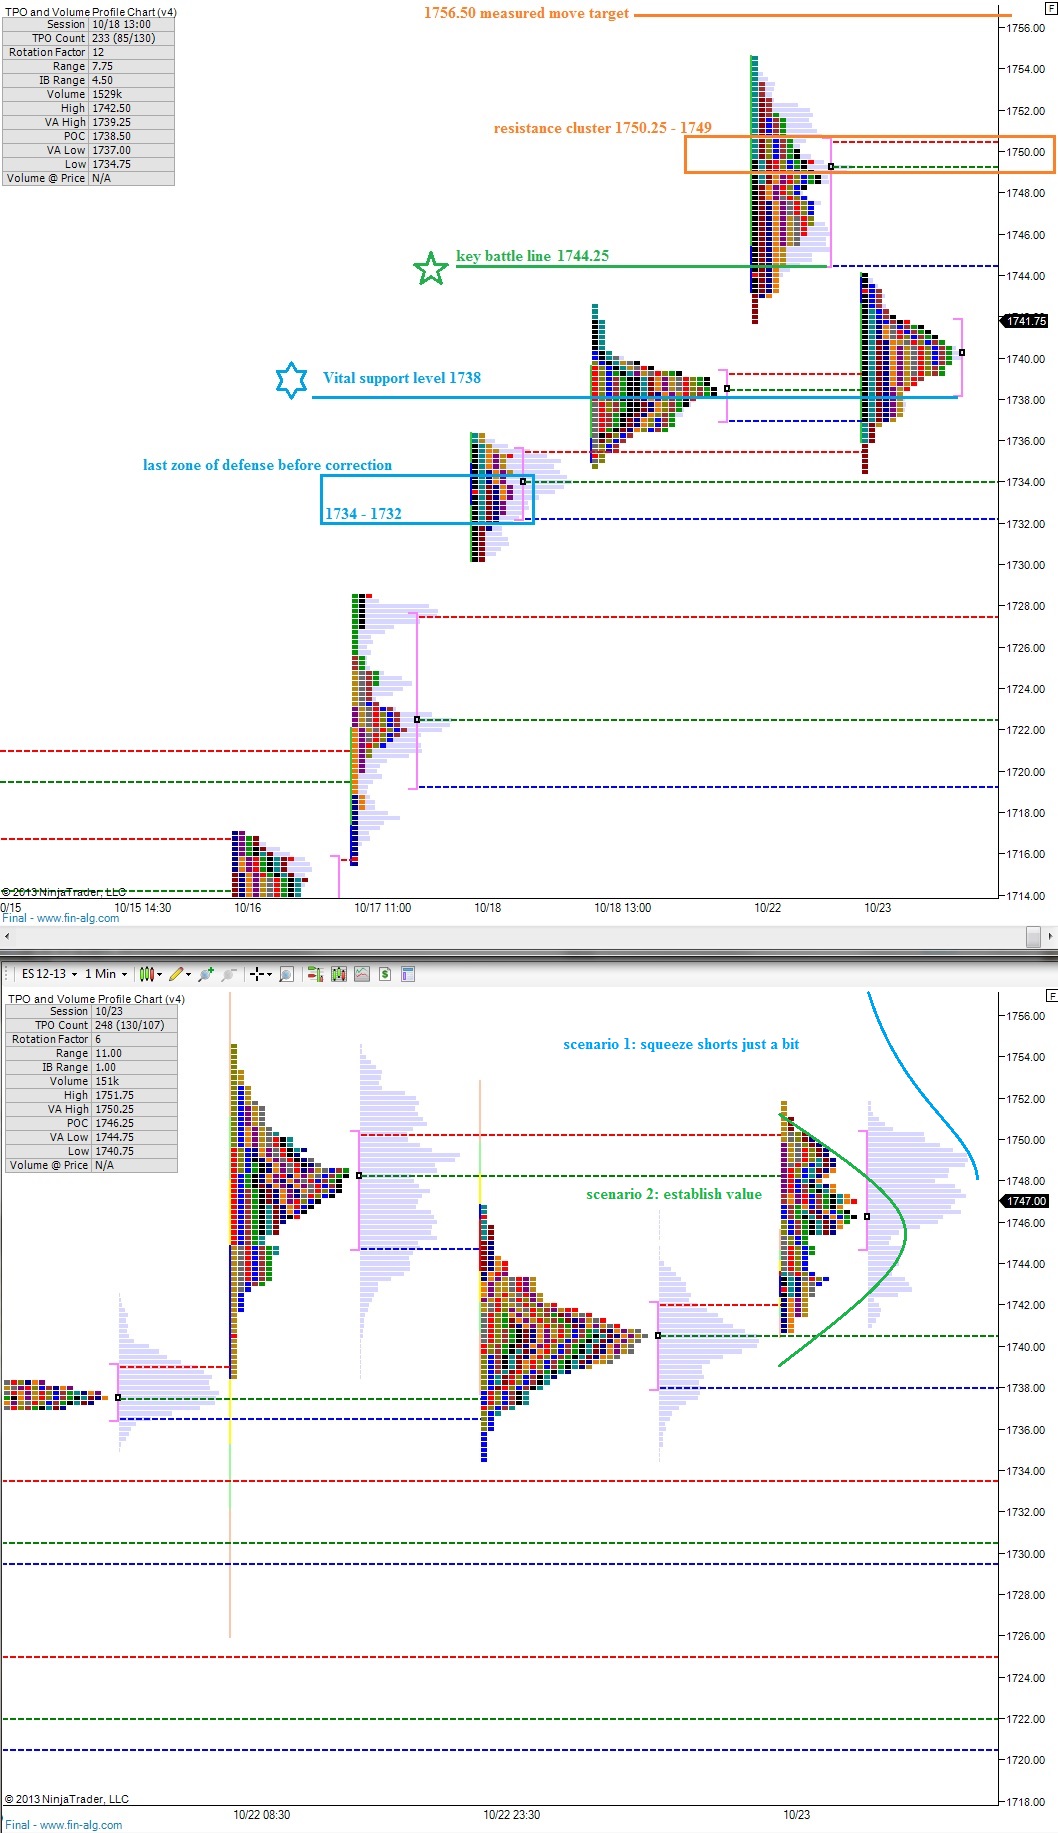
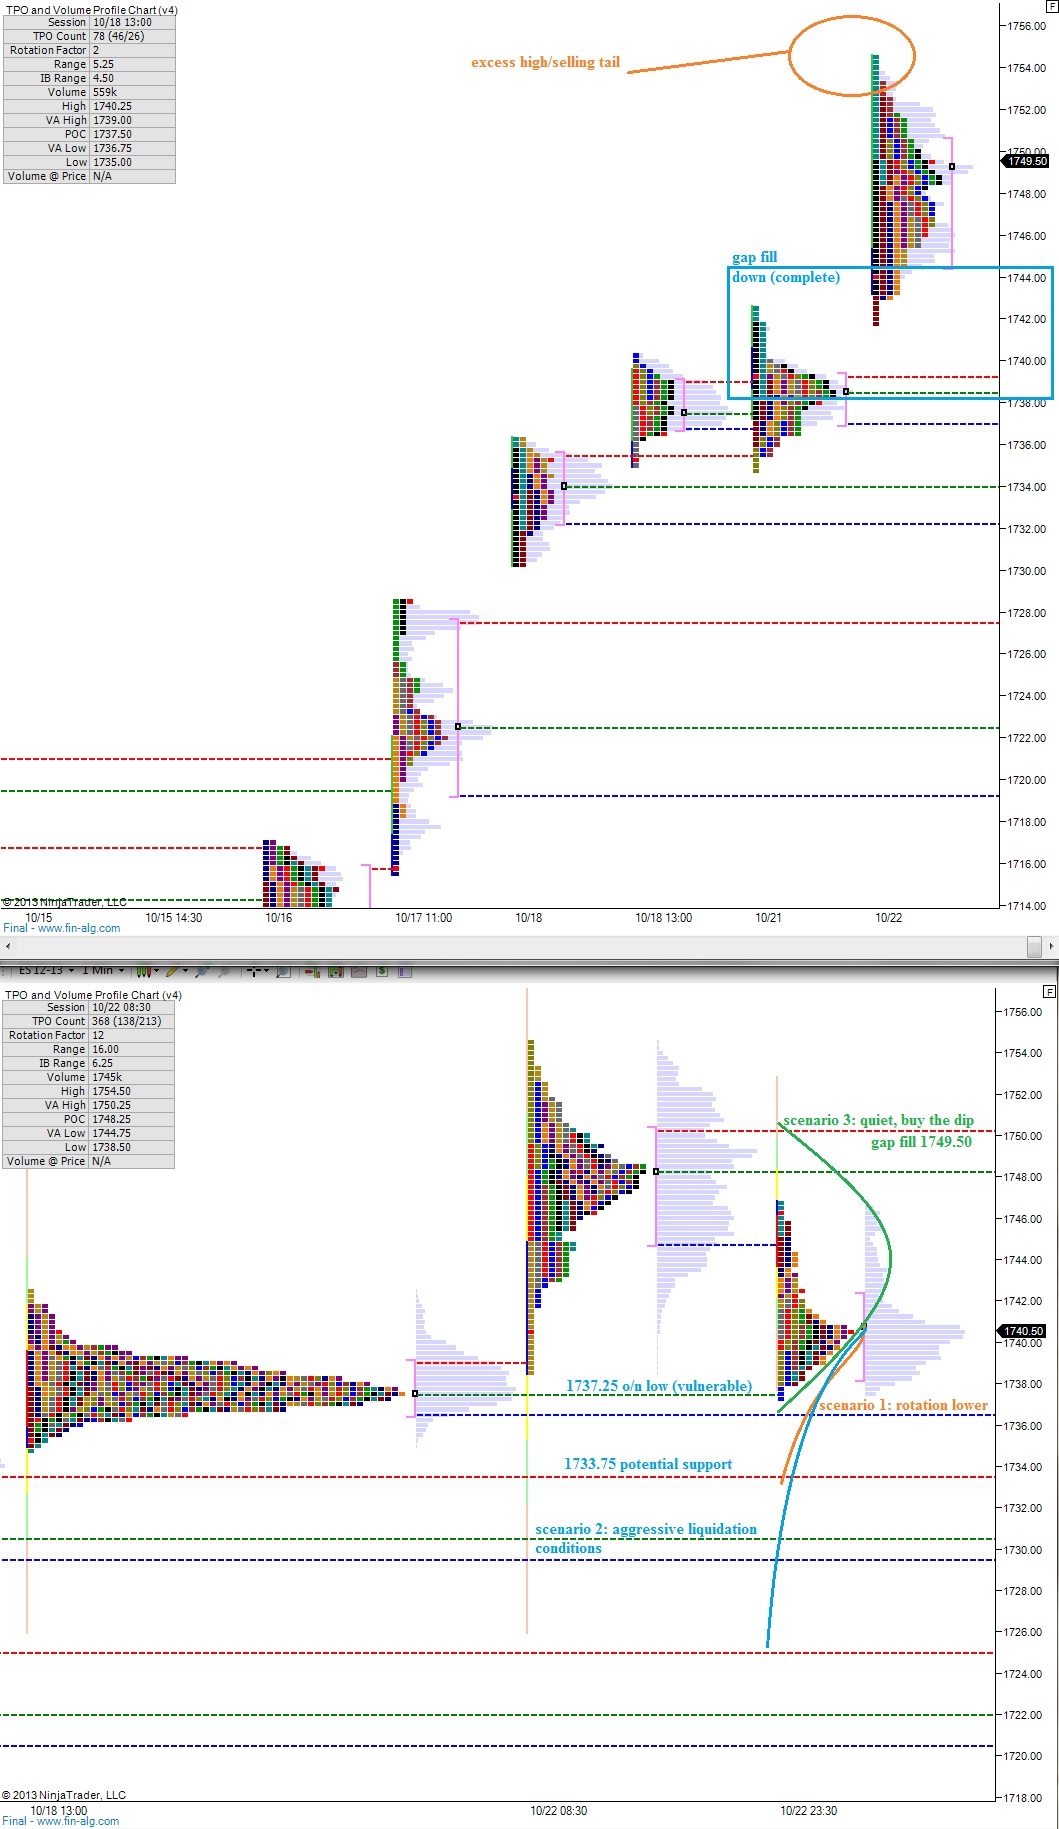
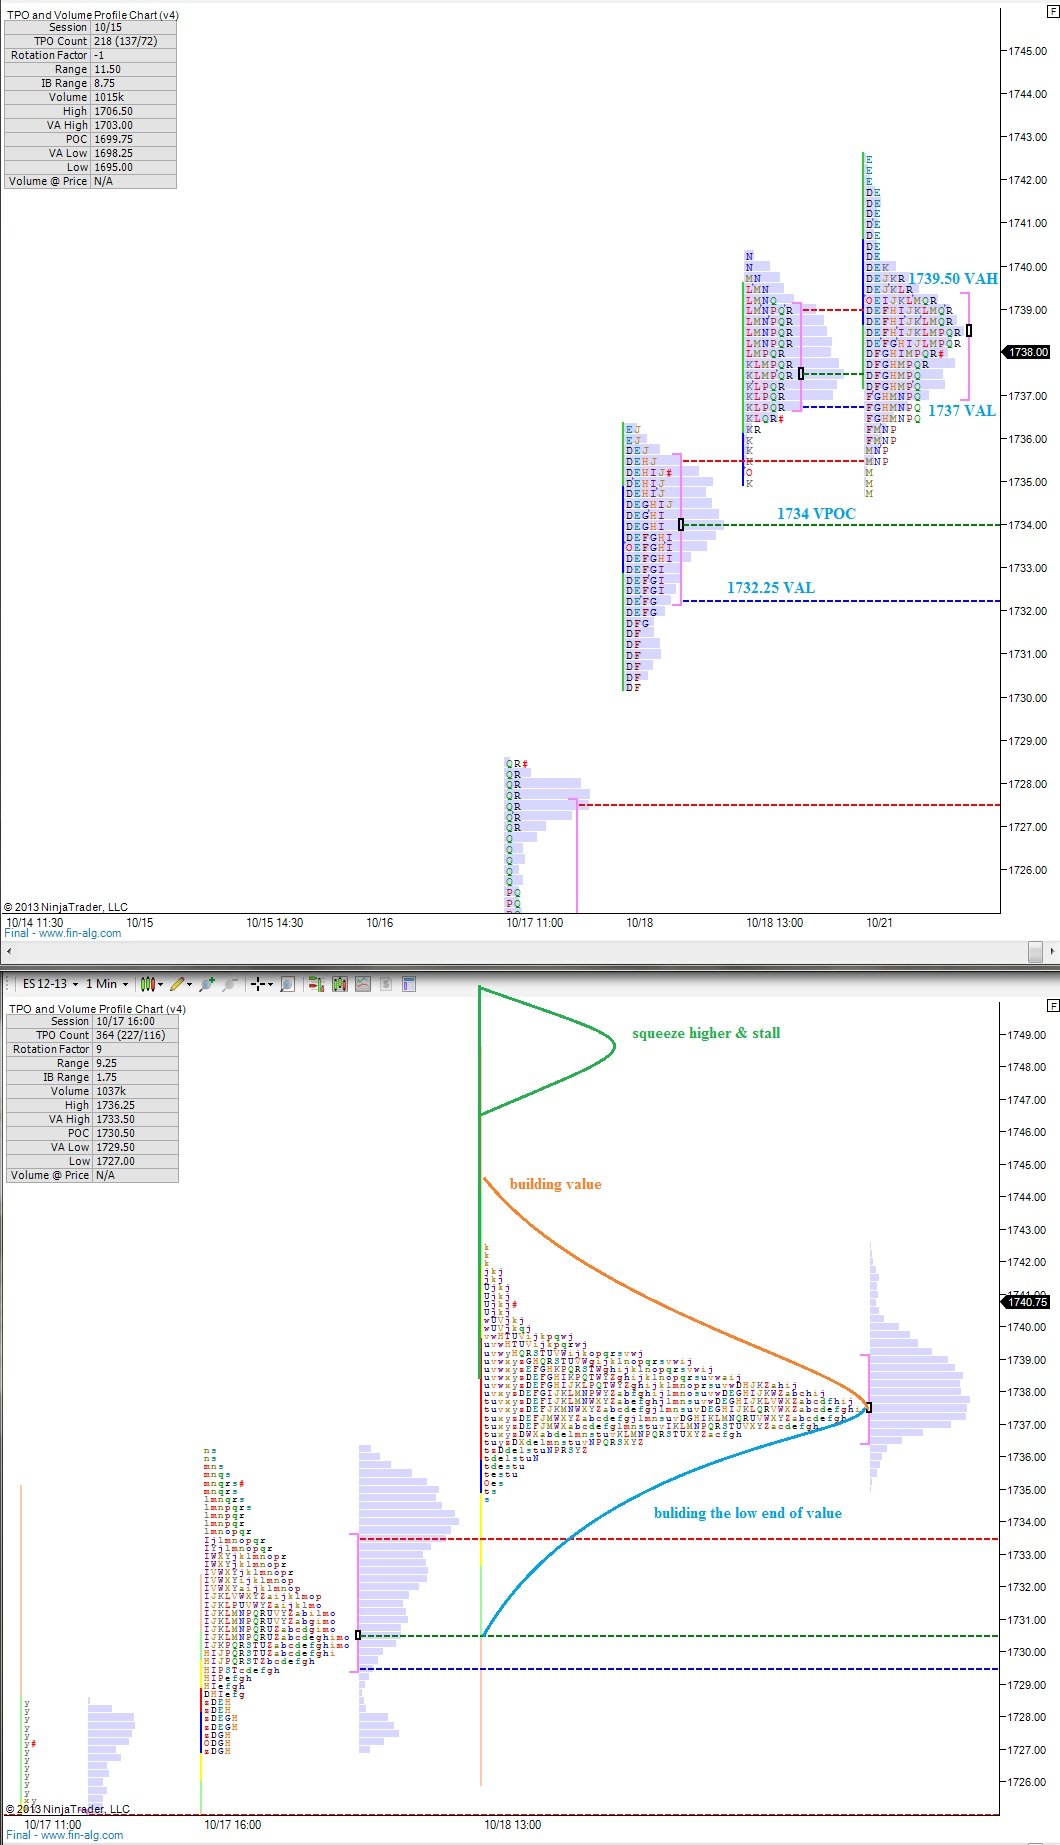
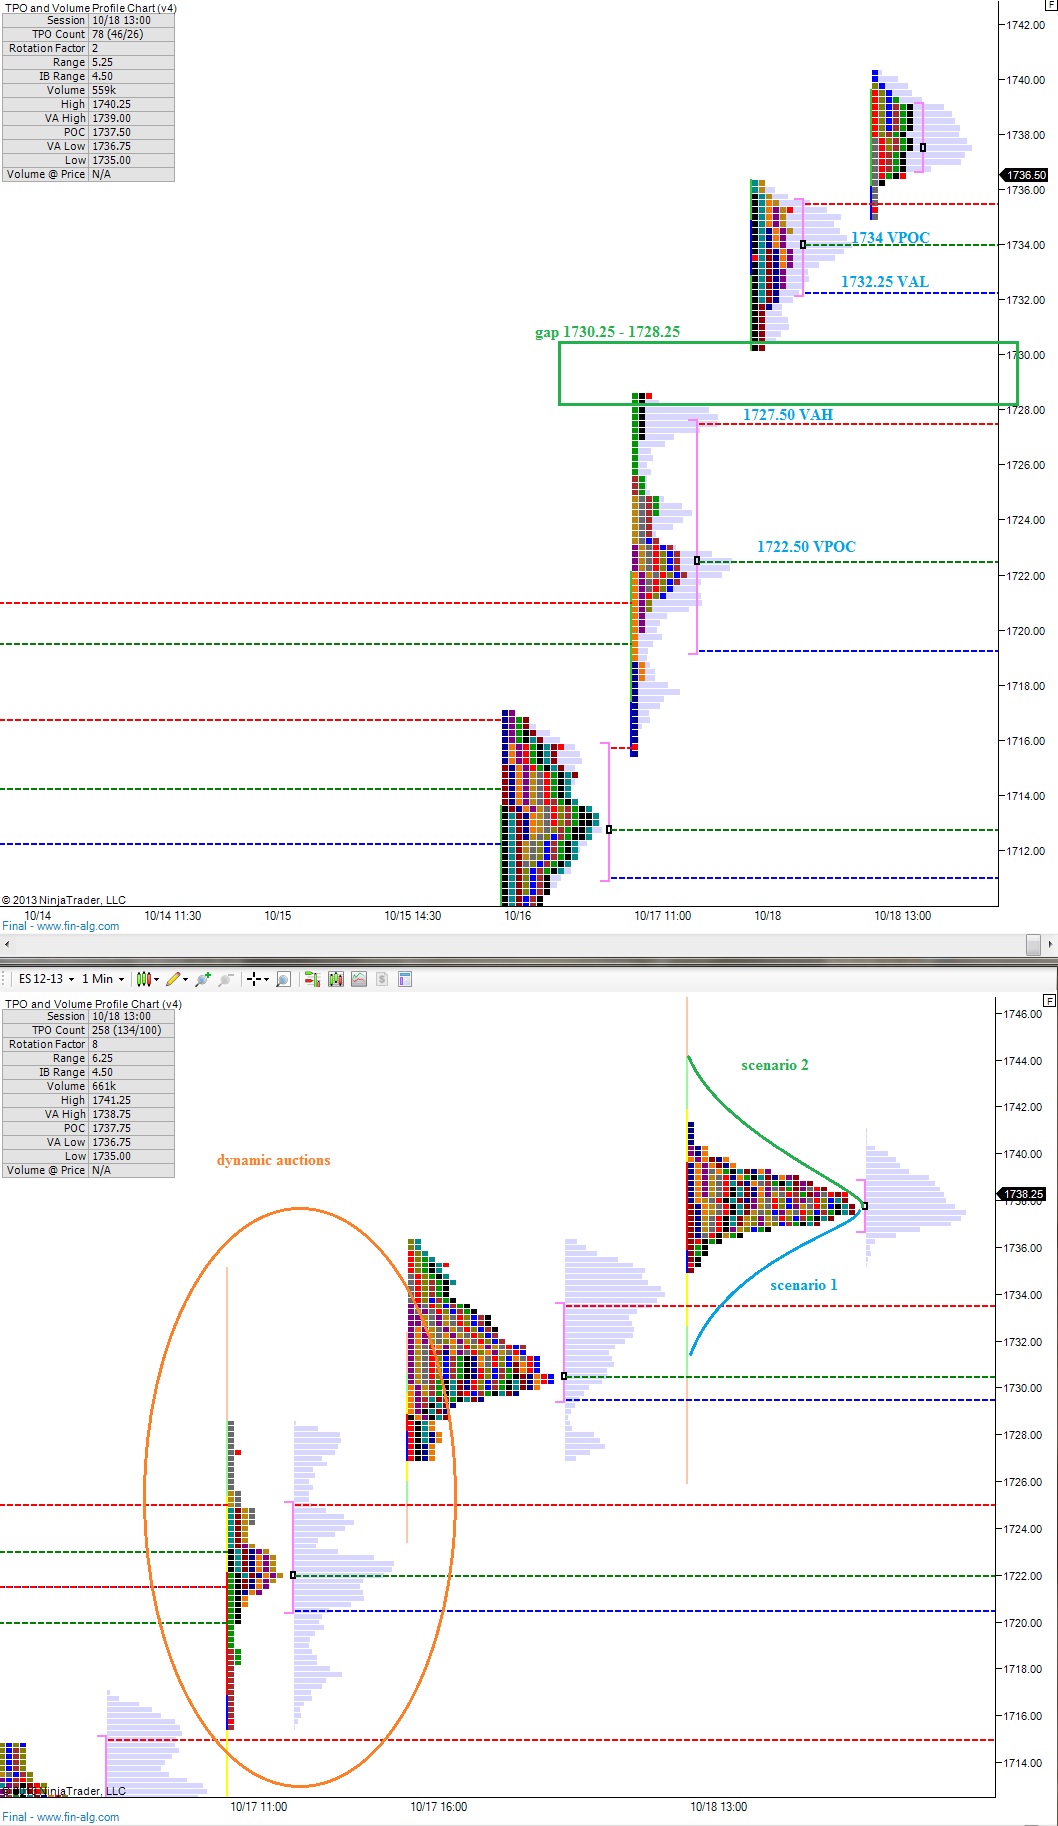
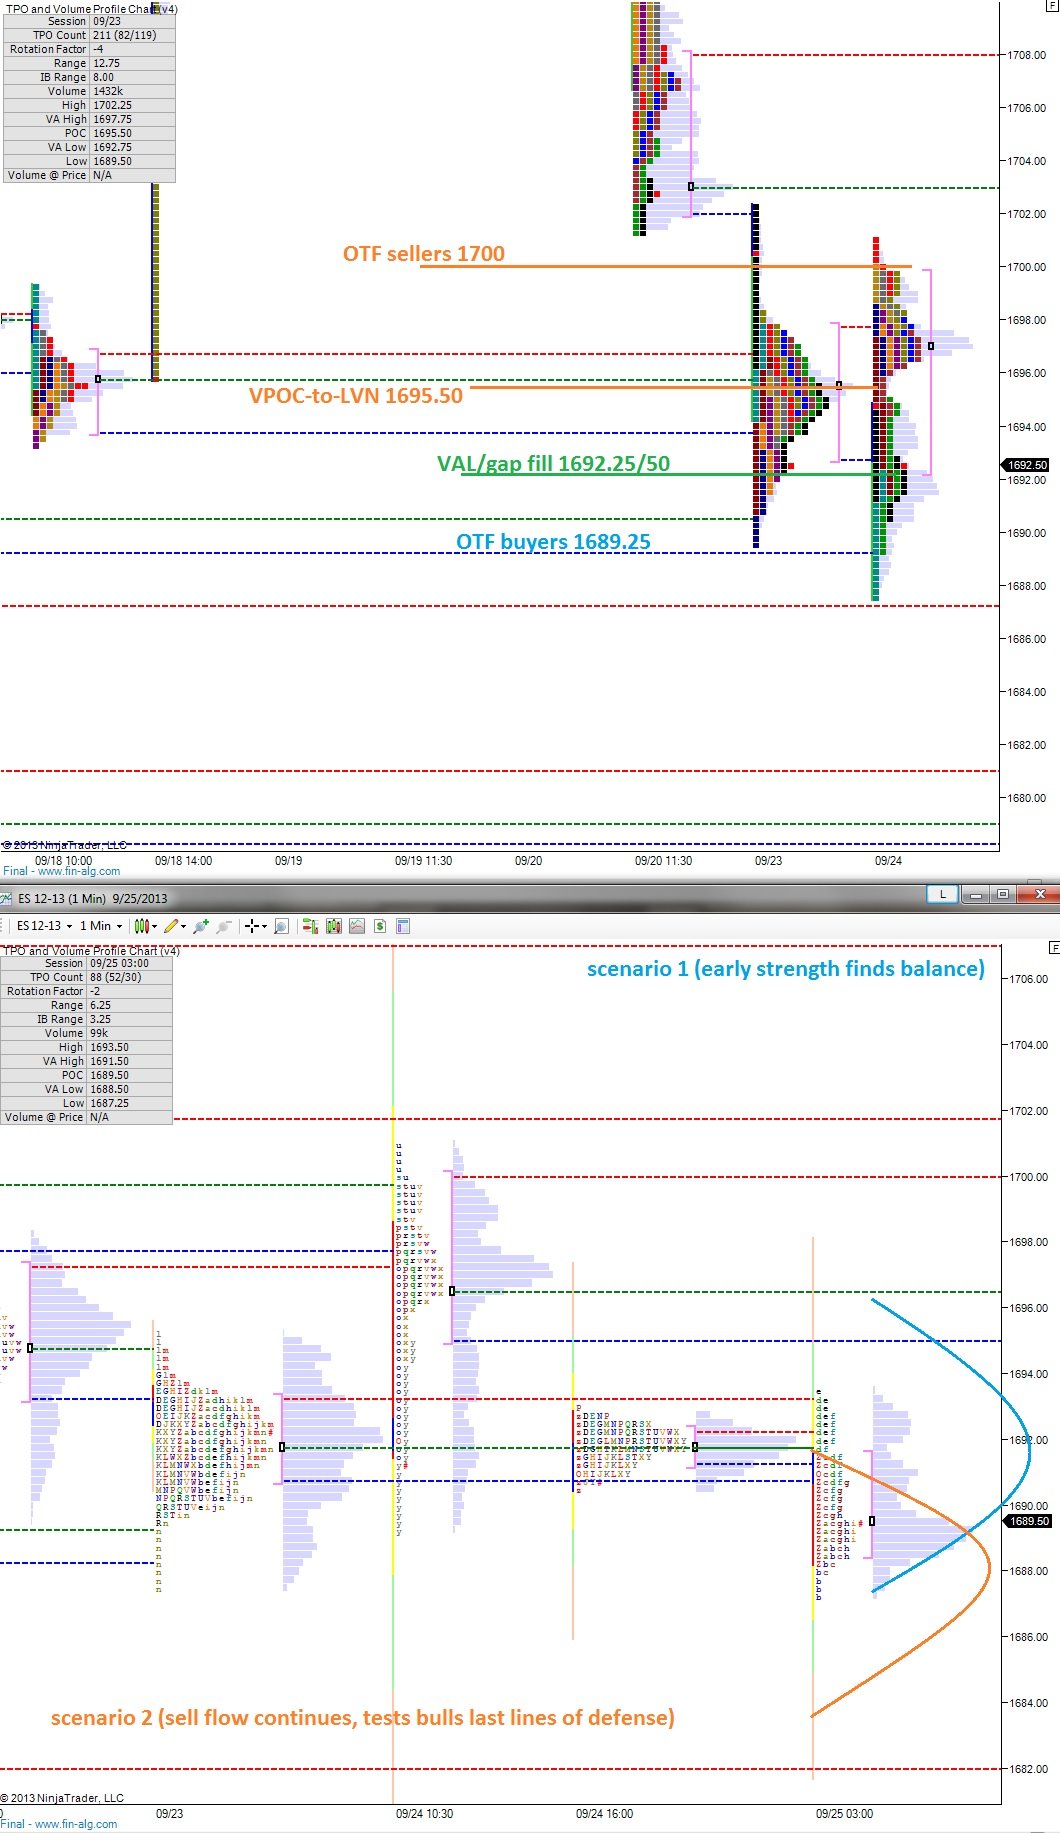
However there is no reason fret such an outcome because we can see the relevant price lines and adjust our stance accordingly.  I have highlighted price areas I consider significant in measuring the success of each party to the auction and also a few scenarios to help form your contextual stance on the following market profile charts:

ES_MarketProfile_10252013

Comments »

The Thick of The Auction

The market found some buyers overnight and pressed over 1750 for a bit before settling a bit lower.  The action left a gap below and it will be interesting to see how the sellers manage to fill the gap.

I have highlighted levels I find very interesting at this juncture and also a few relevant scenarios to guide your contextual feel in the following market profile charts:

ES_MarketProfile_10242013

Comments »

Signs of Excess

There were a few clues in the market profile print yesterday that could have clued you in to the potential for a down day to follow.  The first was an excess high or selling tail printed at the top of the profile.  This is represented by the single prints of TPO along the top of the profile.  The prints show an aggressive seller reacting to prices deemed too rich.

The second clue was the gap that remained unfilled during our regular trading sessions.  A gap-and-go type of trade rarely occurs at such elevated levels.  Instead they tend to occur as a sudden burst of order flow breaks us from a long period of consolidation.

The gap down filled overnight and now we get to see if buyers are capable of filling this morning’s gap above to 1749.50.  When we start getting into an environment where overnight moves increase in size, it makes sense to raise your guard and consider either hedging or elevating cash levels.

I have highlighted price levels of opportunity and also a few scenarios on the following market profile charts:

ES_MarketProfile_10232013

Comments »

Understanding Price Movement

The markets did very little overnight and continue to hold these elevated levels with a modicum of rotation.  This tight range is much like the base of a lamp where the more narrow it is, the easier it is to tip the lamp over.

Therefore we should define some reference points where the market may spill over in either direction.  Daily highs and lows are a simple measure of balance disruption and effective, but I like to envision what a balanced profile shape would be.  That way I can observe if moves away from value are normal parts of the current auction or an attempt by price to explore elsewhere.

I have drawn a few scenarios out and highlighted prices of opportunity on the following market profile charts:

ES_MarketProfile_10222013

Comments »

View from The Summit

The S&P futures traded in a tight and balanced range overnight, holding the high water mark levels established Friday afternoon.  Last week’s action was so dynamic it left behind areas of poor auction.  The market wasted little time climbing to these highs and as a result we do not have a strong foundation of auctions below.

The weekend brought nothing deemed significant enough to re-price the markets, so we can interpret the early AM moves relative to our current reference point to gauge the early-week conviction of market participants.

To my eye it appears less will without question be more in today’s environment as price action looks choppy and quiet.

I have highlighted a few scenarios and levels of opportunity on the following market profile charts:


ES_MarketProfile_10212013

Comments »

Clear Sentiment Emerges from The Fog

This morning took a bit of extra chart work to get the right context built.  I want to sum my thoughts very briefly before turning your attention to the following chart diagnostics for the S&P 500 and what they suggest about the sentiment of the overall market.

First I present a bar chart with some sentiment commentary.  You may recall this chart’s similarity to the frequently referenced Option Addict sentiment chart.  To my eyes we are working through discouragement, which is a buying opportunity as long as we do not blast through the lows:

ES_Sentiment_09252013

Next I present my usual daily profile analysis, both on the 24 hour profile and the RTH profile.  I like the RTH profile more for defining areas to do business, inflection points, etc.  I use the 24 hour chart to map out a few potential scenarios on the day.  I have only listed two scenarios of setting value in a balanced manner.  If we achieve the high or low of either scenario in short order, it opens the door for a third or fourth scenario of trending.  Keep that in mind when you observe the following market profile charts:

ES_MarketProfile_09252013

Finally, when I was working the above RTH charts, I found it very interesting that the volume point of control from Monday formed a rather extreme low volume node yesterday.  It is quite the contrasting treatment of 1695.50, yes?  So I merged the two profiles together and it gave me the right picture.  We have, in fact, balanced out:

ES_MarketProfile_0925b2013

Therefore we must closely observe how the market treats the VAH and VAL of this combined profile.  It will give us a clear picture of the buyer/sellers conviction and capacity to dictate the direction of the tape.  I am considering reducing long exposure if price is accepted (traded greater than ~1hr) below 1684, otherwise I see 1684 as a buying opportunity and any trading above these levels as peddle to the metal long.


Comments »

Club Sandwiched

Today’s session had a smack of indecision which led to me selling First Solar into the closing bell.  It goes like this:  you’re sitting in a well-sized, well entered position in an industry—in this case solar.  You’re also sitting in an oversized, well entered position in the same industry.  The oversized position, in my case ENPH, gets beaten over the head for the third straight session and now you face a decision.  Do you cut the loser, even though it’s technically still on track with your plan?  Or do you cut the small winner, thus reducing your overall exposure to a bipolar industry?

I chose the latter, and I’d do it again if I had the chance.

It does take a certain bit of blissful ignorance to let your balls swing low in this market.  We printed another doji candle in the $SPX, and I plum don’t like where this one is placed.  So I cut FSLR.

FSLR in all honestly, because I’m an honest mother lover, presents a better chart setup than ENPH.  But I see less downside risk in ENPH, as we near my max pain level.  About $6.50, on a closing basis, is max pain.  I won’t become an investor in ENPH, if you know what I mean, but certain setups take time to reward you, and the reward is sweet money.

That and I bought EXK and played grab ass in the futures.  That’s my day.  Good night.

Comments »