iBankCoin
Home / Tag Archives: $QQQ (page 26)

Tag Archives: $QQQ

Coming into Overhead Supply

Yesterday was a strong day for the NASDAQ index, a day marked by aggressive other timeframe (long term) participation.  We really dial down in these morning context reports to wrap our mind around the context of the marketplace.  We focus on the NASDAQ because most of the high flying momentum stocks reside within it.  As important as the short term timeframes are to our daily decision process, we always have to keep sight of the big picture.  The long term auction is still buyer controlled.  This can be seen as a series of higher highs and lows on the daily COMPQ chart.  The long term buyer is now tasked with making a new swing high, otherwise the long term auction may come into balance.

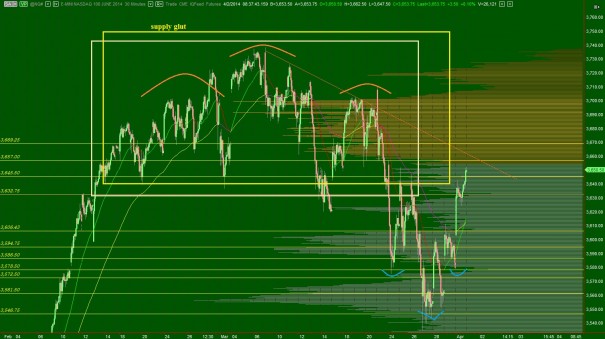
The intermediate term timeframe is balanced.  The strong move yesterday was dynamic enough to push sellers out from their controlling position.  We are however nearing a price zone where I have some expectation of selling.  Price is pushing up into the bottom of our uppermost balance distribution which dates back to February 13th, a day when Ben Bernanke gave the market a final push before leaving his post.  As participants are made whole, we may see supply coming into the market.  I have highlighted some key price levels on the following volume profile composite:

NQ_VolumeProfile_intermediateTerm_04022014

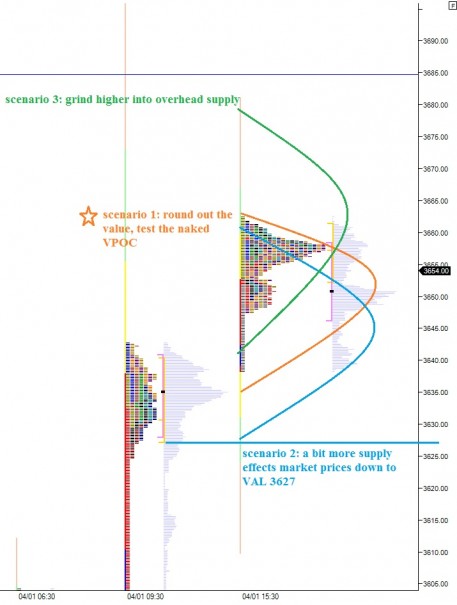
The short term auction is buyer controlled.  This can be seen as value progressing higher over the prior few profiles.  It can also be seen as a lack of overlapping value areas which tells us the buying force is dynamic enough to keep value on the move.  However, our current profile which includes part of yesterday afternoon’s rally and all of the globex session presents a slight imbalance.  From this imbalance, I envision some downside early on.  I have highlighted this scenario, as well as a few other observations on the following market profile chart:

NQ__MarketProfile_04022014

Comments »

Opening Swing: Second Edition

Opening swing is an ongoing series where we review the opening swing for each day of trade in the NASDAQ futures and observe and discuss tradable opportunities.

The opening swing is a high and low that is set by the initial auction right after the market opens.  It is independent of time and is not the same as the opening range or initial balance.  The opening swing is the high of the first push up and the low of the first push down or vice versa.  It measures how far the Market On Open (MOO) orders take the auction right after the open.

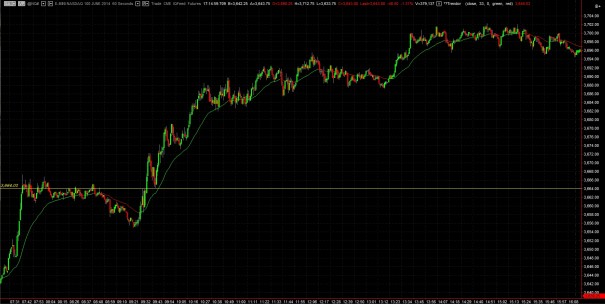
This week is an interesting week to observe because we saw some big intraday moves as we grinded into option expiration.  One of the interesting characteristics of Monday and Tuesday was the inability or impatience of the market during the opening swing.  It seemed as if no MOO sell orders existed and the auctions were unable to set opening swing lows.  Instead price would set an opening swing high and then continue driving higher.  These were opening drives and without proper understanding of them a day trader can go bust rather quickly trying to fade them.

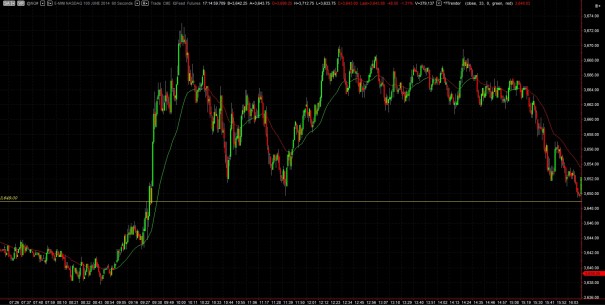
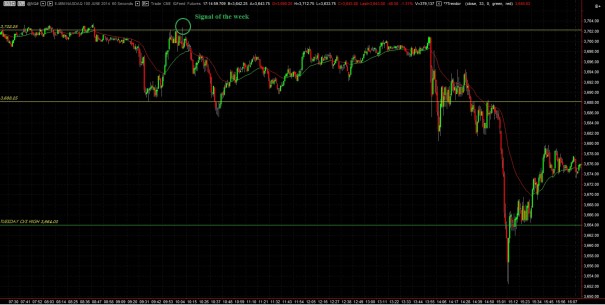
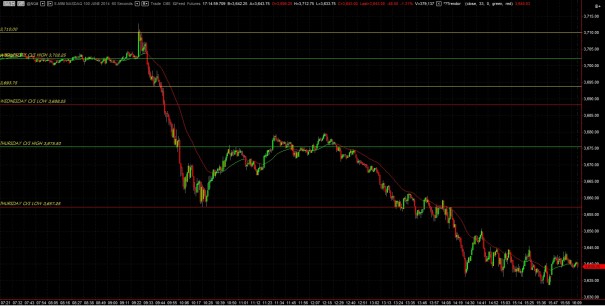
Wednesday presented the trade idea I have been envisioning, and it even came on the short side which was a bias I had for intraday trades this week.  Soon after the opening swing high was printed, too soon after, the market attempted to trade above opening swing and was quickly rejected.  It turned out to be the high of the day and if properly executed then all a trader had to do for the rest of the day was scale profits at logical price levels (like opening swing low, market profile levels we discuss in the mornings, etc.)  The influence of the opening swing levels was very clear Wednesday and was all the information you needed to properly trade the inaugural discussion from Janet Yellen.

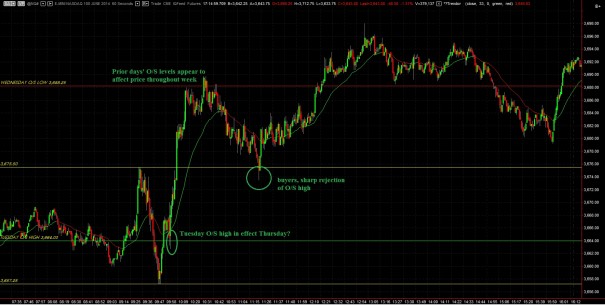
Toward the end of the week, it was interesting to see how prior O/S levels affected trade.  I have already gotten too wordy.  Check out this week in the NASDAQ from the view of the opening swing.  If you are as eager as I am to trade this auction action, be sure to compare each day’s opening swing to my morning market profile report for a comprehensive view of live auction theory application.

MONDAY:

NQ_OS_03172014


TUESDAY:

NQ_OS_03182014


WEDNESDAY:

NQ_OS_03192014


THURSDAY:

NQ_OS_03202014


FRIDAY:

NQ_OS_03212014


Comments »

Fill The Cave

Equity futures are currently priced to gap up after printing over 40 handles in range on the NASDAQ.  As I write, prices are coming in a bit, and by the looks of both the intermediate term balance profile and the overnight profile, the action could be fast this morning.

Yesterday’s context report focused on the intermediate term balance, and whether price would stay in balance on the intermediate term or instead begin exploring lower.  Bracketed (or balanced) trade can be very frustrating noise for the trader if they are not aware it is occurring.  It can result in unnecessary capitulation and overconfidence at the extremes prior to getting faded.  The last two sessions in the NASDAQ have effectively set the floor and the ceiling for our balance zone.

If you have ever seen a live auction, you have seen this action.  Yesterday the market pressed lower in search of buyers.  They were found in the form of a sharp reaction.  Once a baseline bid is established, price can very rapidly move in the opposite direction to form the extremes of an auction.  Now market makers and specialists and hedge funds and retail participants meet and hash out the details of this balance to determine if the value is an accurate representation of the NASDAQ or not.

Long term auction is controlled by the buyer.  This can be seen as a series of higher highs and lows on a daily and weekly chart of the $COMPQ.  Yesterday we nearly brought the long term into a balance scenario, but we managed to print a higher low.  We need to monitor any retest of yesterday’s low very closely, and we need to consider reducing exposure should price be accepted below perhaps yesterday’s open at 4261.42 (on the $COMPQ).

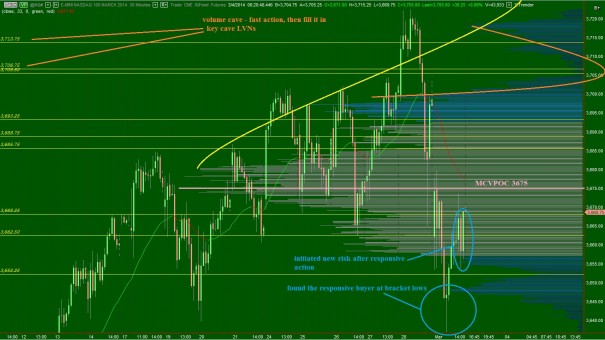
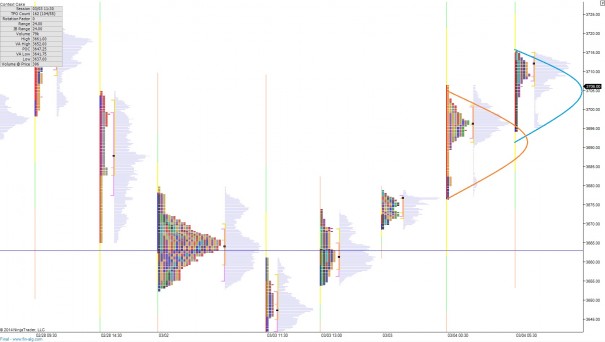
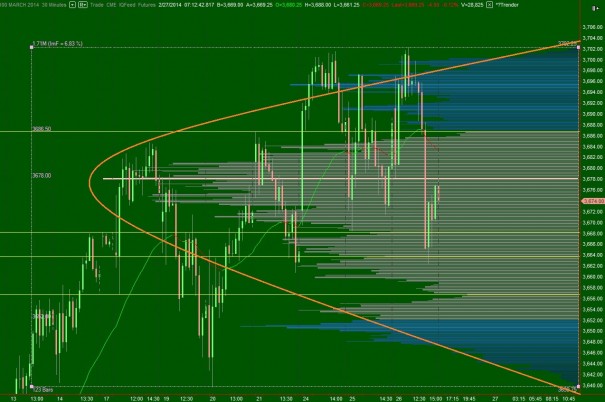
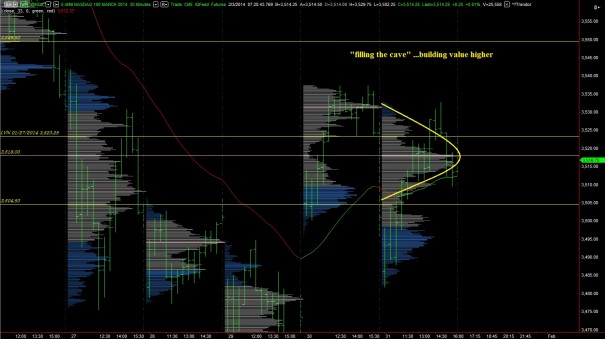
The intermediate term auction is in balance.  This balance stretches back to 02/13 when we broke above the neckline of a V-shape recovery.  We are currently prices to open inside a cave inside the intermediate term auction.  Price will move fast in this low volume environment, at least initially, and often times we spend time filling these voids in prior to exploring elsewhere.  Intermediate term balance is aging, and a move away from it becomes more likely with every half hour that goes by.  I have highlighted this cave feature and some other observations on the following $NQ_F intermediate term volume profile:

NQ_VolumeProfile_intermediateTerm_03042014

We covered tons of ground, in the short term, but buyers are back in control.  This can be seen via the migration of value higher over the last few distributions.  However, the last two profiles suggest a slight downside imbalance exists.  It would not surprise me to see some backfill early on.  Given the overnight inventory is long, it would make sense to press into that inventory and test its conviction.  Conversely, should we see an opening drive, we can begin to consider the long term timeframe reentering the market, and we should join them.  I have highlighted the imbalances I expect to see resolved on the following market profile chart:

 NQ_MarketProfile_03042014

Comments »

From False Moves Come Fast Moves

Yesterday price in the NASDAQ composite stretched to a new swing high.  We poked up above and no follow through occurred.  One of our favorite trades as of late has been the false bear technical patterns.  This means, we wait for a technical chart setup which favors the bears occurs, then we watch to see if it follows through.  If it doesn’t, then you pile in, essentially calling the sell flow’s bluff.  The moves occurring after false moves are often vicious. The effect may be similar into the close of this week, should the sell flow continue overpowering demand.

It will be a more difficult task however, for the long term control of the market is controlled by the buyer.  This can be seen as a series of higher highs and lows on the daily and weekly charts of the NASDAQ composite.  It has been a resilient bull, and it certainly is an aging bull, but it’s still a bull until proven otherwise.

Intermediate term, we have a solid balancing act occurring.  This balance area continues to grow, and I continue to profile it for our benefit.  The intermediate term can be seen transitioning from buyer control to balance when a series of higher highs and higher lows became sloppy and now we are seeing indecision.  I have highlighted some interesting levels on the following micro composite of intermediate term balance:

NQ_VolumeProfile_intermediateTerm_02272014

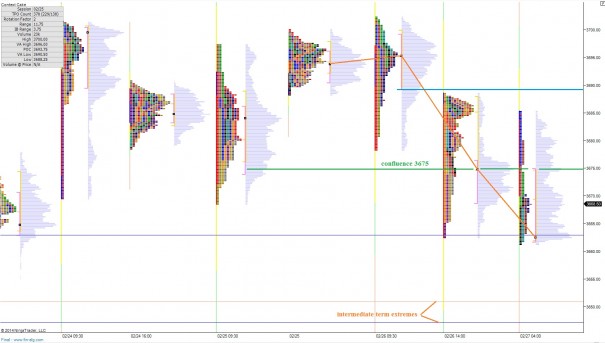
The short term timeframe is controlled by sellers.  They have successfully pressed price and value lower since yesterday’s new swing high and have successfully negated the buying tails we have seen on recent market profiles.  We are set to open inside range, slightly inside value as of this post, which presents a medium risk intraday environment.  If price can sustain above 3675 we would negate the seller control on the short timeframe shift to a balanced focus.  Otherwise, I am preparing for a test of intermediate term extremes to ensure buyers are still as confident as they were on 02/13.  I have highlighted these observations on the following market profile chart:


NQ_MarketProfile_02272014

Comments »

Timeframe Roundup

Long term directional timeframe remains in the controlling hand of the buyer, who has been successful in their campaign for higher prices.  This can be seen as a series of higher highs and higher lows on both the weekly and daily charts of the NASDAQ composite.

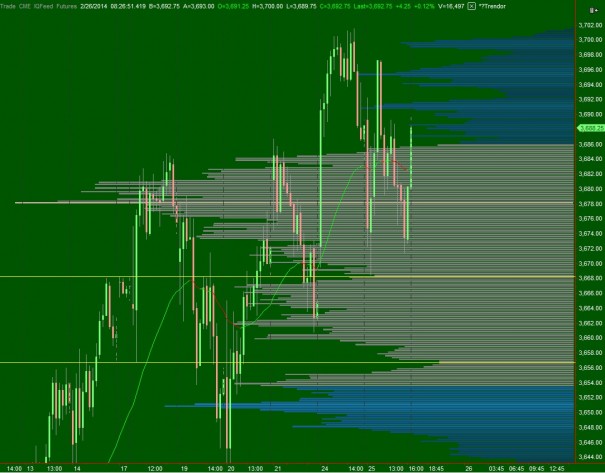
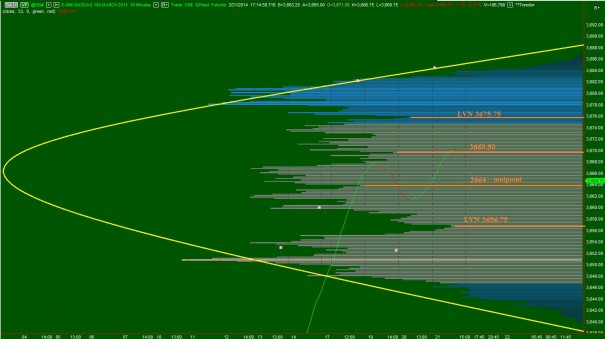
The intermediate term is still balanced.  Yesterday we printed a lower high verse Monday’s session, and also a lower low.  Interestingly, the lower low was early in the session and was met with strong responsive buying.  However, not enough initiating buy flow came to push a new high.  Instead we printed a lower high and ultimately a higher low coiling before closing.  We can see the market struggling to make a vertical move out of our intermediate term balance on the following volume profile chart.  Should the intermediate term control dictate market direction today, we may see sellers targeting yesterday’s low at 3668.25 and then the low volume node at 3656.75.  I have highlighted this level on the following volume profile chart:

NQ_VolumeProfile_intermediateTerm_02262014

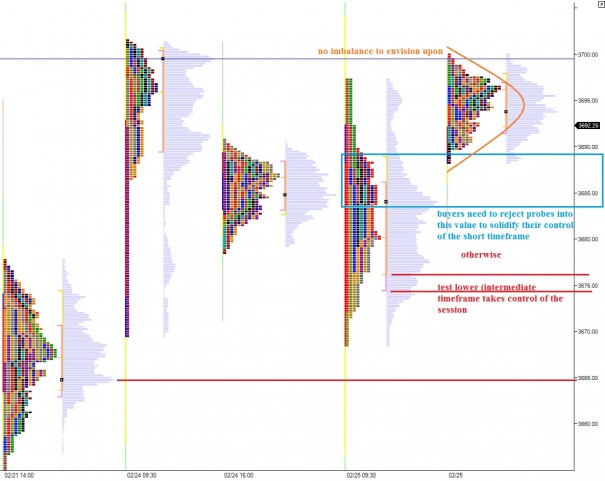
The short term is in buyer control.  Yesterday looks like an ugly candle print on a normal bar chart, but when you view the auction that took place via market profile, you can see the buyers were responsive at the lows and their flow was dynamic enough to press prices up out of our distribution.  Since then, they have held us above yesterday’s distribution and formed balance [acceptance] in our uppermost distribution.  To solidify the buyer control of the short timeframe, buyers need to hold us above yesterday’s value area either by rejecting attempts into the zone, or by avoiding it entirely.  I have highlighted this buyer goal on the following market profile chart:


NQ_MarketProfile_02262014

Comments »

Morning NASDAQ Trader Report

There has been solid overall auction activity overnight where we are seeing constructive action from both the buyer and the seller.  Late into trading Friday the sellers rejected the uppermost distribution we were forming.  Their action could be seen as a swift vertical movement lower followed by an hour of “acceptance” of the new prices via sustaining the levels.  Once the futures opened back up for business, we gave the area a solid auction lower, found a bid, and pressed above where we are currently finding selling.  The net activity forms a nearly symmetrical distribution of time and volume.

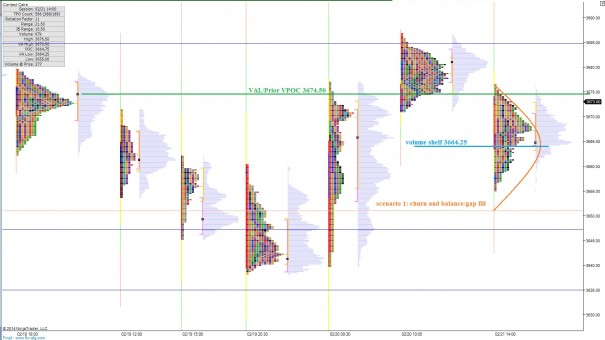
The profile however, does appear to have a slight imbalance which sellers could capitalize on early this morning.  It appears to be contingent upon how we handle 3674.50 early on, a value area low and sight of prior responsive selling.  If we again find sellers here in the early USA hours, we may see an attempt to balance out our current profile by trading down below the volume shelf at 3664.25.

Of course, if sellers are unable to respond at 3674.50, then we may see another drive for fresh highs.  Also, if sellers cannot push us over the volume shelf to balance out our current profile, then we would gain a valuable bit of insight, that buying force is great enough to disrupt the natural tendency of Gaussian distribution.

In the short term, I give sellers a slight edge in control.  This is void if they do not show responsive trading at 3674.50.  This short term control by sellers firms up if they push us below the shelf at 3674.50.

Intermediate term, we are in balance.  I have highlighted this balance and a few key levels on the following micro composite profile, spanning about 6.5 days of trading activity:

NQ_VolumeProfile_intermediateTerm_LateFeb2014

Long term, buyers are in control.  This can be seen as a series of higher highs and lows on the daily and weekly COMPQ chart.

Below is my vision for the morning, where I have highlighted the key price point and a scenario for the session using my market profile chart:

NQ_MarketProfile_02242014

Comments »

High Demand Price Points

Equity futures are slightly up overnight, snapping the consistent seller control the globex hours have experienced all week.  This presents us with conditions this morning which are different from all the prior days in this holiday shortened week.

As the USA comes online, prices are right in the middle of a balanced price distribution.  There does not appear to be any sort of imbalance in the short term for us to envision scenarios upon.

The buyers are in control of the short timeframe.  They were successful in defending us against the “slip zone” yesterday by exhibiting the same type of aggressive demand at these levels as we had seen during the first go at prices.  It’s slightly odd, because the profile we were printing yesterday premarket has an imbalanced look—and to complete the distribution would have put us well into the slip zone.  This could have started a liquidation trade.

This is an interesting clue, because it signals the buyers were acting with enough haste and force to disrupt the natural process of distribution.  By doing do, they claimed control of the short term timeframe.

The intermediate term timeframe is balance.  Until we see a higher high, we are in a balancing zone where mean revision is likely.  The long term control is in buyers hands.

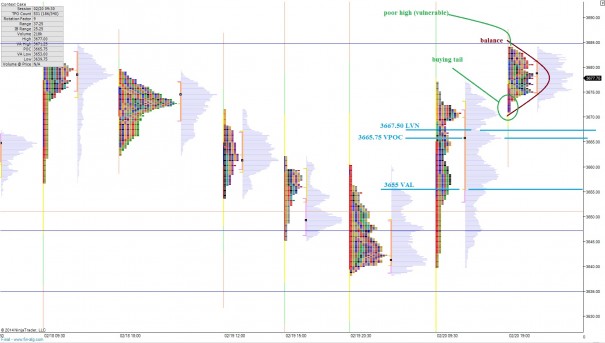
We could get a sense of buyer sentiment by testing lower today to see if demand still exists at key prices like 3667.50 where we printed a low volume node on a surge of orders.  Should we test this level, and not find the same amount of buyer participation, we may continue to test lower to the VPOC at 3665.75 and our value area low at 3655.  I have highlighted these levels and a few other observations on the following market profile chart:

NQ__MarketProfile_02212014

Comments »

The Day After a Trend Day

In market profile theory, one of your goals is to detect trend days as early as possible and get on board the move.  One of the catalysts for a trend day is an opening drive.  The opening drive features one maybe two ticks in one direction, then a strong drive in the opposite with hardly any overlap in the TPOs (or 30 minute bars).

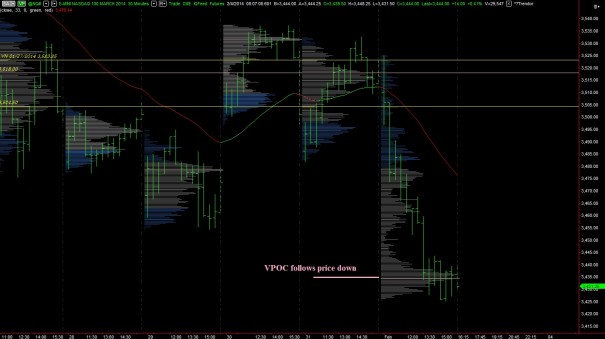
Yesterday we had a slightly different open, the open-rejection-reversal, but it indeed sparked a trend day.  It could be seen a few other ways, too.  The volume profile print showed no definitive value area all session.  Instead volume-at-price would form a modest node and then press lower again.  We ended the day with value hear the low as can been seen on the following volume profile chart:

NQ_02042014_trendday

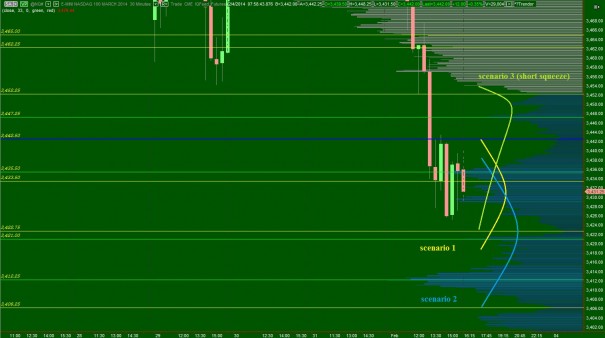
The market profile theory says any entry in the direction of the trend day offers a low risk entry into the next session.  Thus, any short taken yesterday could be held overnight with anticipation of being able to buy the position back at lower prices.  With this idea in mind, I have highlighted a few scenarios and also the relevant price levels for today’s trade on the following composite chart:


NQ__VolumeProfile_02042014

Comments »

A Heaping Dose of NASDAQ Context to Start The Week

The futures were active overnight, albeit slightly quieter then we have seen in recently.  We do not have any major premarket news on tap, thus our early analysis should hold relevant into the opening print.

As the USA comes online, the equity futures are trading slightly lower with the NASDAQ down 1.5 and the S&P down 0.75.  For the duration of this post, I will be focusing on NASDAQ futures via the /NQ contract.

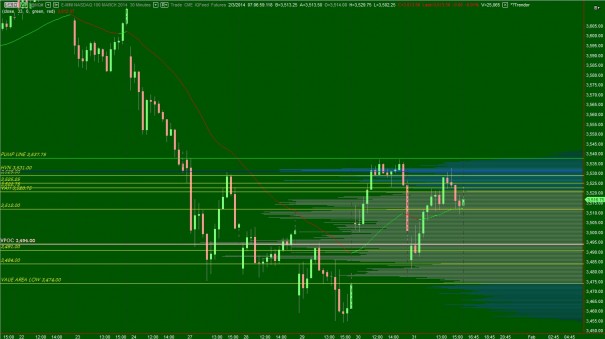
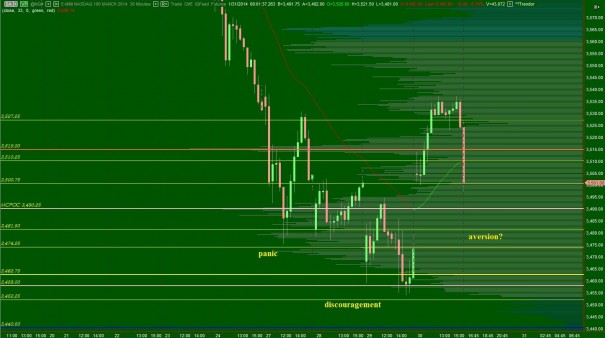
We came into last week on the tail of strong sell flow from the week prior.  A gap lower on Thursday the 01/23 resulted in an odd print because afternoon strength took prices to the high of the session at the close.  The next day we gapped lower and printed a trend day down.  This marked the beginning of sellers taking control of the intermediate term auction.  We continued lower on Monday before finding some responsive buyers in what I perceived as panic trade lower.  The rest of the week the market began balancing out, and by Friday the intermediate term control was back in balance.  I have pictured the above commentary on the following chart:

NQ__VolumeProfile_02032014_INTERMEDIATE_TERM

The trading has been framed within the context of the sentiment cycle chart option addict introduced and often referenced.  I have been under the impression that action quickly worked through discouragement and climbed the wall of worry before ultimately printing aversion on Friday morning where we bought the dip.  If this is the case, I want to see quiet market action over the next few days—denial taking hold.

The other possibility is we have not even begun to see panic.  If this is the case, the market should accelerate rapidly to the downside, soon, blowing through intermediate term and long term control.  This is very much a possibility and a would be remiss to ignore this possibility.  I have a line in the sand at 3440.50 but should price begin accelerating violently to the downside, I may begin reducing exposure well before then.  Let’s run through who controls the auctions on various timeframes:

Long term control: buyers—this can be seen as a series of higher highs and lows on a weekly chart.  However, the daily chart is not as pristine as it was from October to now because we have made a lower low verses late December-to-early-January

Intermediate term control: BALANCE—we have a near-perfect bell curve intermediate term.  It is 87.5 points in range with a VPOC at 3494, which is slightly below the midpoint at 3498.

Short term control: buyers—buyers were able to get price back above the 33ema and hold value within the higher print.  This can be seen on the following chart, where the last two days of market action migrated value higher:

NQ__VolumeProfile_02032014

Overnight control: BALANCE with a slight seller edge—we have printed a bell curve overnight.  The sellers had a slightly better rotation factor then buyers.

Net of all of this context, you can see there is a power struggle going on, with balance dominating the conversation.  Thus we must monitor intermediate term balance.  The open is key too. It can give us early cues of who is in control on the day.  Is it two-timeframe action, back and forth, or do we see a strong drive from the long term buyer control?  Or does the seller come in and drive lower for an hour, reasserting their control on the intermediate term?

The key, in my opinion, is velocity of price movement, and the following value and its relevant levels:

NQ__VolumeProfile_02032014_INTERMEDIATE_TERM-2


Comments »

High Volume Selling Overnight

Good morning, good morning, here we are, another month end.  Michigan is showing early signs of snapping its cold spell after setting an all time snow record in January.  Bravo, mother nature.

We have lower equity index prices overnight, ahead of some important premarket economic numbers.  I have very simple expectations for today, and should they occur, I will ride into the weekend full long, malted liquor in hand.  My expectation on the day is for a higher lower verses Wednesday.  If higher low, then press, else begin reducing exposure.  This last sentence is much like how I communicate with robots.

We are currently set to open out of value, out of range in the NASDAQ futures which printed over 40 handles of range on above average volume.  This creates a high risk/high reward environment which fits well into the context of our road map.

The month end framework fits well into our road map, too, because often you hear bears groan about “afternoon markup” on the last day.  A late day rally would put a bow on everything we have mapped out this week.

There is no decisive balance overnight, but value never managed to follow price down and is still set at 3510 on the overnight profile.

Price is coiling ahead of our 8:30am information leading me to believe the market finds the news to be important and is waiting before making its next move, thus some of what I write now may become void.

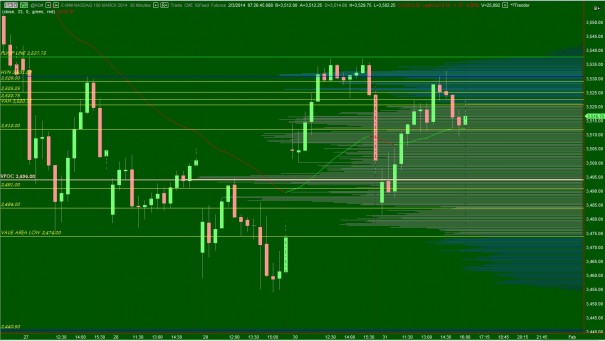
Thus, I will offer out my finest price levels, for your viewing pleasure, on the following intermediate term composite chart:

NQ__VolumeProfile_01312014_INTERMEDIATE_TERM

Comments »