iBankCoin
Home / Tag Archives: $NQ_F (page 35)

Tag Archives: $NQ_F

Hunting Aversion

Market activity picked up overnight.  We are certainly seeing signs in this marketplace that the big hands have come back to work, and their actions are jerking price about.  The market has been in a rather benign drift for many weeks, but business is clearly becoming more pressing as the year ramps up.

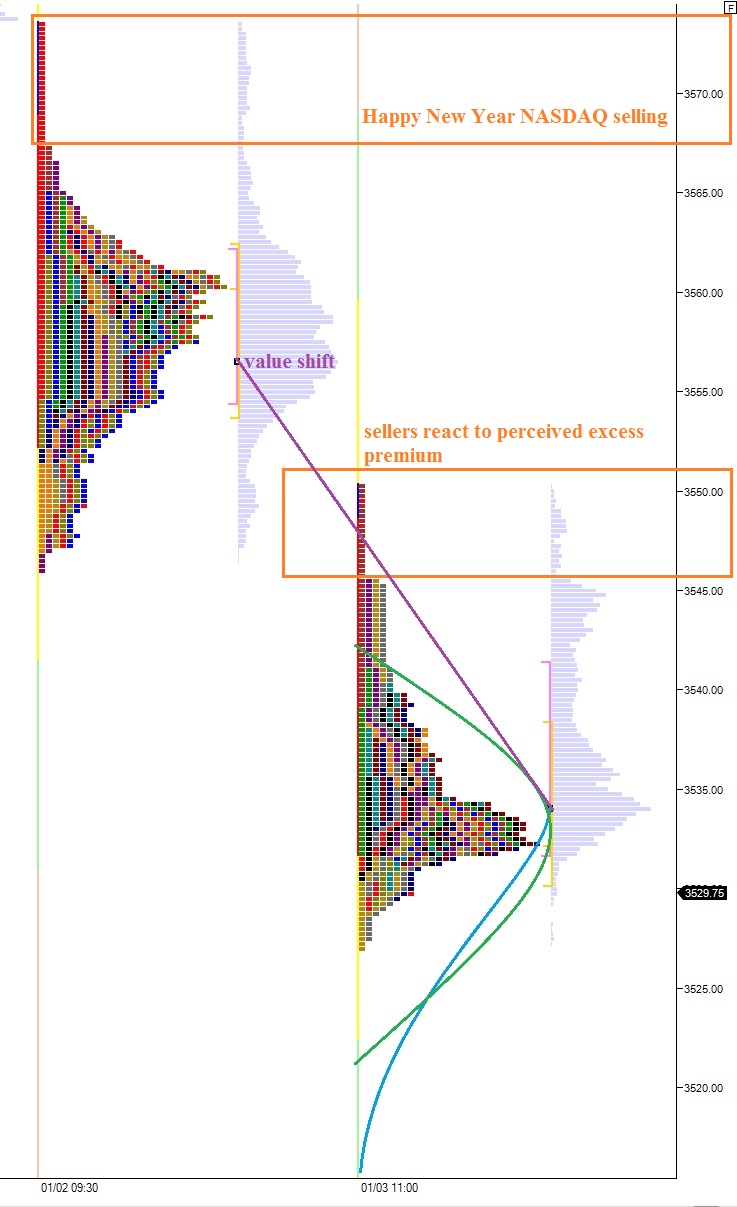
Yesterday, we saw an aggressive seller enter the NASDAQ in the afternoon.  Their action was dynamic and fast.  The sell flow was quickly reacted upon by eager dip buy orders, and if I have a clear read on sentiment here, I can see the case for dip buying.

We are currently trading outside of yesterday’s range meaning we are coming into an elevated risk/reward environment.  Your losers will press harder into your pocket, as will your winners.  Tight stops will be obliterated, and exuding a gentleman’s patience will be paramount today. 

Pick your spots and let the market come to you because there will be an added velocity to price today which may carry the market well through your desired entry point. 

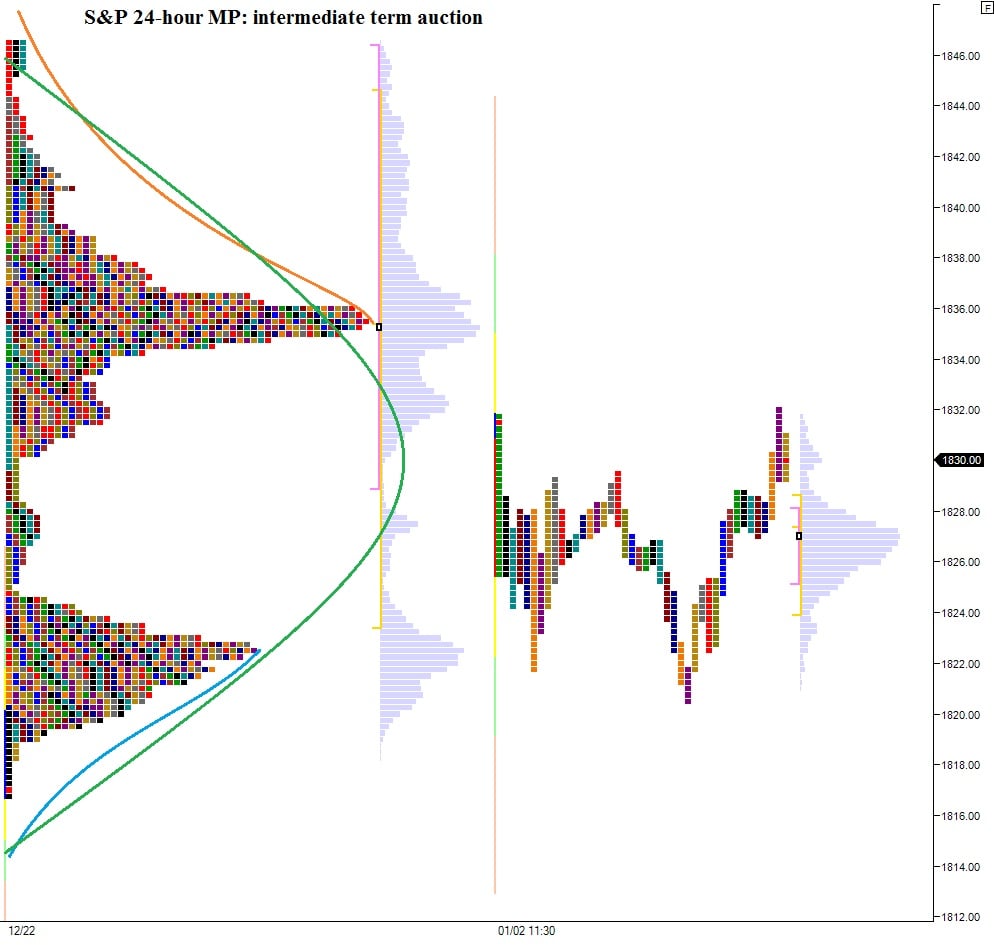
Long term the buyers are firmly in control, intermediate term there is balance, yesterday was dominated early on by buyers and again late in the day with their aggressive reaction to lower prices.  Overnight buyers were in control.

It will be important today to understand which timeframe is active.  My expectation is for the intermediate-term timeframe to be prominent because of the aggressive sell flow that began yesterday afternoon and also because they are reacting premarket to higher prices.

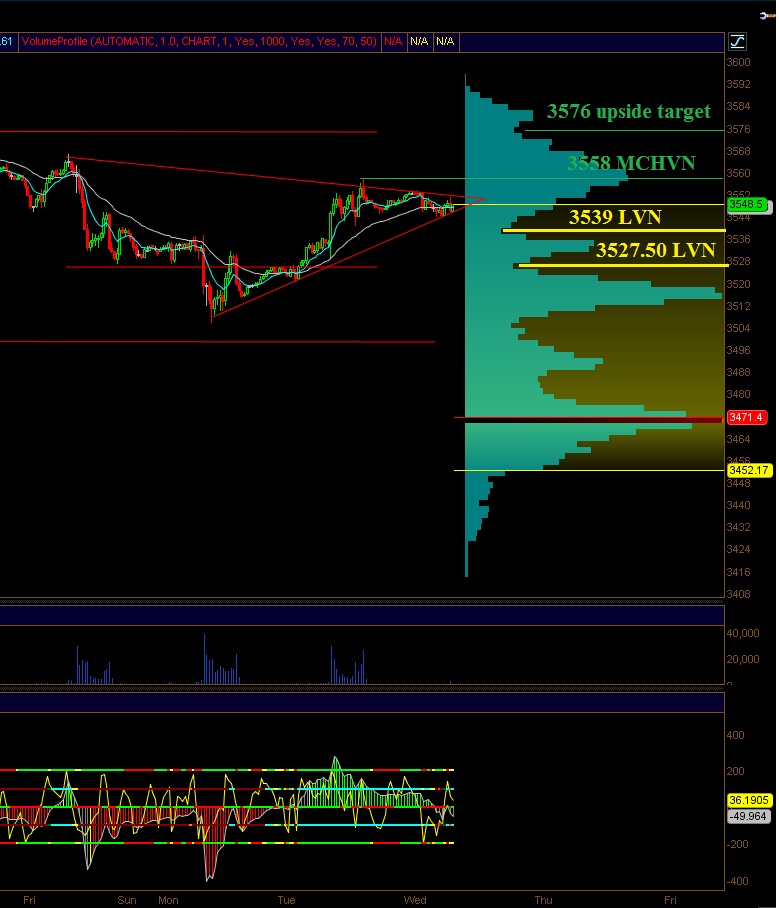
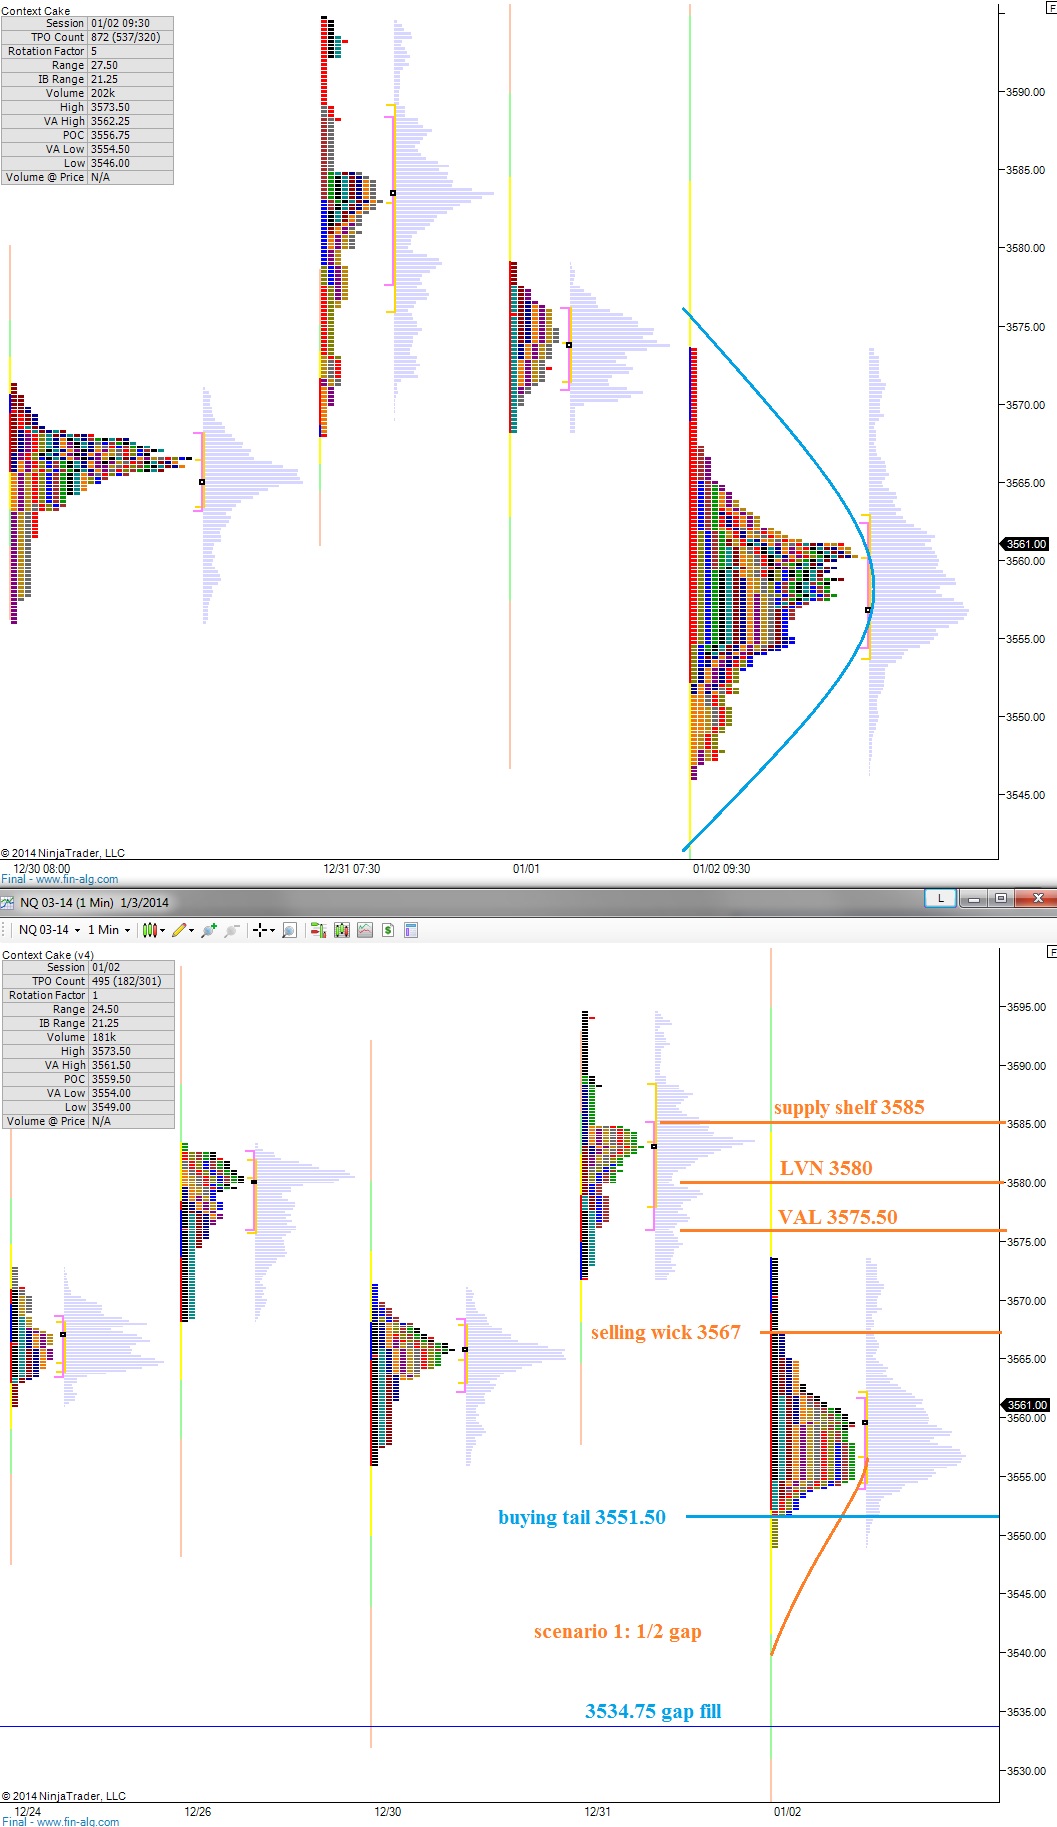
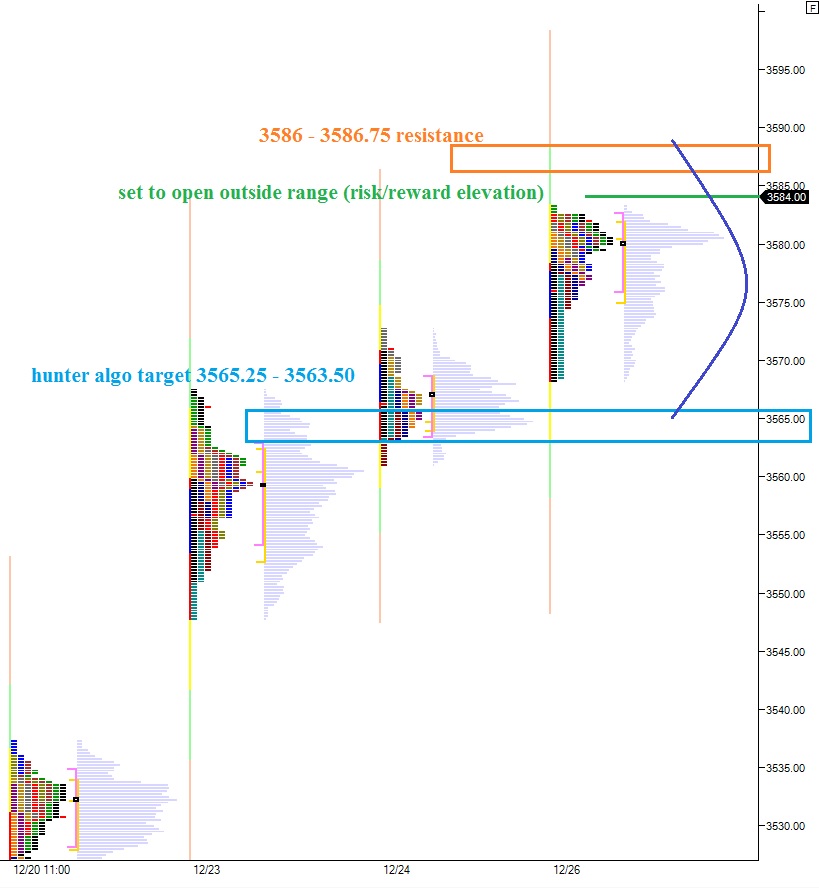
I will be looking for an overnight gap fill early on down to 3564.50.  Below this level is a thick layer of volume for the market to work through.  Should we see sellers pressing a second rotation, they will be seeking downside targets to 3551.75 then 3546.25.  Keep in mind however, trading as low as 3536 is possible today, and would fit the framework of “aversion” context.  That is to say, the intermediate term balancing process is a violent one and it is best to pick a side and stick with it, especially near extremes.

I have highlighted these levels on the following volume profile chart:

NQ_VolumeProfile_01092014

Comments »

Price Action Tightening Up

Overnight we printed a balanced session of trade into 8:30am, where the markets appear to be catching a slight bid. Overall we are mostly unchanged across the board.

The opening action yesterday whispered of long timeframe activity, where aggressive buyers came in and disregarded day timeframe price zones. Thus although the Think or Swim volume-at-price is highly inaccurate, it proved sufficient for measuring intermediate term activity.

Sticking with the intermediate term, and by no means is it my choice, I again turn your attention to the Think or Swim platform, where the NASDAQ futures are working through a consolidation pattern with some interesting volume reference points to gauge market sentiment upon:

NQ_01082014

My first vision is for resolution of this consolidation. I would like to see sellers push off the open, perhaps down to the 3539 LVN, where I will look for signs of buyers. If they are not present, a second thrust lower to 3527.50 may be in order.

Ideally, this weakness is met with aggressive/reactive rejection from buyers which propels us up above the highlighted consolidation formation.
My second vision is a slow grind over the MCHVN at 3558 and over the top of this distribution to my upside target of 3576.

Comments »

The Show Must Go On

I want to apologize to my reading audience for building a set of tools reliant upon one third party.  Mirus futures updated their API and since then there data connection to NinjaTrader has been patchy at best and often down entirely.  They are failing, repeatedly, to stabilize their relationship. 

Due to inclement weather, the staff at IQ feed are very slowly working to get my data stream online.  Unfortunately, I will not be using this data to feed my market profile charts, but instead to feed my algorithms which no doubt will need to be almost entirely rebuilt based upon the new data.

In the meantime, we need some kind of vision for the day, some sort of lens to view price action through to ensure nothing is afoot.  You know the market, it wants to catch you sleeping so it can cut your ear off and feed it to its Van goats.

The equity markets have rotated higher overnight, with the NASDAQ composite flaring open a gap down to 3518.50.  The width of this gap is not quite of the “pro” variety meaning we should expect to see an attempt by sellers to fade the gap fill.  This piece of sentiment alone does not mean sell the opening print, but instead look for a logical price level where we may expect to see sellers. 

We have a volume void up above on the /NQ.  My expectation is for buyers to press into this void but find sellers, either around 3540 or 3545.  From there I will look for a rotation down to 3527.50.  If buyers are not present at these levels then a swift push down to the gap fill 3518.50 is in order.

I have highlighted these levels on the following 30 minute TOS chart.  Note: I have always questioned the integrity of future’s data presented on Think or Swim.  Thus these are very rough estimates, especially in regard to volume-at-price.

NQ_01072014


Comments »

Intermarket Analysis

USA indices are up slightly during the globex session, despite notable weakness in the Asian markets. The NASDAQ continues to lag the S&P, The Dow, and the Russell index.

The sell flow which entered the market last week was strongest in the NASDAQ where sellers can clearly be seen reacting to perceived premiums. Their actions in the market were dynamic enough to leave selling wicks on the market profiles and also effective in driving value lower. The 24-hour profile shows this action mostly clearly, with selling wicks clear. I have highlighted these wicks, as well as two scenarios I envision for today’s trade in the /NQ_F, our futures contract for tracking the NASDAQ:

NQ_MarketProfile_01062014

It is important, especially if you are participating in the financials trade, to keep an eye on the intermediate-term balance in the S&P 500. I have highlighted this balance on the following /ES_F chart, our futures contract for tracking the S&P 500. We can monitor the price action near these balance extremes to gauge if other time frame (long time frame) participants are increasing activity in our market. Note: they “should” be more active, as the holiday trading season comes to an end:

ES_MarketProfile_01062014_intermediateterm

Comments »

Intermediate Term Focus

December 20th was a big day on the S&P 500 (aka $SPX aka /ES_F) where price extended upon the large trend day only two days prior. The events of December 20th set the stage for a holiday drift of benevolent proportions.

Then yesterday came and we erased the entire drift in one foul swoop. Or did we?
The balancing process is an interesting natural phenomenon driven by the collective actions of all market participants. Yesterday the sellers were in control but intermediate term we are working through a balance.

This balancing event is occurring at very elevated prices which should bring the trader a bit of caution for continued liquidation. I compressed the balancing action into one profile this morning on the S&P 500 because the resulting picture is rather interesting and gives us a solid bit of context to frame our minds around. Put simply, we’re stuck between two humps…until we aren’t:

ES_MarketProfile_01032014_intermediateterm

Overnight our range was larger than recent past where the action has been benign. Sellers could be seen early in the evening beating price lower at 1829 and producing a wonderful rotation down to 1820.50. This is where we can see the intermediate term balance/auction come into control—buyers defended the price zone and their demand was strong enough to propel price a tick above yesterday’s RTH range.

The bad news for bulls is we typically do not set swing high/low during the overnight session. Thus the downside is vulnerable. The good news is we are seeing healthy market activity and participation by both parties.

I have highlighted a few levels I will be keying off of in the NASDAQ today on the following market profile charts:

NQ_MarketProfile_01032014

Comments »

A Fresh Batch of Context

We are starting the year off with an interesting bit of context in place.  The long term control of the bull was reasserted last week, fueled by strong buying demand that entered the market when The Fed removed uncertainty over their taper itinerary. 

Intermediate term, looking at the last few sessions, we have begun the process of balancing out up at annual highs.  We were yet to see any sharp rejection.  Instead price has drifted with a slight bullish bias through the holiday season.  Within this low volume drift environment, individual equities have performed well.

Tuesday, year end, was a day controlled by the buyers, and showed signs of control both from the long timeframe and the day timeframe where local traders appear to have actively participated at value area low, a logical level to see their participation.

Overnight we gapped lower and initially the action is being met with buying.  The move was dynamic enough to print nearly 10 handles lower on the S&P futures (/ES) and nearly 20 handles on the NASDAQ futures (/NQ).  This is pro gap territory where attempting to fade the sell flow and press the gap shut becomes a more risky endeavor.

However, we are still trading within Tuesday’s range, just a few points below the value area.  If price can creep above 3577.50 before the opening bell, it would indicate we are back into Tuesday’s balance, and the move has been accepted.  Should we open below this level, we need to be keen to the open type and who may be asserting control.

Should the sellers reject any attempts back into Tuesday’s value, we may begin liquidating early on.  I will look for buyers to react at 3563 and then at the support zone highlighted below.

Overall I anticipate balanced trade may ensue, but should my support zones void I am prepared for a liquidation tape, especially given the extended nature of the market.

NQ_MarketProfile_01022014


Comments »

Year End Context Profile

The premarket is seeing buy flow entering the market, albeit thin, as the USA comes online. The action was enough to push us outside of value and nearly above yesterday’s range. This creates an elevated risk/reward environment where intraday positions have a better opportunity to flourish.

Given the proximity of the overnight gap, we may see sellers attempting to fill it by trading us back down to 3566.75. If this is to occur, I think the time of day is critical. An early push from the sellers which gets rejected by buying would set the stage for a strong session.

If instead we see a mixed opening trade, predominately driven by buyers, we have to be on watch for an afternoon fade.

I have highlighted both these scenarios on the following 24-hour market profile chart. Below the 24-hour chart is the RTH chart which I have left blank but you can see the relevant value areas on high volume nodes, especially if you click and enlarge the image:

NQ_MarketProfile_12312013

Comments »

Making Lemonade

One of the greatest weaknesses of elder generations is their resistance to change. Perhaps in their younger, scrappier years they would take changes in stride while walking two miles in the snow to school. But with the routine comes comfort and stubbornness. Eventually obsolescence sets in.

With that in mind, I will not damn my future’s platform for completing a major update over the weekend, an update so grand it succeeded in killing all of my helper robots (algorithms). Instead I simply await word from my team of scientists and engineers working around the clock to integrate the new technology into my platform.

Unfortunate for me, this means I will be trading “VFR” today. Unfortunate for you, my morning market analysis will be a bit lacking today.
You will have to look up a daily chart on your own to see Friday’s trade printed an outside day in the NASDAQ composite meaning we exceeded Thursday’s high and low during the Friday session. These type of prints signal indecision and suggest the violent act of balance is beginning.

From here three things can happen. The market can reject the idea of balancing due to strong demand for stocks. This would propel us higher and away from the Thursday/Friday range. The opposite can occur to the downside due to a flood of supply entering the marketplace. The third is the balancing dance, much like the courting rituals of a finch—jumpy, choppy, and everyone gets horny at the extremes before getting faded.

I have highlighted key market profile notes on the following charts with the caveat that Friday’s data has been vaporized and is not presented below:

NQ_MarketProfile_12302013

Comments »

The Flow of Profit Taking

The markets engaged a one directional drift this week after news of a The Fed tapering on December 18th reignited the spirit of the long term directional control—the bull.  As the [Santa] rally has progressed we start to see the marketplace working into equilibrium.  This process can be seen as overlapping price action.  As our balance establishes further it will be seen as overlapping value areas.

These prints are the result of sell orders entering the market with a force equal to and at times greater than the force applied by buy orders.  As the rally ages, we eventually reach balance or see a sharp rejection lower by selling.

This has not occurred yet.  However, we may see profit taking start to kick in today ahead of the weekend.  This does not mean you should automatically take profit in your own portfolio, only that your plans should be assessed on individual stocks and consider taking profit or selling if your desired target has been achieved.

We also want to measure any downward move and whether it makes logical sense in the auction process, or whether we are seeing a shift in control away from the long term trend.  Should we see selling enter the market, my expectation is for algorithms to begin hunting stop orders.  This action could take price in the NASDAQ futures down to the support zone from 3565.25 – 3563.50.

I have highlighted this zone as well as a few other market profile thoughts on the following chart:

NQ_MarketProfile_12272013


Comments »

Morning NASDAQ Context

The globex market opened back up for business this morning at 6am and was greeted by an early bid which drove prices higher. In the short term we have become overbought and it will be interesting to see how these conditions are met as we approach regular trading hours.

Seeing price swing a fresh high in the premarket provides an interesting bit of context for bulls to hang their hat on, as the likelihood of making swing highs during non-cash trading hours is low. This type of context is not always actionable, however, as the mornings swing high cold hold for days and even perhaps weeks prior to being eclipsed. Therefore the premarket swing high is interesting from a context perspective, but not necessarily actionable from a timing perspective.

Price is currently trading entirely outside of Tuesday’s range suggesting we our coming into a market which is out of balance. This creates a higher risk/reward environment then a market opening in prior range.

Early on, my expectation is to see sell flow work into the market. On the NASDAQ, I am looking for order flow to take price back into Tuesday’s value and perhaps through our entire range, putting any newly initiated longs underwater. Sell stop hunter algorithms will be targeting 3558 – 3556. This price zone is just below Monday’s VPOC at 3560.50. The VPOC still stands naked after buyers reacted just above the level on Christmas eve.

Should we instead see buyers driving off the open, I will be testing their might verses 3580 -3580.50. If price is sustained above this level early on, it would be wise to avoid any fade or gap fill intraday shorts. A gap fill would take prices down to 3571. Given the close proximity of the gap, my expectation is for a fill to occur today.

I have highlighted a few of the levels on the following 24-hour market profile chart:

NQ_MarketProfile_12262013

Comments »