iBankCoin
Home / Tag Archives: $NQ_F (page 18)

Tag Archives: $NQ_F

Intestinal Fortitude

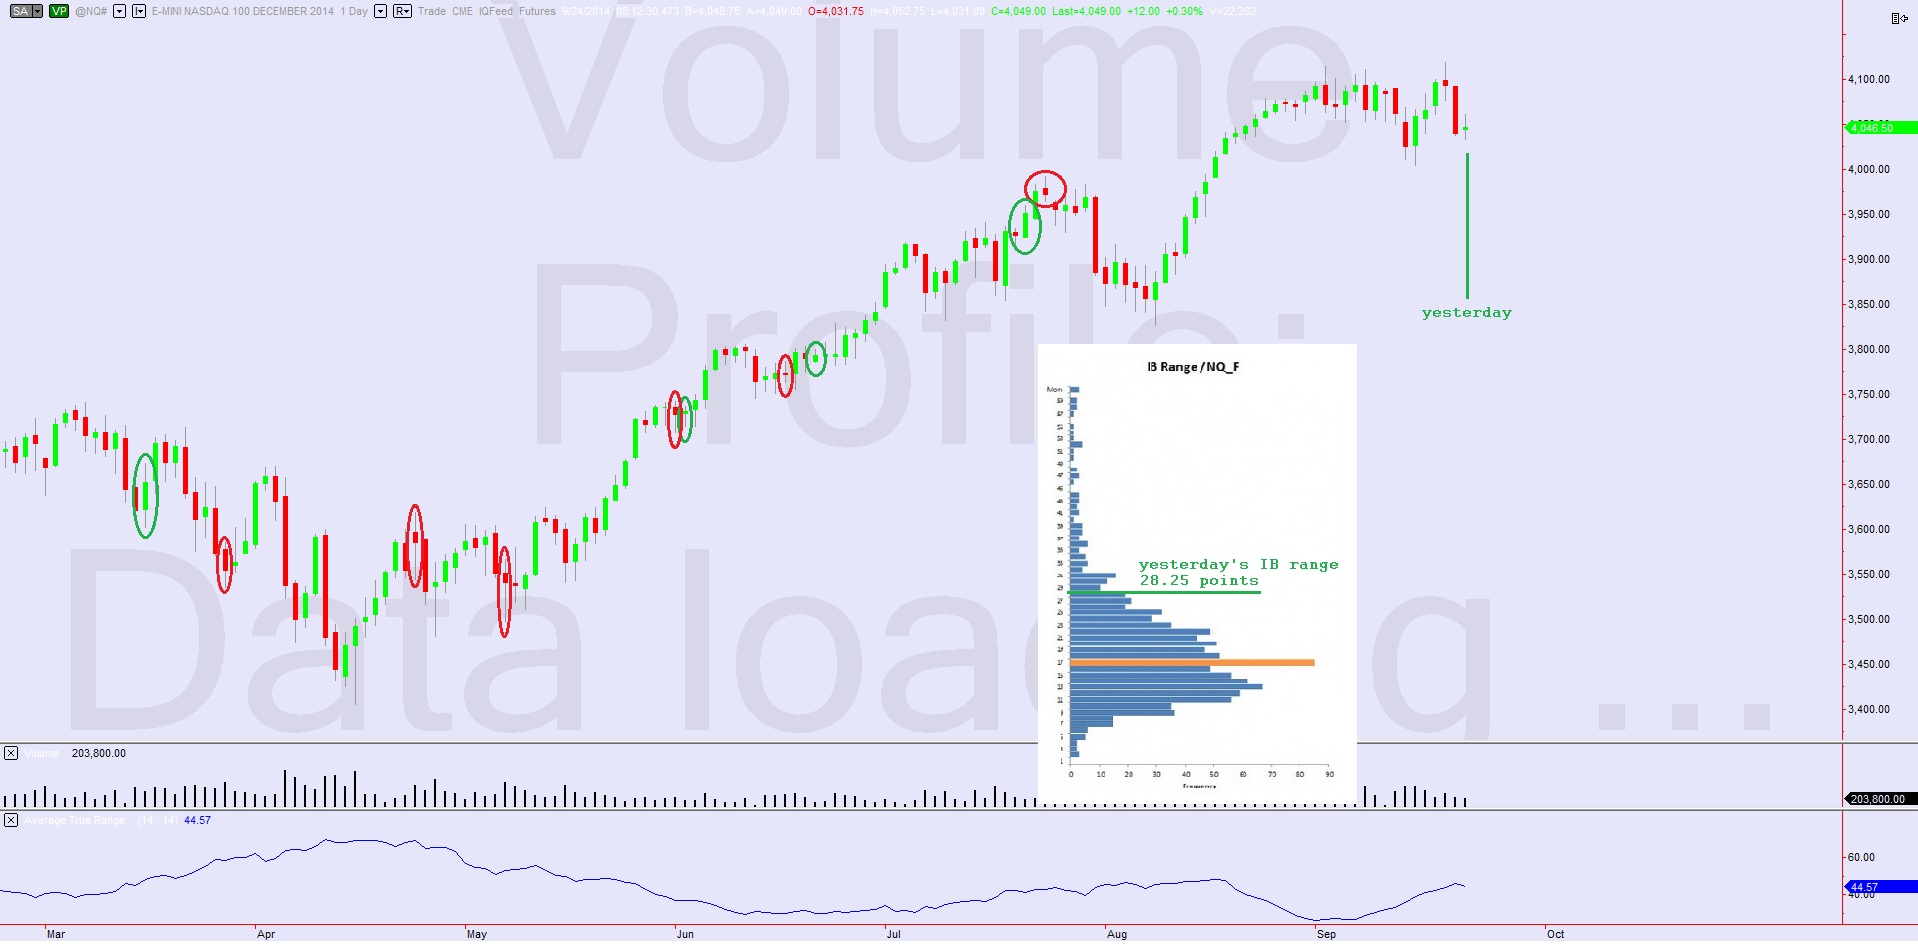
Nasdaq futures were already operating on slightly above average volume ahead of the 8:30am GPD release.  Prices were up ahead of the data and saw a slight selling reaction to the inline numbers.  There is also news of Bill Gross leaving Pimco for Janus Capital.  Since the news came out we have seen selling accelerate a bit and the news has also served as a disruption to the overall bond market.

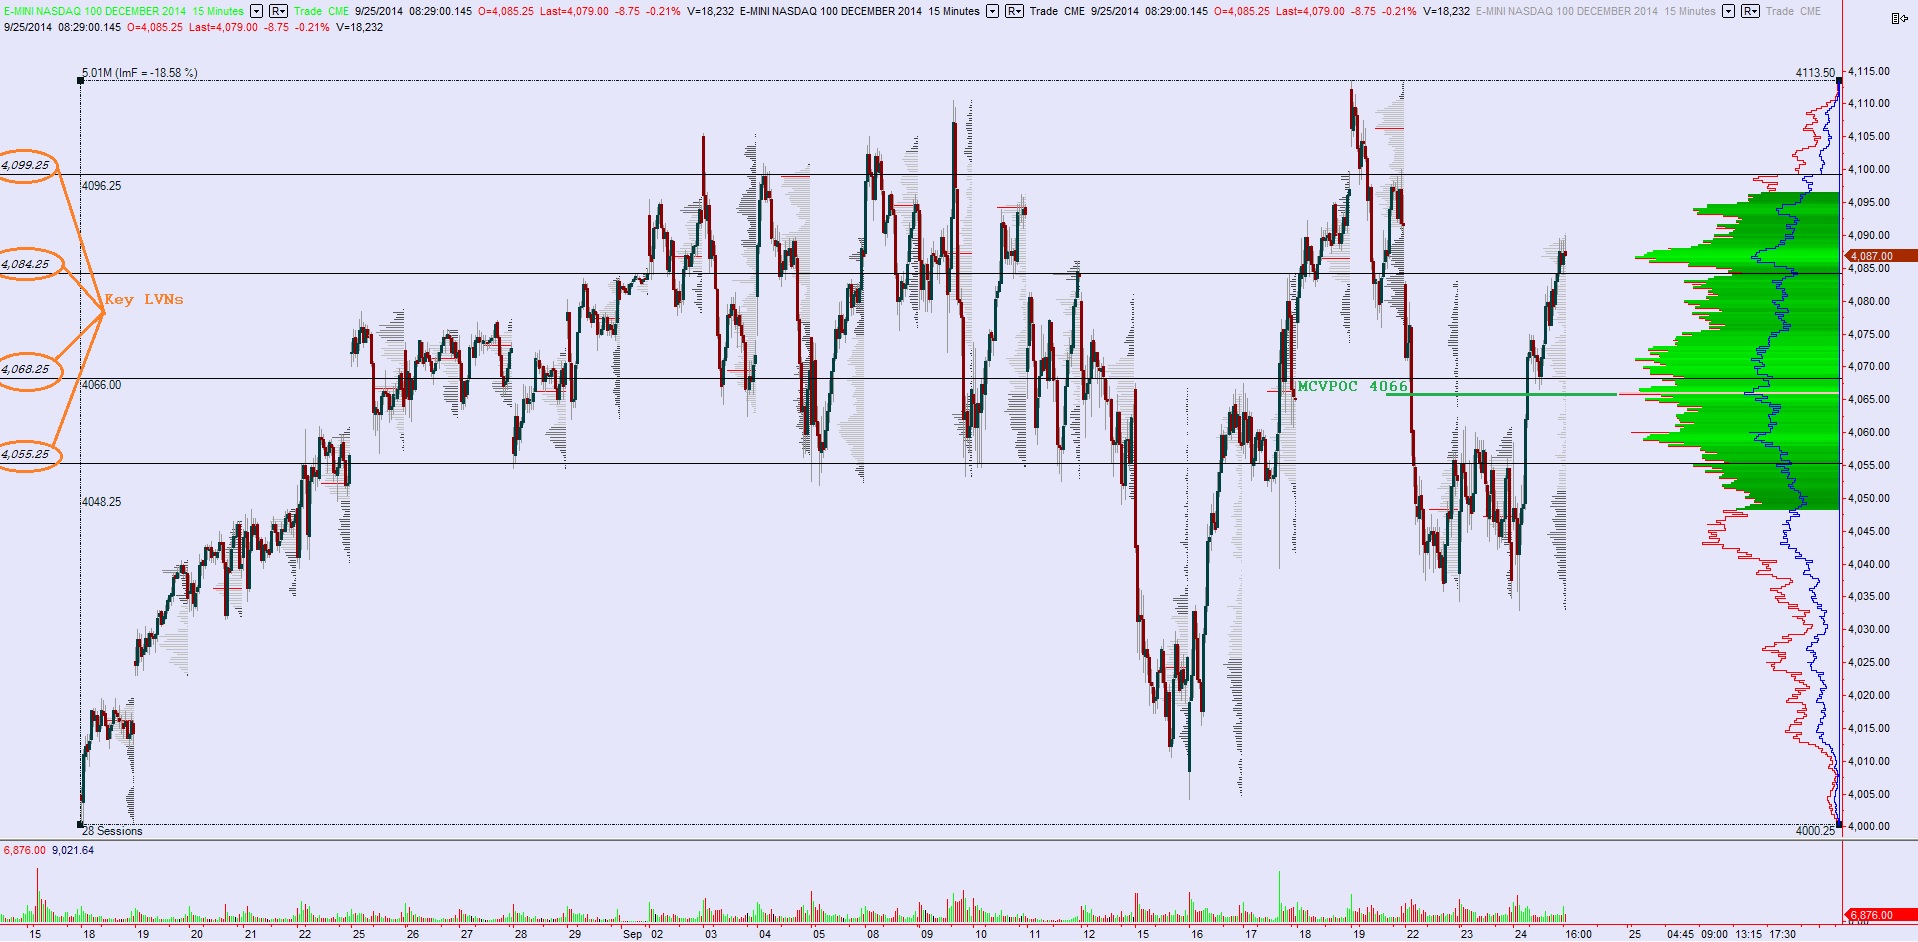
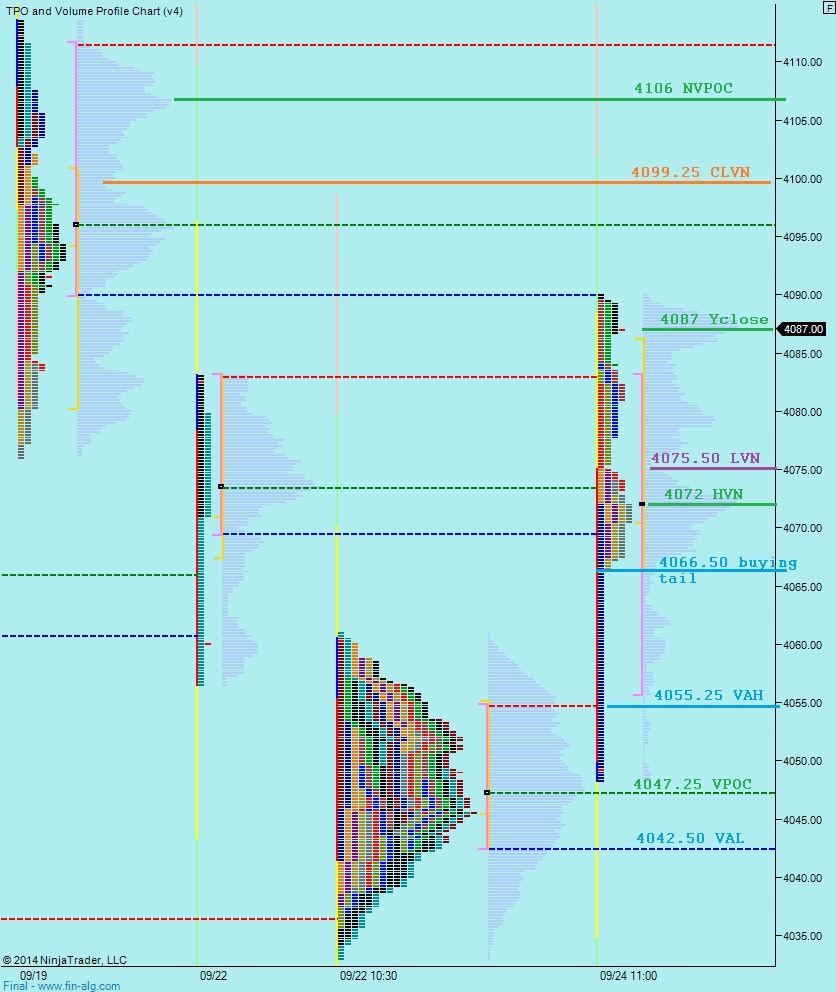
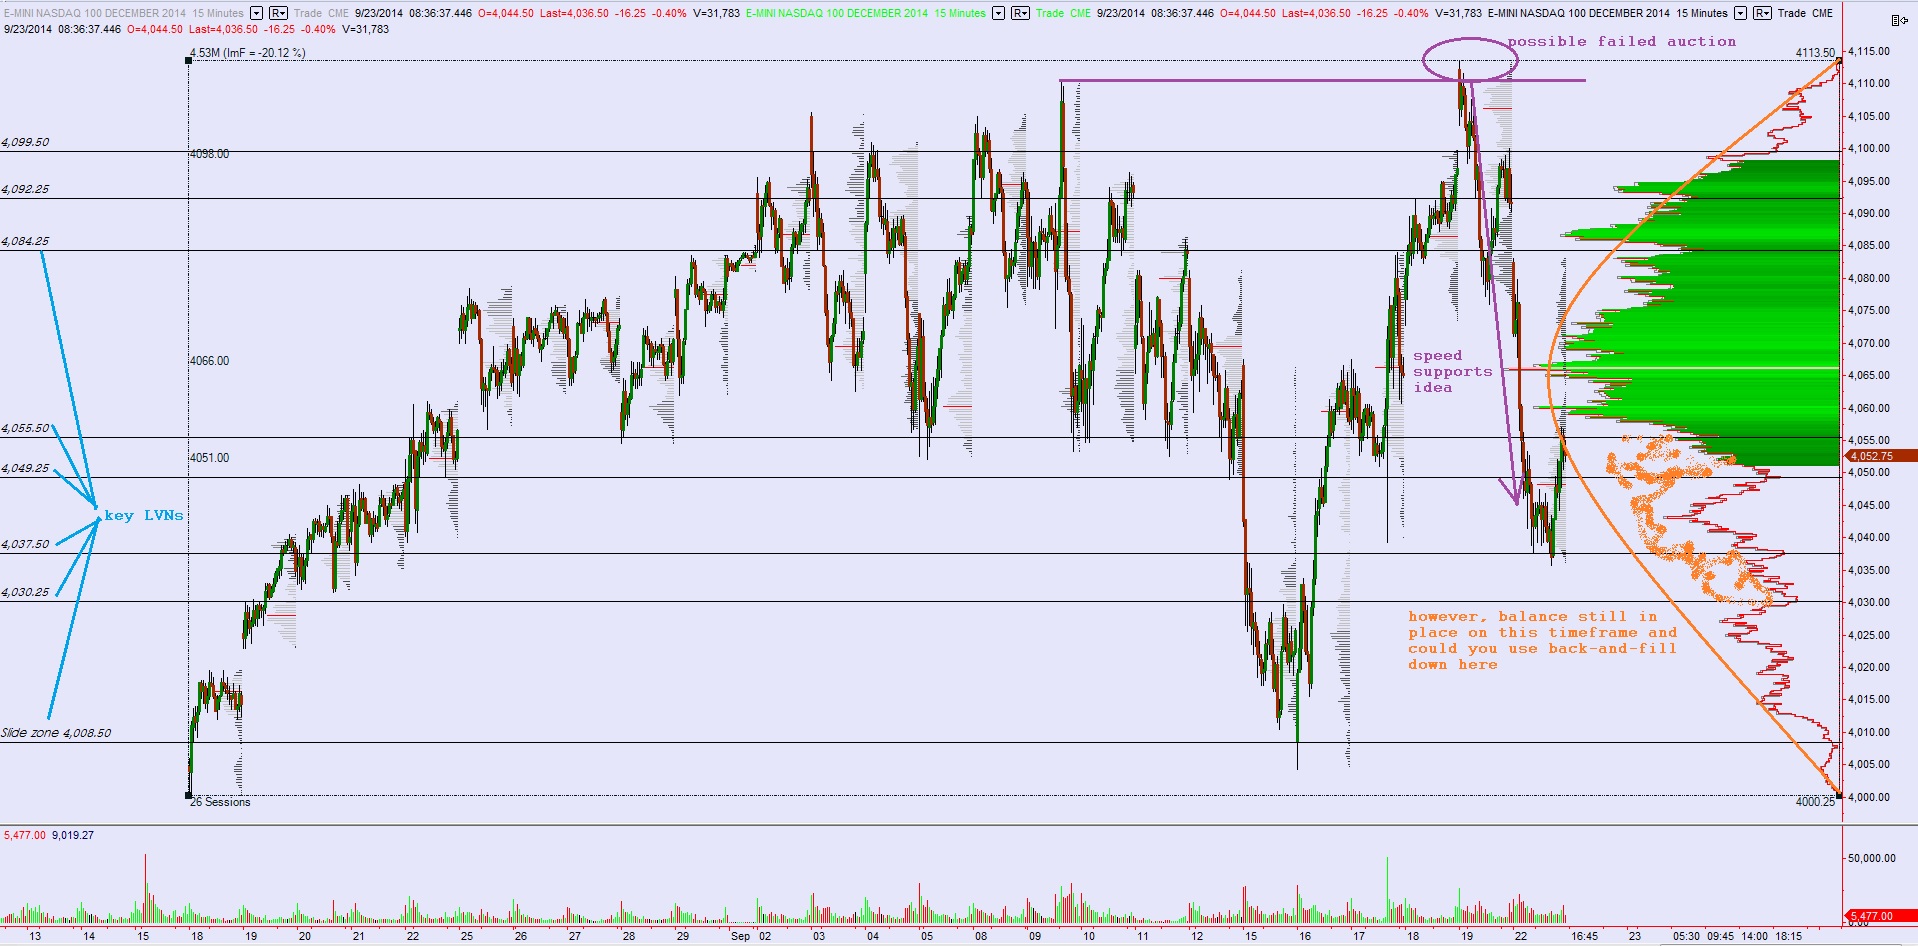
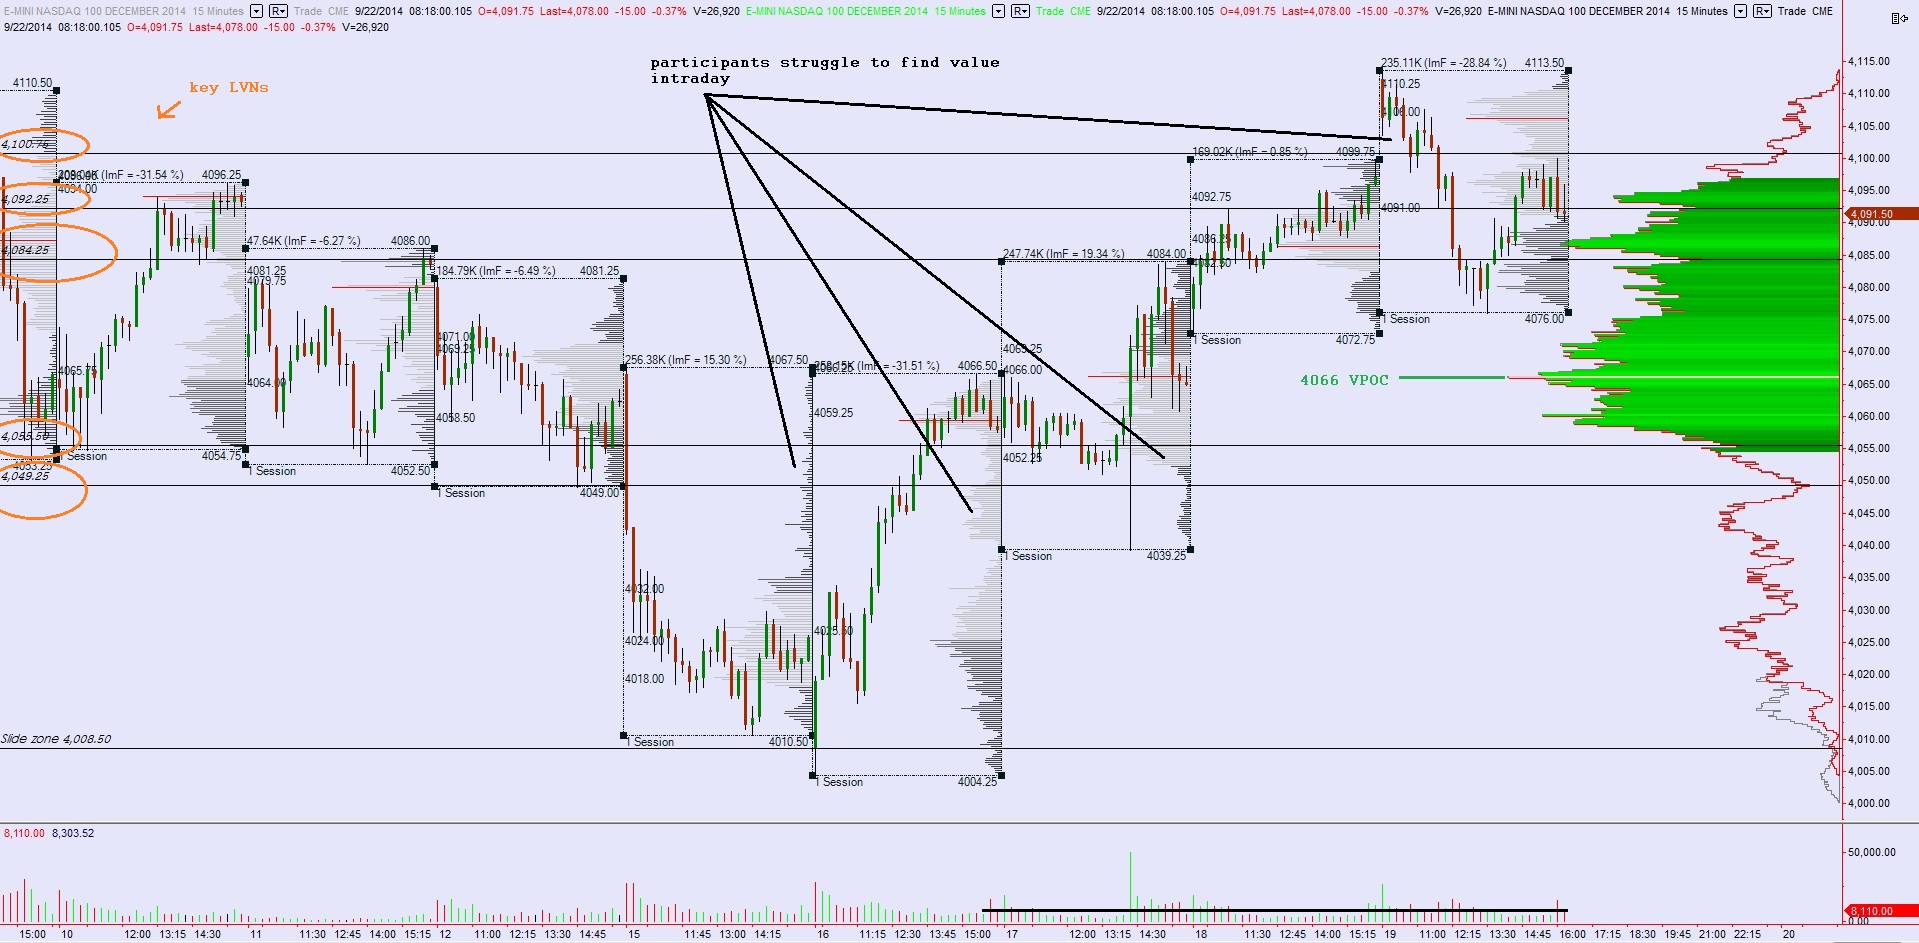
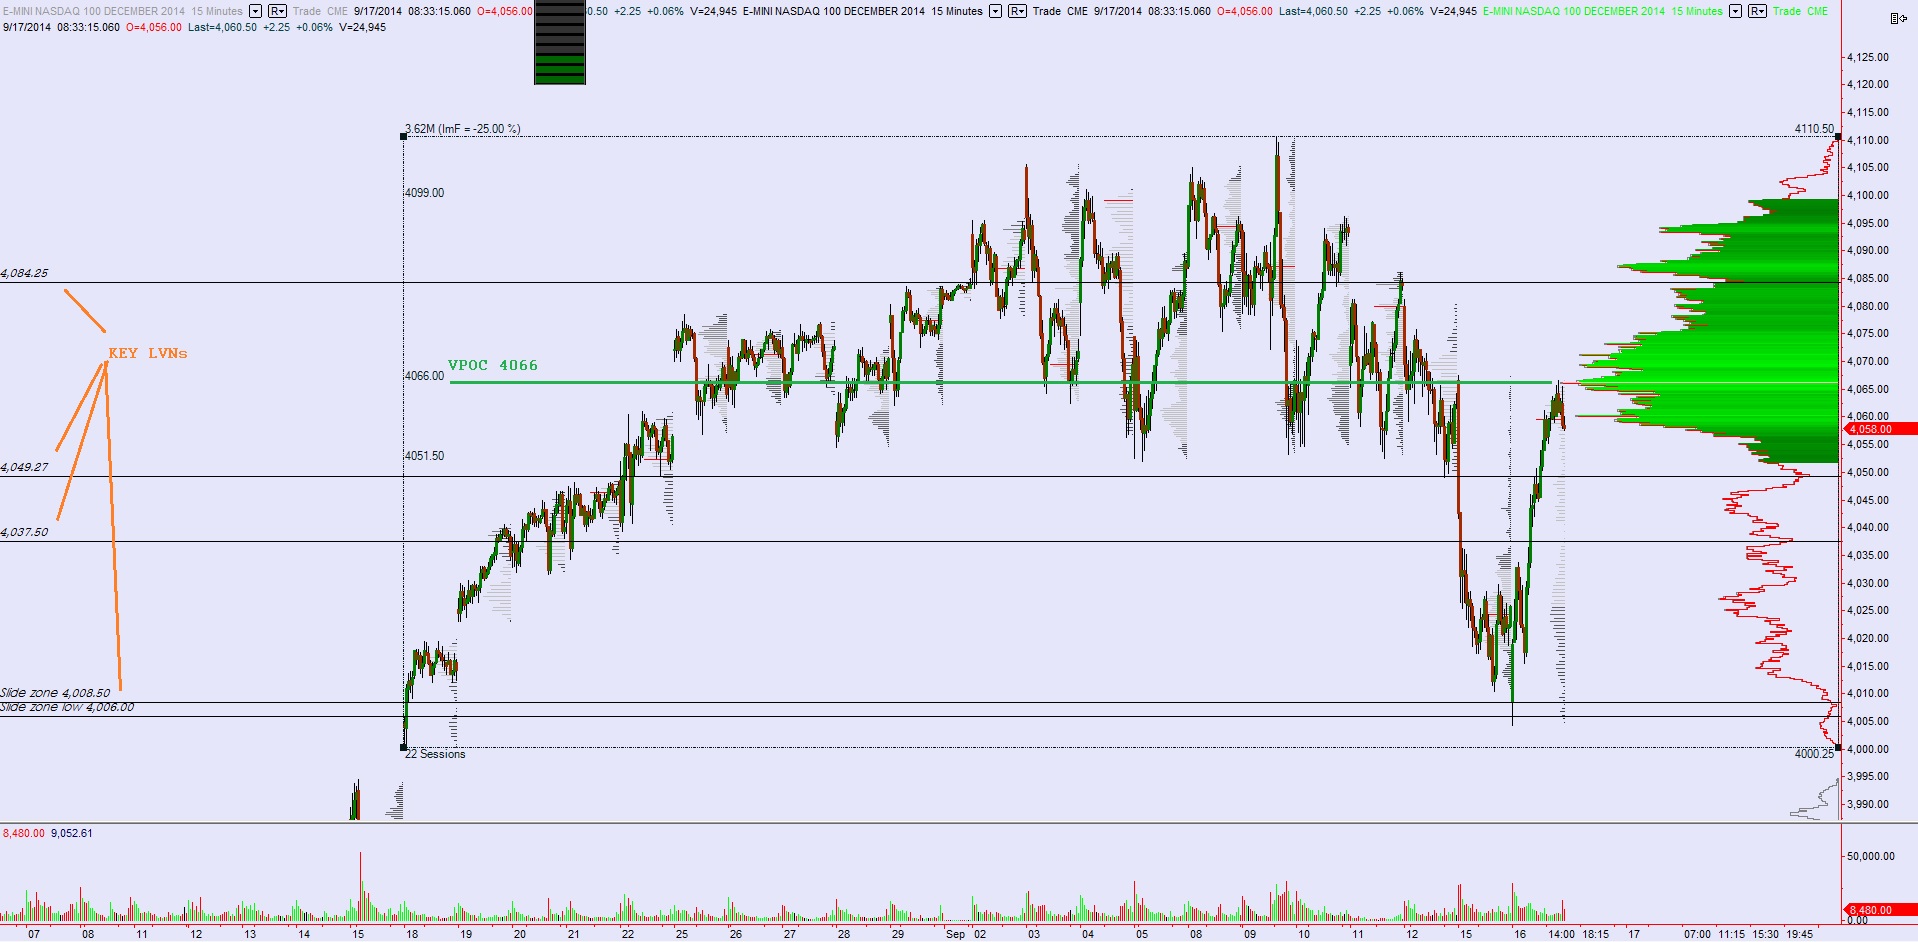
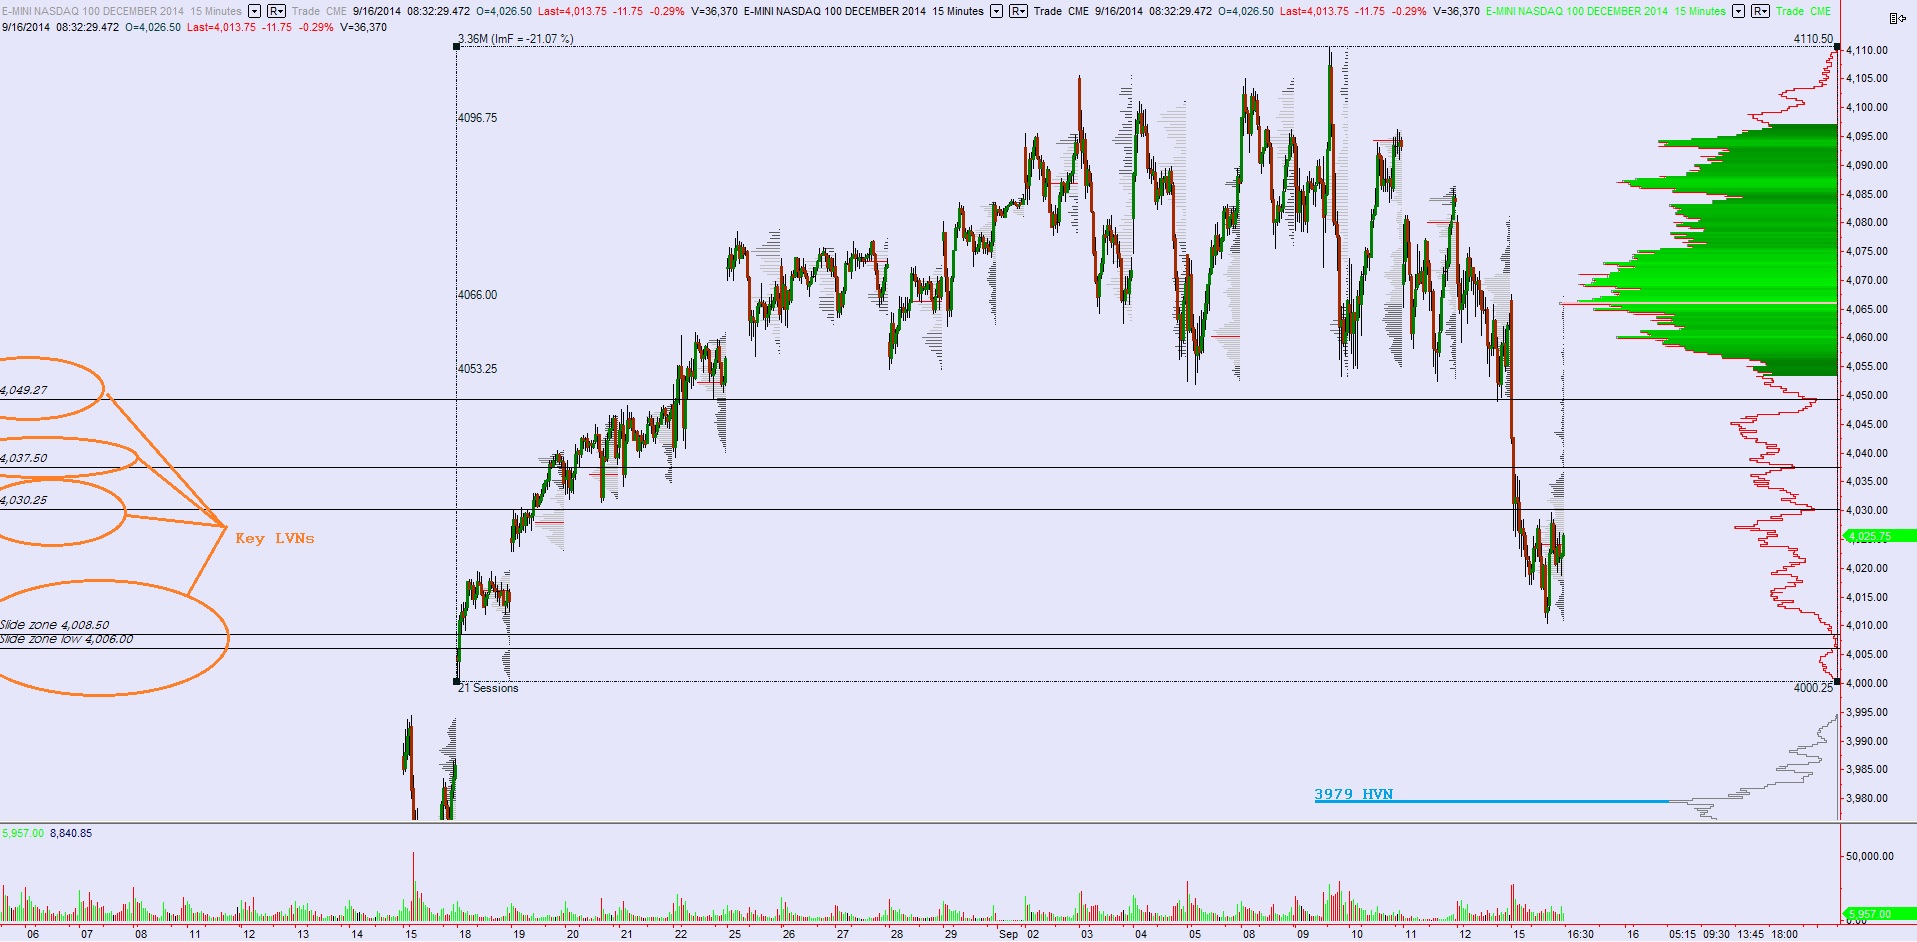
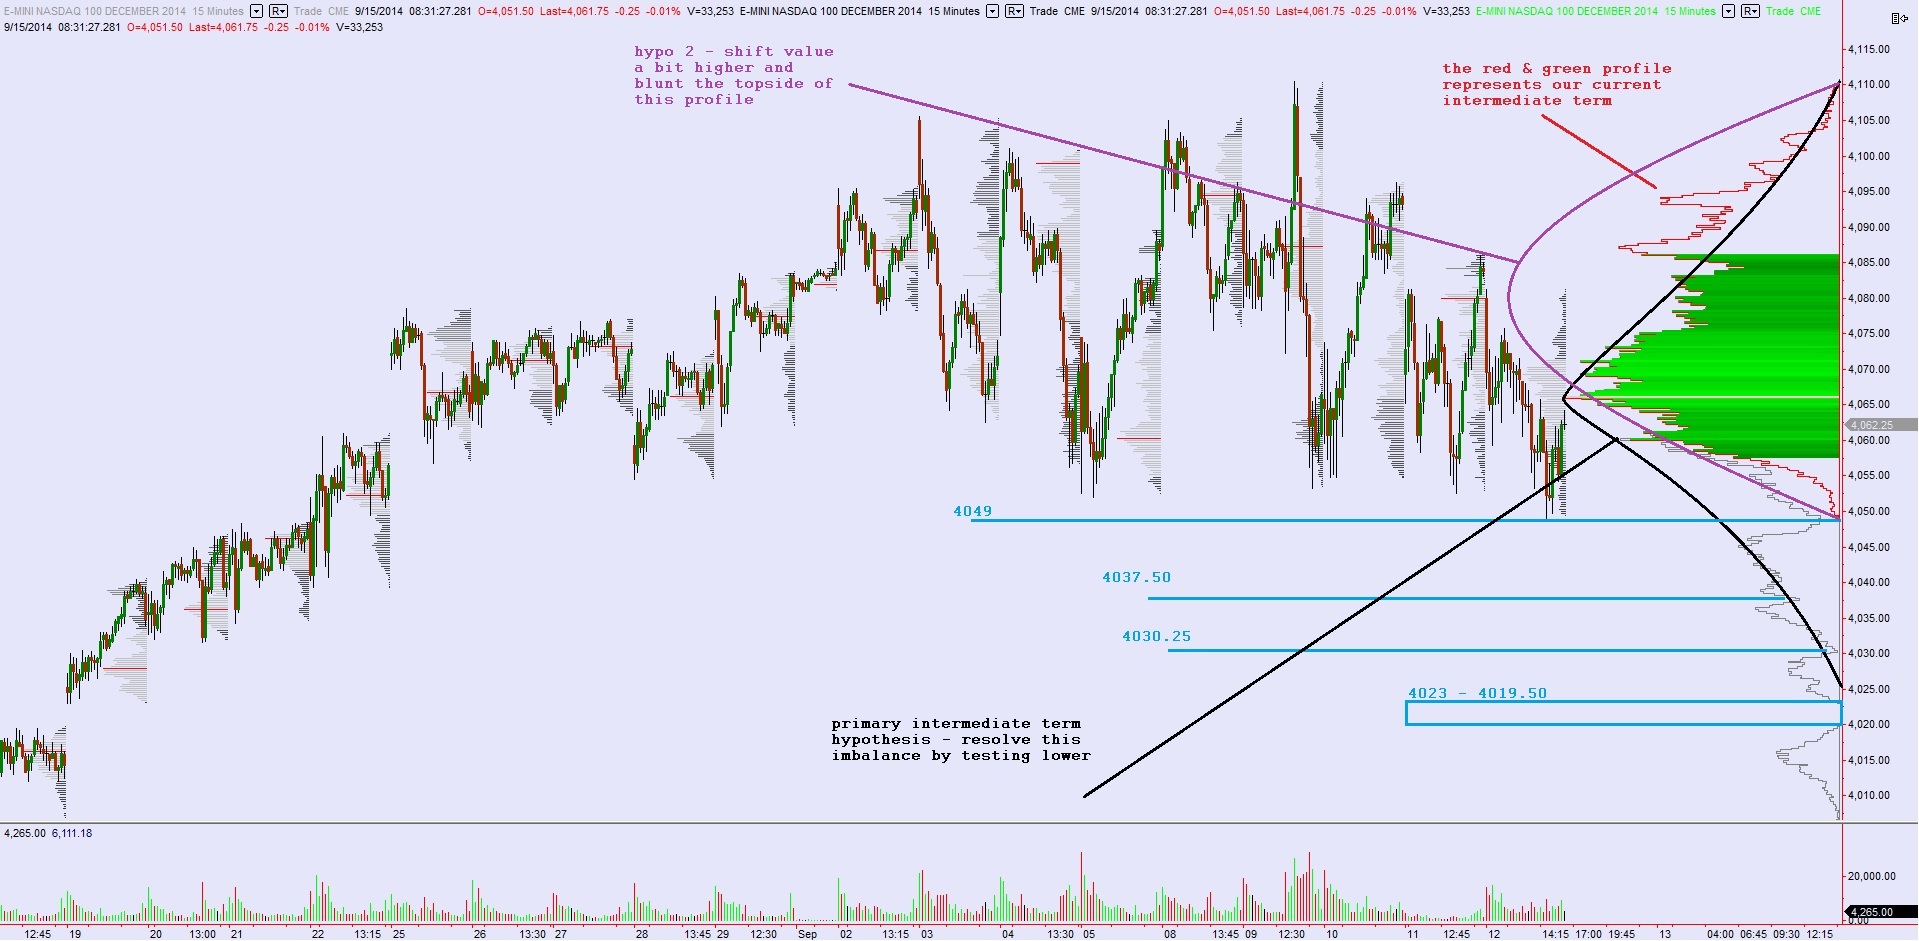
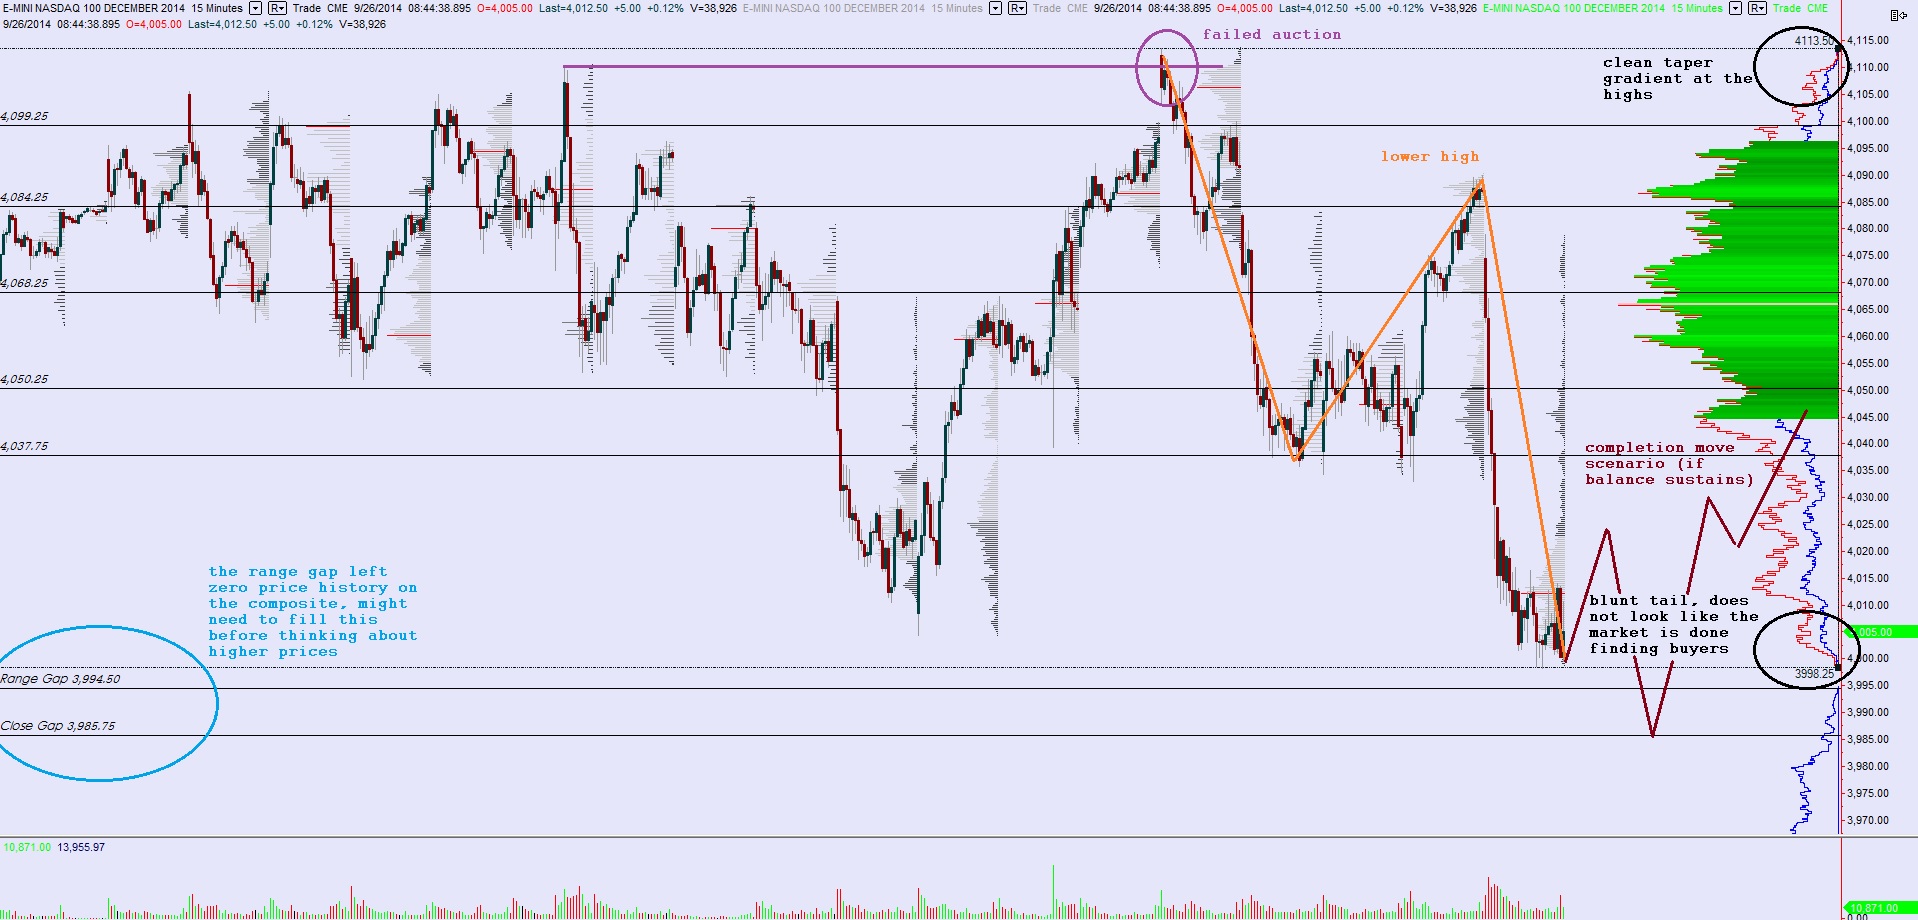
Yesterday the sellers made enough progress on the Nasdaq to call intermediate term balance into question.  The boundaries of intermediate term balance as well as any bracketed-type trade are always a bit grey, meaning you cannot assign a fixed price level to them.  Instead we can use volume profile to see if activity dries up as we enter the extreme territory.  Also of importance is the price action leading into the extreme.  This move lower started with a failed auction, an attempt to make new highs where activity quickly evaporated followed by a fast move in the opposite direction.  It then printed a lower high and lower low suggesting multiple day seller control.  This balance is going on 30 sessions old.  Once they become this mature the likelihood of leaving them to explore new prices is elevated.  In summary, we are at risk of starting a discovery process lower.  I have highlighted these observations and more on the following intermediate term market profile:
09262014_intterm_NQ

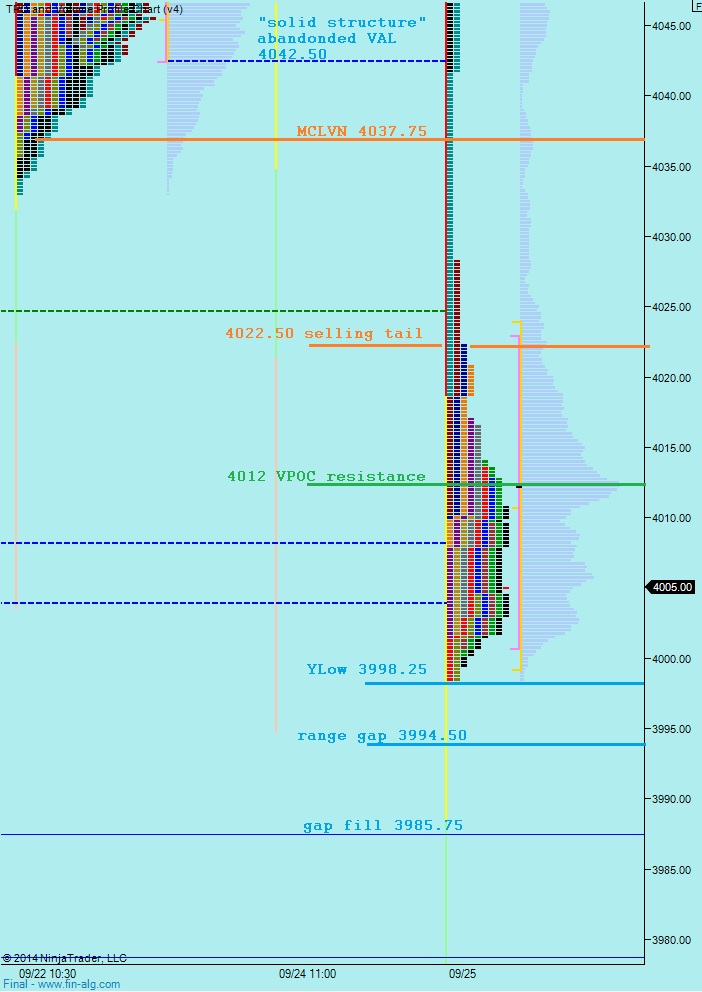
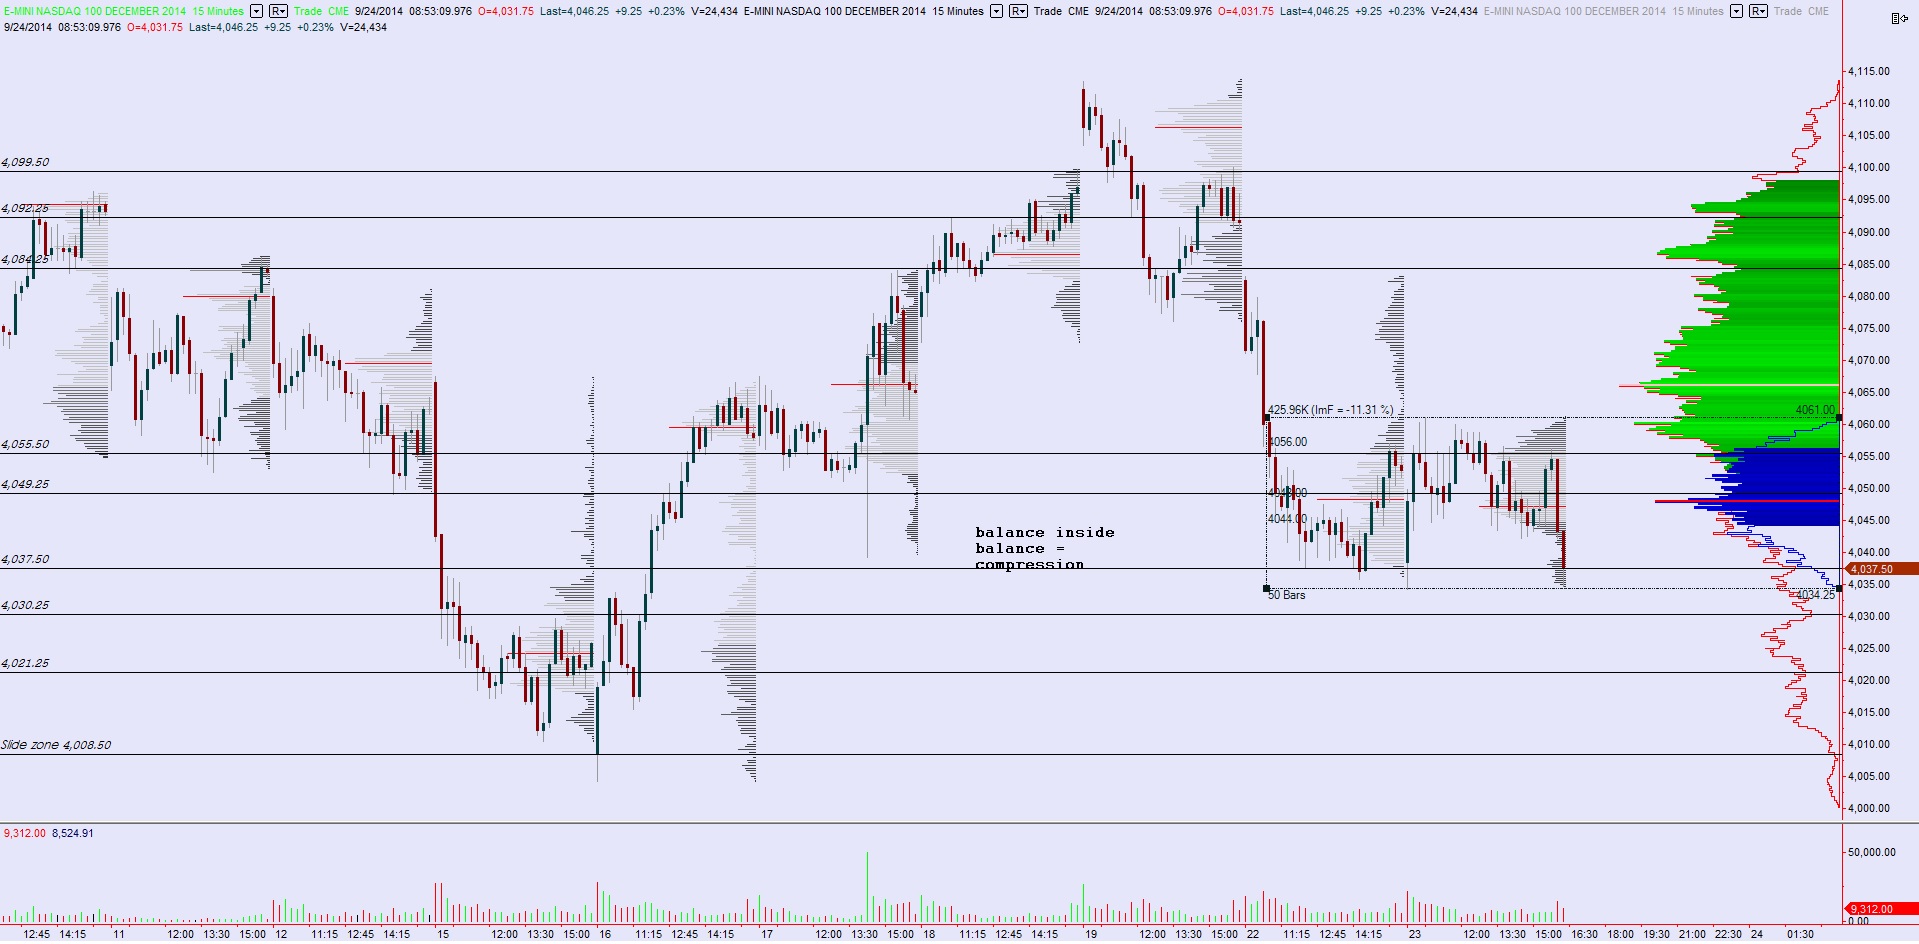
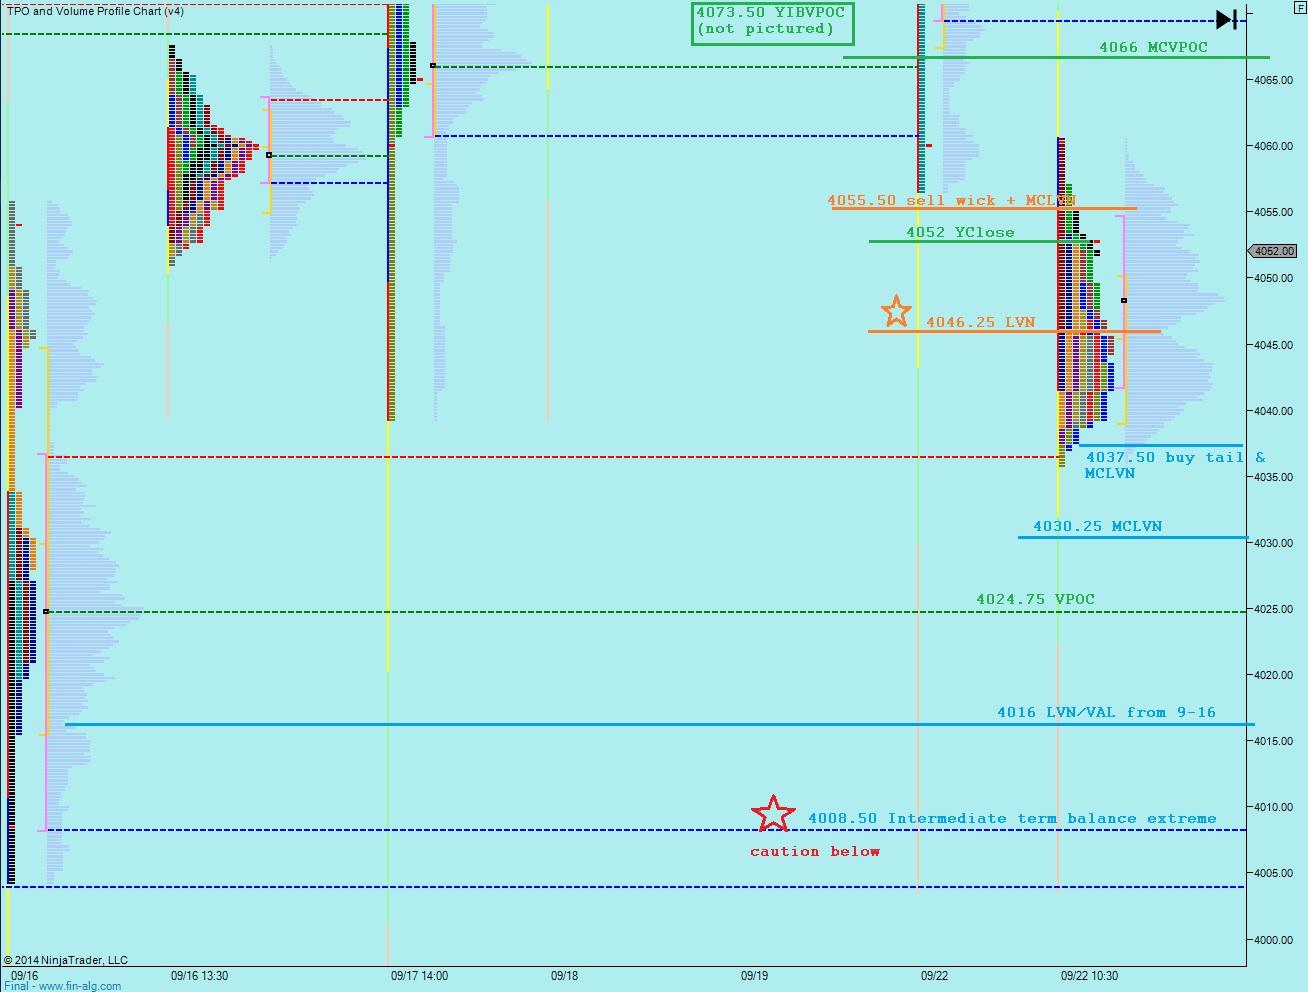
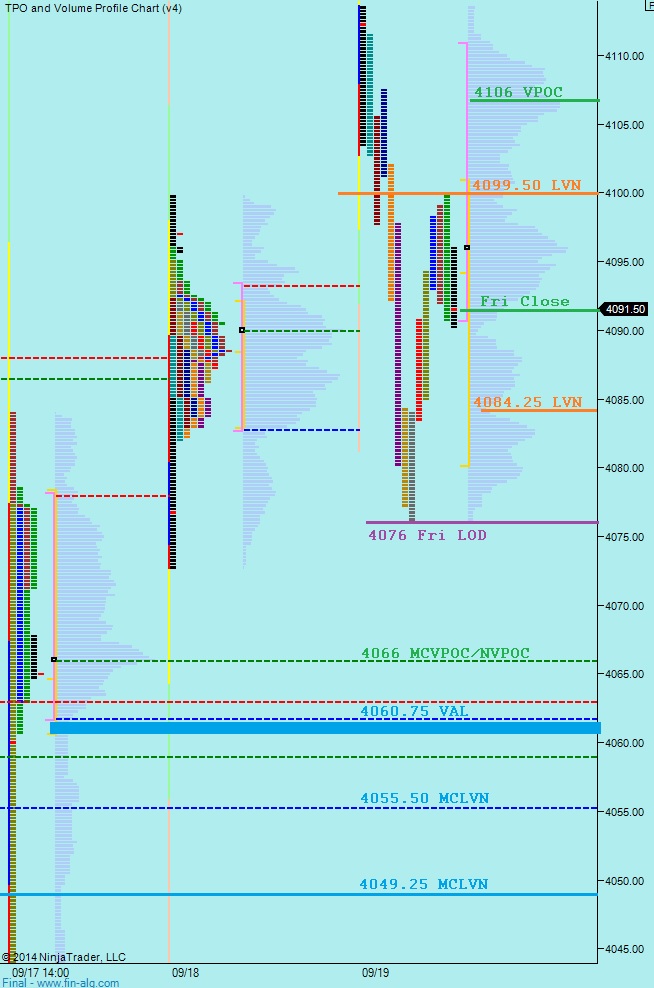
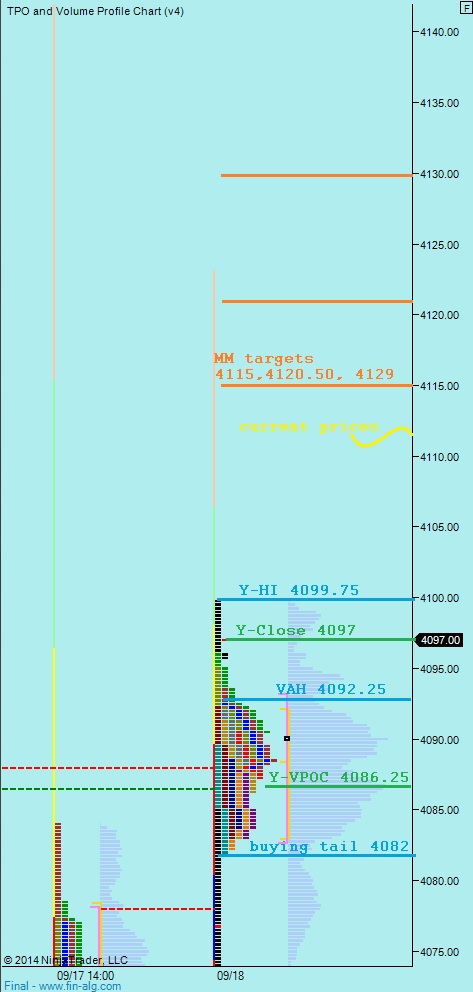
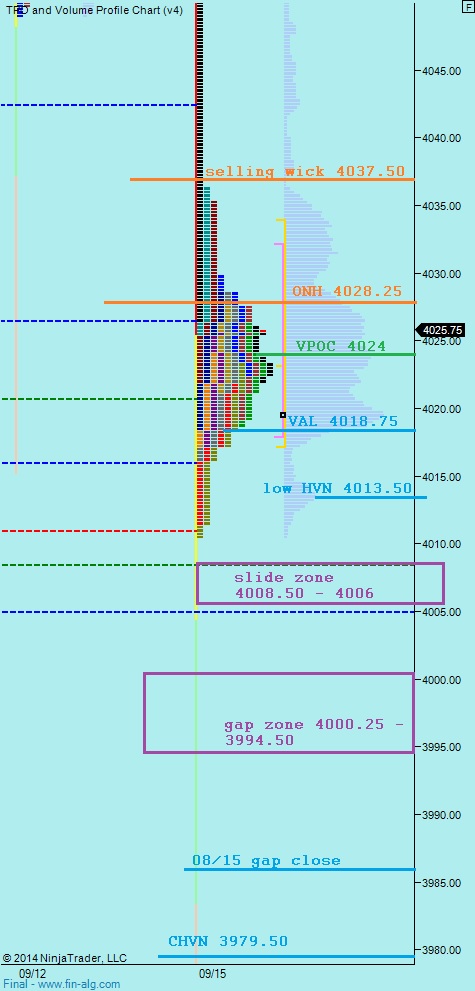
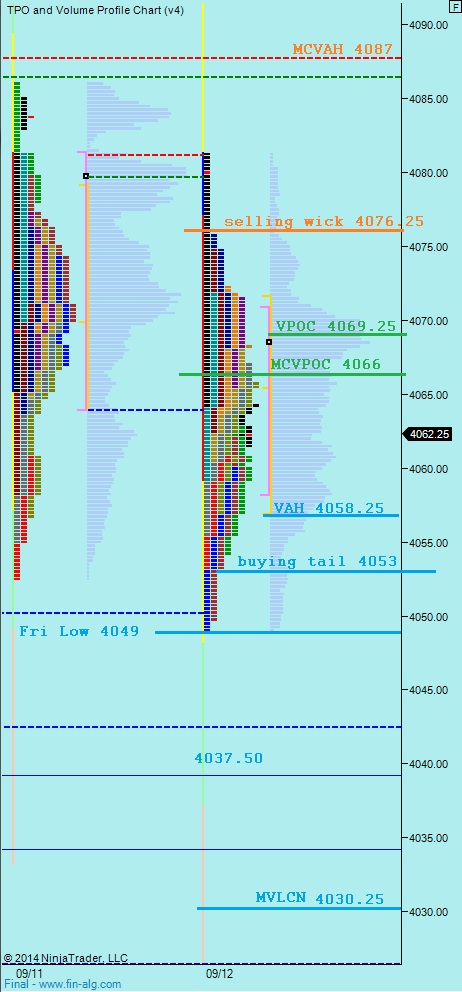
I have noted short term price levels on the following market profile chart.  Note also, barely visible in the top left of the chart is the “solid structure” I discussed yesterday.  This multiple day support foundation was obliterated yesterday and is out of normal upside range as of our current premarket prices.  See below:

09262014_marketprofile_NQ

Comments »

Stable Structure

Nasdaq futures traded in a quiet range for most of the globex session before selling stepped up around 8am.  Since 8am there has been a steady flow of sell orders which paused only briefly ahead of the 8:30am durable goods order release.  Overall we are priced to gap down at the open of US trade.  Just after the open we will have PMI numbers at 9:45am, natural gas storage data at 10:30am, Kansas City Fed Manufacturing Activity at 11am, and Fed’s Lockhart speaks at 1:20pm.  Bank of England Carney is speaking as we head into US trade and the main talking point is interest rates which he says are close to rising.

The intermediate term timeframe continued its balancing act yesterday when it quickly traversed the point of control at 4066.  The velocity of the move might be attributed to the compression which took place prior to the breakout.  When balance begins to form inside of a larger balance, you know there is a coil ready to spring a big move.  Buyers will want to defend their progress and extend upon it soon, otherwise they risk calling the entire move into question.  I have noted the key levels I will be observing on the following volume profile chart:

09252014_intterm_NQ

On the below market profile chart, I have made some cuts and merges to best view the auction taking place.  Note the solid structure below our current prices.  This is comprised of trade from late Monday morning through to early yesterday.  On either side of it is the hard sell on Monday’s open and the fast buy yesterday.  I have noted the key short term levels I will be observing as well:

09252014_marketprofile_NQ


Comments »

Normal Day Compression Environment

On the economic calendar today we have New Home Sales set for release at 10am.  Interesting anecdote, I was speaking with the largest lumber dealer in the metro Detroit area over the weekend who said they are having their best year on record.  Odd, or he’s lying.  Energy traders will be watching the 10 and 10:30am releases of crude oil, gasoline, and distillate.  Fed Mester will speak on monetary policy at 12:15pm and Fed Evens will s peak at 1:00pm on the labor market.  Pre-market Thursday we have US Durable Goods Orders on the docket which is something to keep in mind for any overnight positions you intend to hold.

I love when rare events occur and yet receive no coverage in the financial media because it means I have something interesting to share with you.  Yesterday the Nasdaq futures printed a ‘normal’ day-type which interestingly enough is anything but normal.  There have only been 55 instances since July 2010 aka 95% of the time this type of day does not print.  We have printed eleven such days in 2014.  A normal day is classified as a day where no range extension occurs on either side of the initial balance.  Its characteristics usually include an aggressive entrance into the early markets which stretches a wide initial balance which remains as the extremes for the duration of the session.  We indeed printed an abnormal IB range yesterday.  I have noted our range on the embedded chart inside the below chart, which highlights all prior normal days this year:

09242014_normaldays_NQ

We cannot infer much information to aid in prediction using this fact, however we can examine the contextual powers at work.  This is the story and we always want to read it as more information is made available.  Lately this market has seen prices aggressively pushed around by other time frame participants.  Their actions can be seen both on price bars and volume profile as long stretches of action with no respect for day trader levels (value areas, VPOCs, etc.)  These higher time frame moves are motivated more by geopolitical events, macroeconomic data, or some other longer term perspective analysis.  However yesterday, and to a certain extent Monday, we began seeing signs that the other time frame activity is abating.  On Monday I actually split off most of the day’s profile from the initial balance because after the first hour of trade the market completely shifted its behavior.  Pair that with yesterday’s big initial balance and you see what is occurring—early session OTF aggression but a market coming into balance.

Even more interesting, this balance is forming inside a larger intermediate term balance which, as highlighted yesterday, needed some back-and-fill to properly form the symmetrical Gaussian curve.

I will stop here, for this is becoming too complex when in reality markets are very simple mechanisms for facilitating trade.  We are doing a very good job of it inside of this intermediate term balance.  If trade dries up on attempts lower, then we head higher to previous sources of liquidity.

I have highlighted key intermediate term price levels on the following volume profile chart:

09242014_intterm_NQ

Finally and most actionable, I have marked up the market profile chart with the key levels I will be observing today.  Also note, once the splits have been made to reveal the auction activity we printed an outside day yesterday:

09242014_marketprofile_NQ

Comments »

Is the Nasdaq Still Worth This Much?

The Nasdaq futures were a sell overnight where we saw prices move lower from their closing print.  The overall volume and range were by no means abnormal, the sell flow managed to print about 20 points of range on about 30,000 contracts.  Sellers managed to take out Monday’s low print by a few points before finding responsive buying.  Since then we have seen buyers attempting to defend yesterday’s low at 4035.75.  Whether or not they sustain trade above this level into cash open is still up for debate.

Chinese “flash” PMI came in slightly better than expected and had little effect on equity future prices.  Eurozone PMI was mixed with manufacturing lower than expected and services a bit higher.  We are set to see our US PMI at 9:45 am today.  We also have Fed speakers Powel and George right around market open and Richmond Fed Manufacturing Index at 10am.

The major headline this morning is the US and allies launching airstrikes on Syria.  Expect headline risk to run high as this information develops.

Below we can observe the mature balance of the intermediate term.  After making a slight new high on Friday, prices came barreling lower through the VPOC at 4066.  This suggests a larger timeframe participant, someone whose timeframe is greater than the intermediate term, was motivated to take action and as a result we saw this directional move lower which disregarded these intermediate term levels.  Their actions abated late in the afternoon and we saw a modest response from the buyers.  My initial impression of the failed move higher is to suspect a failed auction.  The fast move away further supports that idea.  However, the sellers need to make a bit more progress to gain control on this timeframe.  Essentially, they either need to take out the price levels I have highlighted below or print a lower high and a lower low.  See below:

09232014_intterm_NQ

I have highlighted the short term levels I will be watching on the following market profile chart:

09232014_marketprofile_NQ

Comments »

Higher Timeframe Activity Pushing About

Nasdaq futures are lower over the duration of the globex session with the bulk of the selling occurring yesterday evening.  We seem to have found a buyer around the time Europe opened and we are since trading back at the mid of the overnight session range.  Today’s economic calendar has Existing Home Sales at 10am.  Also, Mario Draghi is scheduled to speak in Brussels at 9am, and the entire week features a variety of Fed speakers (no Yellen) speaking at a several of events.  On Friday we have GDP stats set for release.

Intermediate term, although we see this timeframe in balance with these longer timeframe participants actively establishing a value through their actions, we can also see the difficulty we are having establishing intraday value.  This suggests two things.  First we are participating in a market with active longer timeframe participants who push price around with their actions.  Second, we are not very complacent nor certain that current prices properly represent value.  As this value matures, now 24 sessions old, the likelihood of transitioning into price discovery increases.  I have noted the key price levels of our intermediate term on the following volume profile chart:

09222014_intterm_NQ

I have marked up the market profile chart with the levels I find interesting going into today’s trade.  The lack of value areas recently makes for an interesting landscape of peaks and valleys for the market to explore.  Where we ultimately locate price acceptance will be telling to start the week.  See below:

09222014_marketprofile_NQ

Comments »

Topside

Nasdaq futures ticked higher overnight and peaked out around midnight before settling back to about the midpoint of the session.  Interestingly, we made a new swing high overnight and the swing high is rarely set outside of normal market hours.

The economic calendar is quiet today.  We have the Alibaba IPO set to price out today and also Leading Indicators at 10am.

Revisiting the weekly chart, you can see the strong responsive buy that occurred throughout the week which resulted in a long tail on the composite index.  What we need to wonder is whether buyer expended all their energy in this response, or whether they will be able to make a fresh push higher.  See below:

09192014_WEEKLYlongterm_NQ

Intermediate term, we are in the precarious position of hanging out on the fringe of intermediate term balance.  As we saw Monday and Tuesday, the gravitational force of the mean can cause a rapid revision.  As we press the upper boundary, we need to be cautious.  Keep in mind however, this balance is old, and the market is likely to begin exploring soon.  I have highlighted the intermediate term balance and some key levels within it below:


09192014_intterm_NQ


I have noted the short term levels I will be observing on the following market profile chart:

09192014_marketprofile_NQ

Comments »

Balance Vision

Nasdaq futures are up a bit as we approach cash trade in the US.  Each session this week, whichever party appears to have controlled the overnight session has been unable to sustain their edge throughout the session.  Thus this gap higher is suspect to a fade lower and perhaps even a down close.  However, just as soon as we suspect we find a pattern it often diminishes.

The economic calendar is quiet during today’s session.  We had Building Permits, Housing Starts, and Continuing and Initial Jobless claims at 8:30am which on the net did little to affect prices.  Traders are likely to pay attention both the BABA IPO and the Scottish independence vote taking place today.

Below you can observe the intermediate term balance.  These conditions are frustrating to many day traders who are having trouble with chop and indecision.  However, swing traders can revel in this environment for as long as it remains in place, up here near the high of the year.  I have highlighted the key levels inside this zone, including the MCVPOC at 4066.  If around 3,500 more contracts trade at this price, then we will see a major VPOC shift on the net composite profile.  The current composite VPOC is down at 3889.25 (not pictured).  If this occurs we need to be keen on who it entices into the marketplace.  Price and value will always converge.  It is our job to discern who it motivates to act.

09182014_intterm_NQ

I have highlighted the short term levels I will be observing on the following market profile chart.  Note also that I split yesterday’s profile at the TPO where The Fed response began:

09182014_marketprofile_NQ

Comments »

Quiet Fed Morning

The overnight session was quiet as we head into a busy end-of-week.  The NASDAQ printed a below normal 9 point range ahead of CPI, which served to expand the range a bit after a lower than expected increase in CPI was released.  Overall, the range is still tight as we approach cash trade.

On these Wednesdays where we have FOMC announcements in the afternoon, we tend to see one or two actionable moves very early in the session and then a pause as the markets waits for the new information to release.  Anything can happen, of course, but having a hypothesis or expectation for the early trade means if something else happens we are seeing unique behavior which warrants our attention.

I opened the topic of intermediate term balance to the open forum Sunday afternoon because its starting point was a bit grey at the time.  Consensus was 08/25 seemed a proper start date and with that information the downside imbalance became abundantly clear.  The fast move lower and subsequent retracement higher yesterday settled the imbalance, but they also stretched out intermediate term balance.  Now I have pulled in data going back to 08/18 which gives the lower half of balance a bit more information.  Yesterday confirmed our hypothesis that intermediate term we remain in balance when we revised back to the mean at 4066.  I have noted the key intermediate term levels below:

09172014_intterm_NQ

I have noted the key price levels I will be observing on the following market profile chart:

09172014_marketprofile_NQ

Comments »

Contextual Roundup Ahead of A Busy Week

Nasdaq futures are down a bit overnight, currently trading near the lows of yesterday’s range.  The economic calendar was quiet mostly during the globex session, with the main release being UK CPI stats.  However, the real news over the pond comes Thursday when Scotland is set to vote on whether to continue as part of the United Kingdom.  The outcome of this election could send waves through the macro world as the Pound reacts.  Also on Thursday we have the BABA IPO.  But before all of that excitement we will hear from the Fed tomorrow afternoon who will be setting their QE pace followed by a Janet Yellen press conference.  Thus the market will have much new information to price in later this week.

Taking a quick look at the long term timeframe, we can see the trend on the Nasdaq composite is still up.  We can also see the fast behavior occurring in this gap zone from 14-years ago.  We are having a proper auction of these prices, both ways, to determine which side of the gap we belong on.  See below:

09162014_longterm_NQ


Determining what data to pull into your intermediate term composite is a matter of knowing what you want to see as far as detail.  Premarket yesterday we switched the start date to 08/25 which revealed the imbalance present in our upper balance.  Now I have pulled more data into the intermediate term composite to give the tail end a bit more detail for reference.  By doing so, we have some clear levels of interest to keep in mind as the day progresses.  Note also the lack of structure just below.  If we are not done finding buyers today, then there is scant volume structure to slow prices down until about 3980.  See below:

09162014_intterm_NQ

I have noted the short term levels I will be keying from today on the following market profile chart:

09162014_marketprofile_NQ

Comments »

Out of Balance

Yesterday I reached out to some of my fellow traders for their thoughts on a somewhat grey area of interpretation on the intermediate term timeframe—where did it begin?  By vote, it was determined the start date of our current intermediate term balance was 08/25, the Monday after a glitch at the CME resulted in a delayed start to trade Sunday evening.  Changing the volume profile to start at this session makes a significant change to the picture we see of market behavior.

If we opt to use 08/22 instead, the current volume profile is in near-perfect balance, and quiet environment where one could aggressively pursue breakouts in individual stocks.  But instead using 08/25, the downside imbalance becomes evident and suggests a bit more patience is likely to yield better entry points at the least.  I have noted the intermediate term imbalance below:

09152014_intterm_NQ

The only other way for the above profile to redevelop balance would be to blunt out on the topside via a multiday grind above the mid.

All of this analysis of past market behavior might be long history come Wednesday when we are set to hear lots of information about The Fed and their QE pace.  These types of news events as close as you will see to a guaranteed market move.  It makes sense to keep this context in mind this week, especially if the market starts grinding sideways, then we are definitely pausing until more information is made available.  This week is also option expiration for the front month index future contract as well as many other contracts.  We might see an early move because of this.  Just before the bell today at 9:15 we have some industrial production numbers which might start the futures moving ahead of the bell.

The overnight session got off to a bumpy start last night.  When trade opened in globex a wave of selling ripped through.  The volume on the move was very low and the price action erratic as if a few algos were playing ping pong.  The net result is a fairly normal 30.75 point range on volume which is slightly above normal.

I have highlighted the key levels I will be observing on the following market profile chart:

09152014_marketprofile_NQ

Comments »