iBankCoin
Home / Tag Archives: $NDX (page 29)

Tag Archives: $NDX

Settling Unfinished Business

Sellers gained quite a bit of confidence yesterday.  The day started with responsive selling into the overnight strength which morphed into initiating selling for the rest of the day.  The session ended up printing a new swing low and solidified the seller control on the intermediate term timeframe.

The long term timeframe is still buyer controlled in the NASDAQ composite even through this selling.  This can be seen as a series of higher highs and lows on the weekly chart.  We are watching the market follow through this week on an outside candle print two weeks back.  The outside candle print often occurs near inflection points.

The intermediate term is seller controlled.  I had to rebuild my volume profile back to November 25th to get all the data needed for a proper composite profile representation.  I have highlighted some key levels and observations on the following intermediate term volume profile chart:

NQ_VolumeProfile_intermediateTerm_03272014

The short term auction is seller controlled.  Value is being pushed lower and prices are testing lower into areas of unfinished business (naked VPOCs).  I have highlighted the key levels I will be watching today, as well as a few scenarios on the following market profile chart:

NQ__MarketProfile_03272014

Comments »

Sellers Abate as Balance Takes Shape

NASDAQ futures are higher overnight and we are currently priced to open inside of yesterday’s range but outside of value which presents an elevated potential for big intraday moves.  The overnight profile is also interesting because it shows no real consensus on value.  Instead we have a toothy profile with buyers pushing higher.

Price traversed through the volume cave which delineates where our upper-most intermediate term balance zone exists.  We are currently trading just above it which creates the potential opportunity for an overnight gap fill more possible and rapid due to the low volume structure beneath our current pricing.  The intermediate term is seller controlled but showing signs of balancing.  Yesterday morning sellers were unable to press to new lows verses Monday.  Instead we stabilized at a low volume node just above the Monday low and reversed higher.  Sellers need to prevent acceptance of trade above 3645.75 to sustain their control of the intermediate term. The long term auction is still buyer controlled as seen on a daily chart.  I have highlighted this key price level and the volume cave below on the following volume profile chart:

NQ_VolumeProfile_intermediateTerm_03262014

The short term auction is out of balance and buyer controlled.  This can be seen as value migrating higher.  Buyers need to make a new high above 3645.75 (overnight high) to firm up their control in the short term.  I have highlighted this level and a few potential scenarios on the following market profile chart:

NQ__MarketProfile_03262014

Comments »

Day Trader Environment

The NASDAQ futures are higher overnight, drifting quietly through the globex session after buyers put together a decent bounce yesterday afternoon.  As the USA comes online, prices are currently trading just above the afternoon swing high.

The long term auction taking place in the NASDAQ composite has become an interesting picture.  On one hand, the weekly chart is very much still in buyer control.  The series of higher highs and lows is still intact.  Yet the weekly chart offers us a bit of contex that we continue to watch develop. Three weeks back it printed an outside candle and this week has the potential to confirm it to the downside.  Of course, this is very early speculation since we have only seen one trading day, but something to keep in mind nonetheless.  The daily chart suggests buyers are still in control but with a more confident seller pressing down below recent support.  We have not seen a swing low support broken since late January.  In that instance the market quickly V-shape recovered, should one expect the same outcome again?

The intermediate term auction is seller controlled.  This can be seen as a series of lower highs and lower lows.  The sellers also pressed us out of the intermediate term balanced volume profile.  There now exists a large void in volume where the lower end of balance once existed.  It would not surprise me if price were to traverse this area several times the next time we come to it before the market ultimately decides which side of the cave it wants to trade on.  I have highlighted this volume cave and some other interesting observations on the following volume profile chart:

NQ_VolumeProfile_intermediateTerm_03252014

The short term auction is buyer controlled.  We saw responsive buying yesterday afternoon which resulted in some tail prints which demonstrate strong demand.  When the NASDAQ came into the bell while forming balance and that profile print has a long tail on it also.  There exists a stronger potential for an opening drive this morning for two reasons.  First, the market is currently trading only a few points below the volume cave highlighted above (intermediate term).  Second the market profile prints are single prints like a zipper, and prices tend to run right up these.  Thus, any aggressive attempts to fade early strength are at an elevated risk of a drive.  Otherwise,  we have a solid profile structure to trade against below us.  The play would be to short into any early overbought positions and target an overnight gap fill.  If price trades inside of the prior value for an hour, find another entry onto the short side to trade through value to the VPOC and then the VAL.  I have highlighted this trade as well as a few other observations on the following market profile chart:


NQ__MarketProfile_03252014

Comments »

If Balance, Then Buying Opportunity, Else Caution

Futures are slightly up through the globex session despite my twittersphere erupting with hubris over the China PMI data that came out last night.  I never view the futures after the market closes because I do not trade during these hours and usually someone else will talk about them sufficiently.  To me, the equity index futures really only make sense when the underlying instruments they track are also trading, especially in our current environment, the “market of stocks”.

Taking to the NASDAQ, the long term picture is interesting as we can still see buyers in control of the auction.  The weekly chart printed an outside candle two weeks back which is a candlestick pattern which tends to develop near inflection points.  It is important to wait for confirmation of this type of candle before adding credence to it.

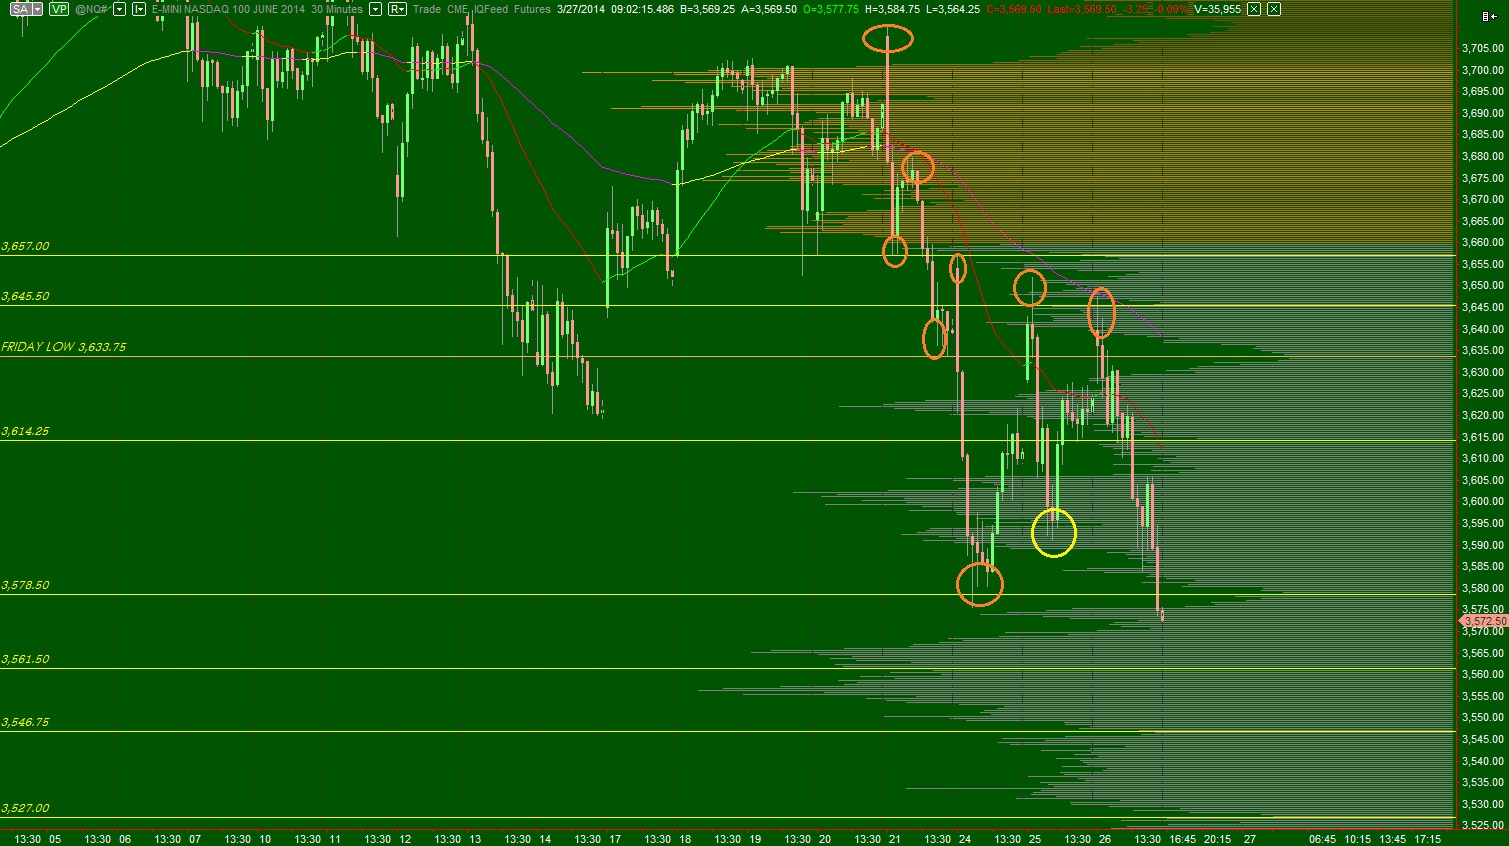
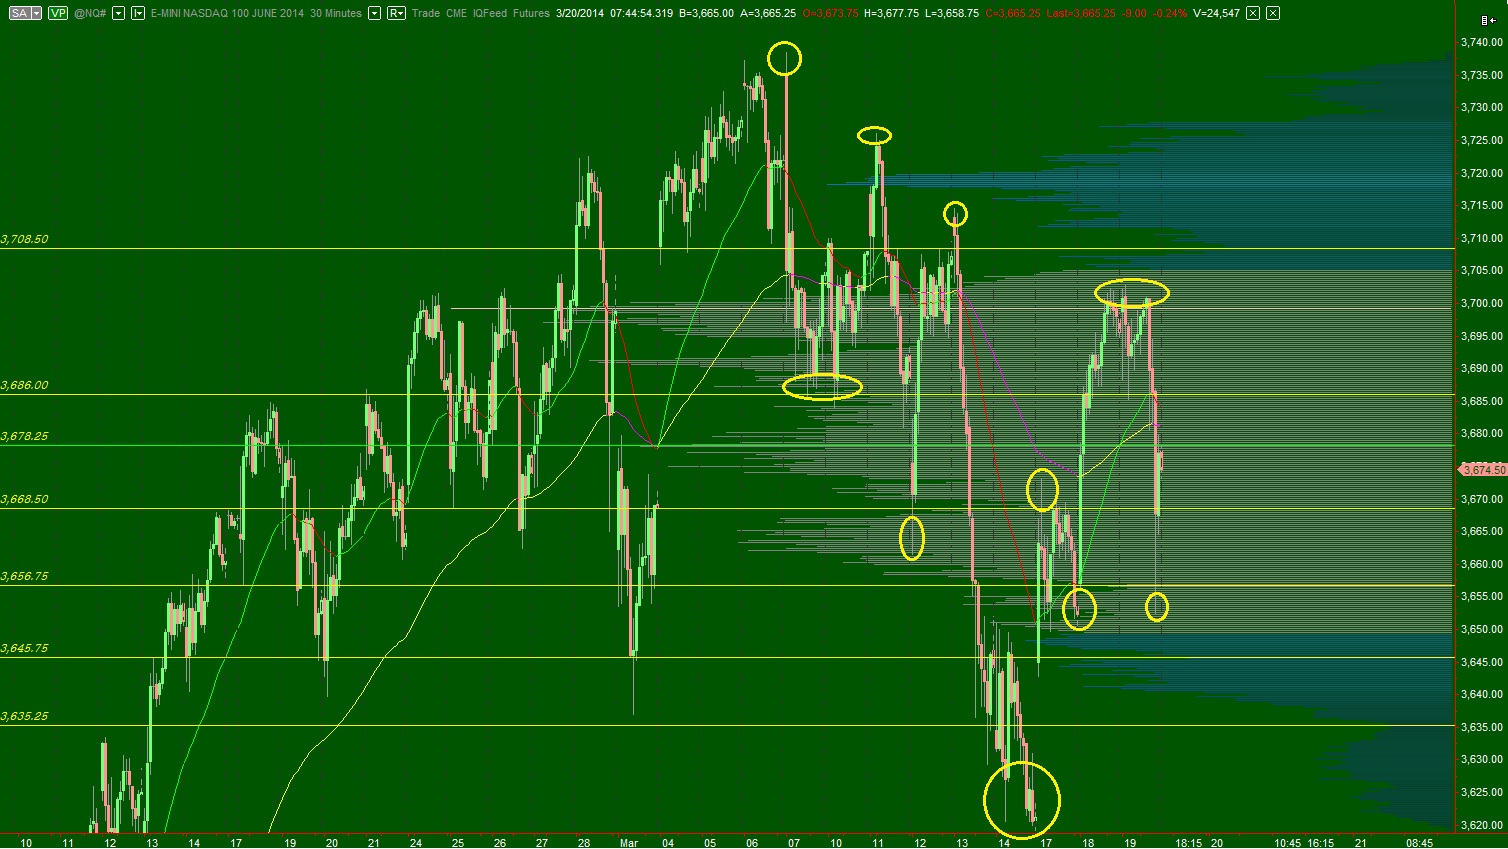
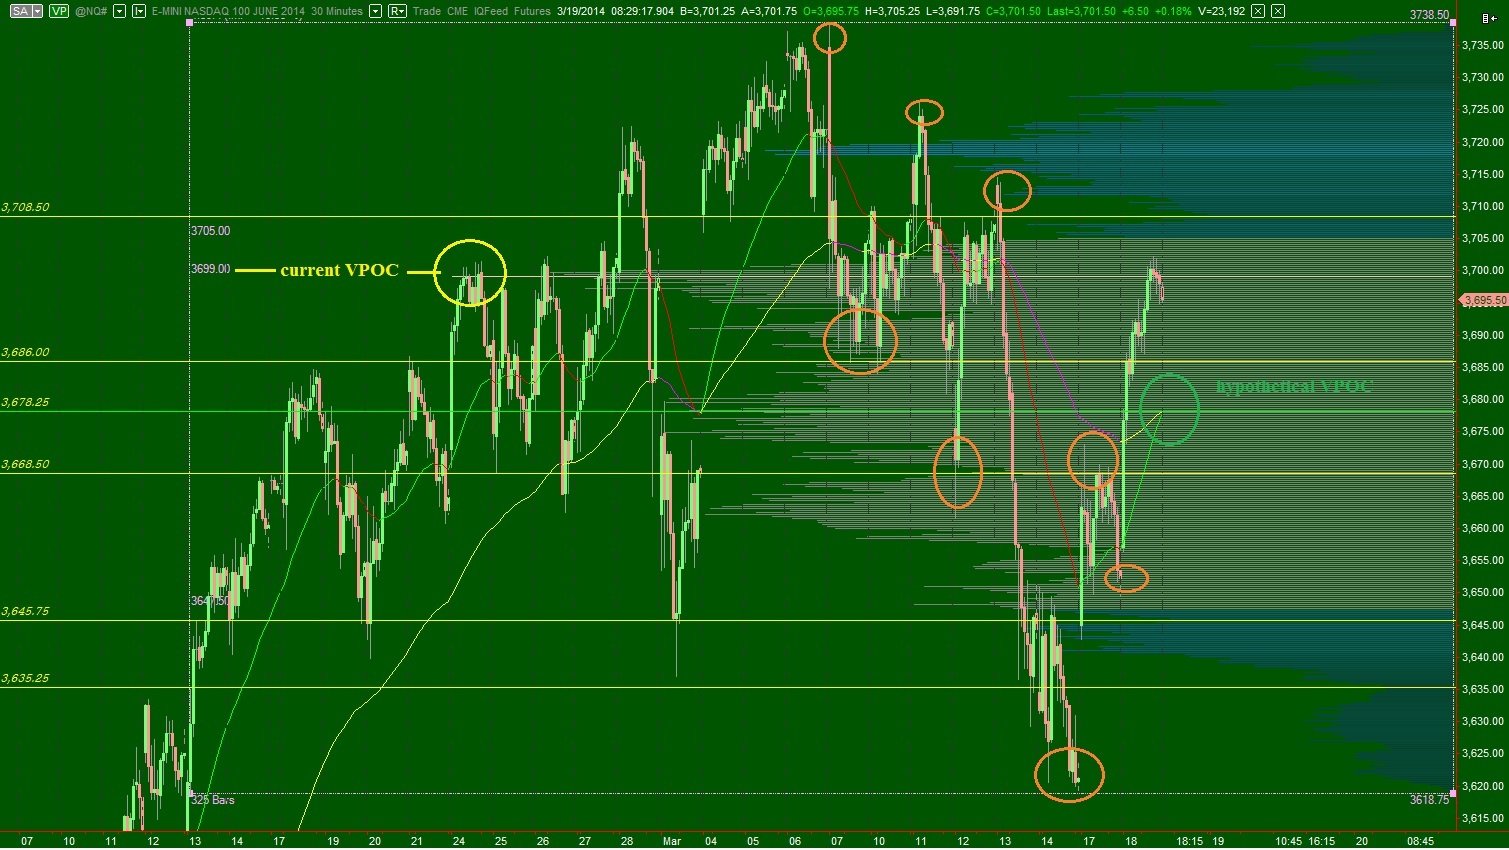
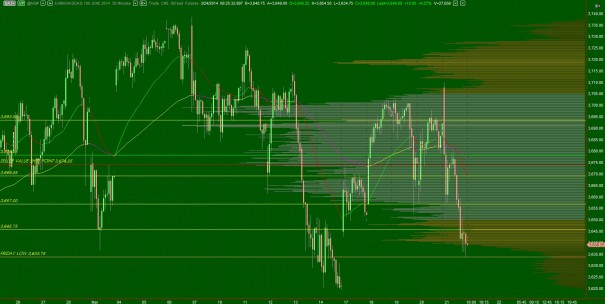
The long term auction as viewed on a daily chart of the NASDAQ composite is in buyer control.  Sellers can shift the long term into balance by sustaining trade below the lows printed two Fridays ago, March 14th.  If they are able to complete this feat, it would put the long term auction into balance.  Until then, we are still in buyer control on the long term.

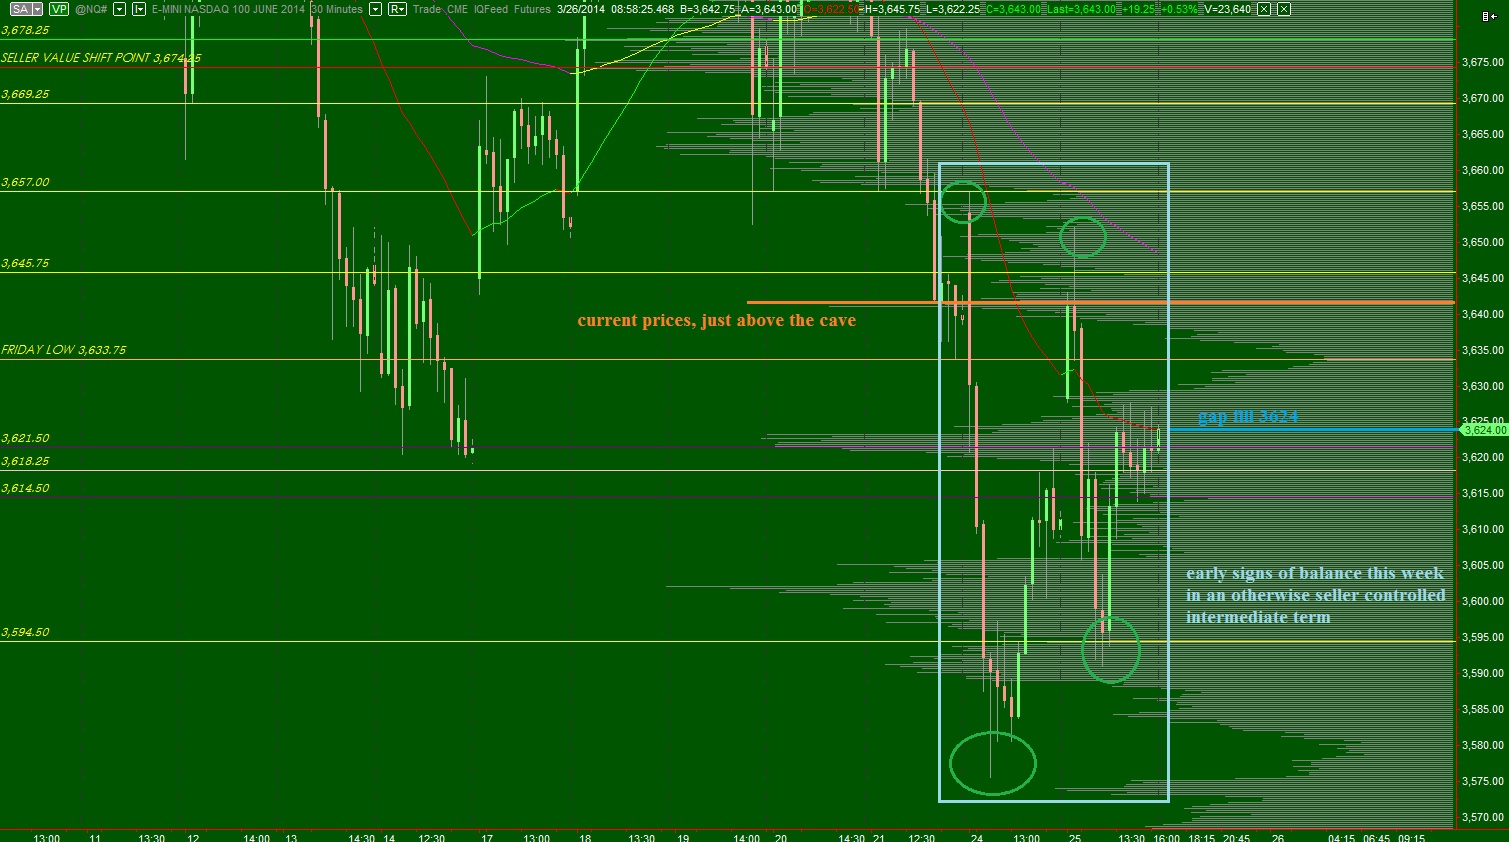
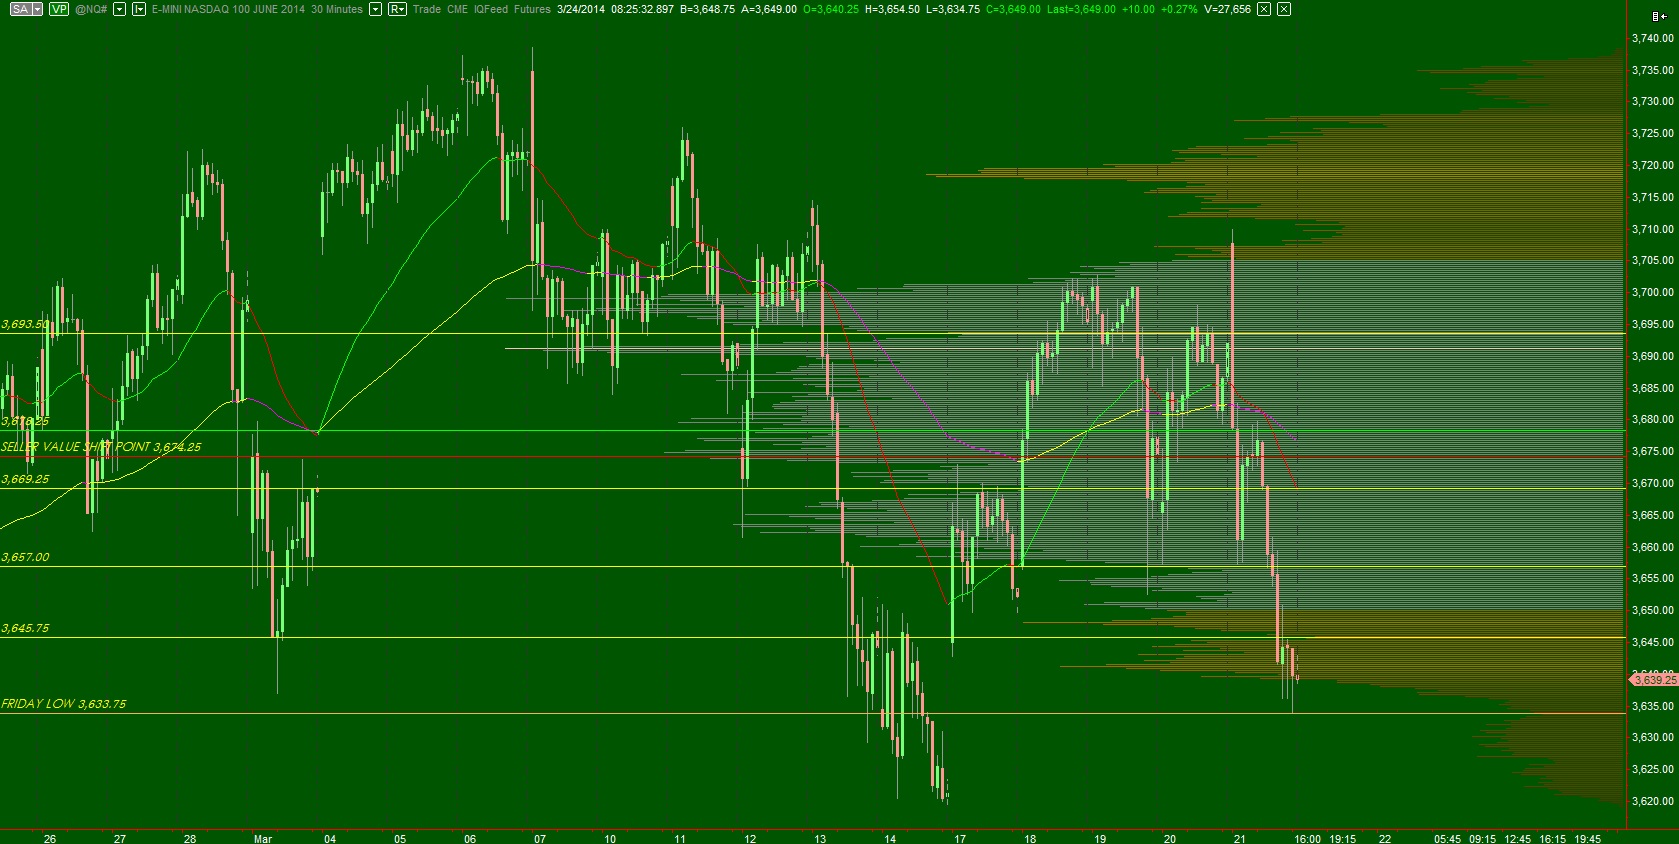
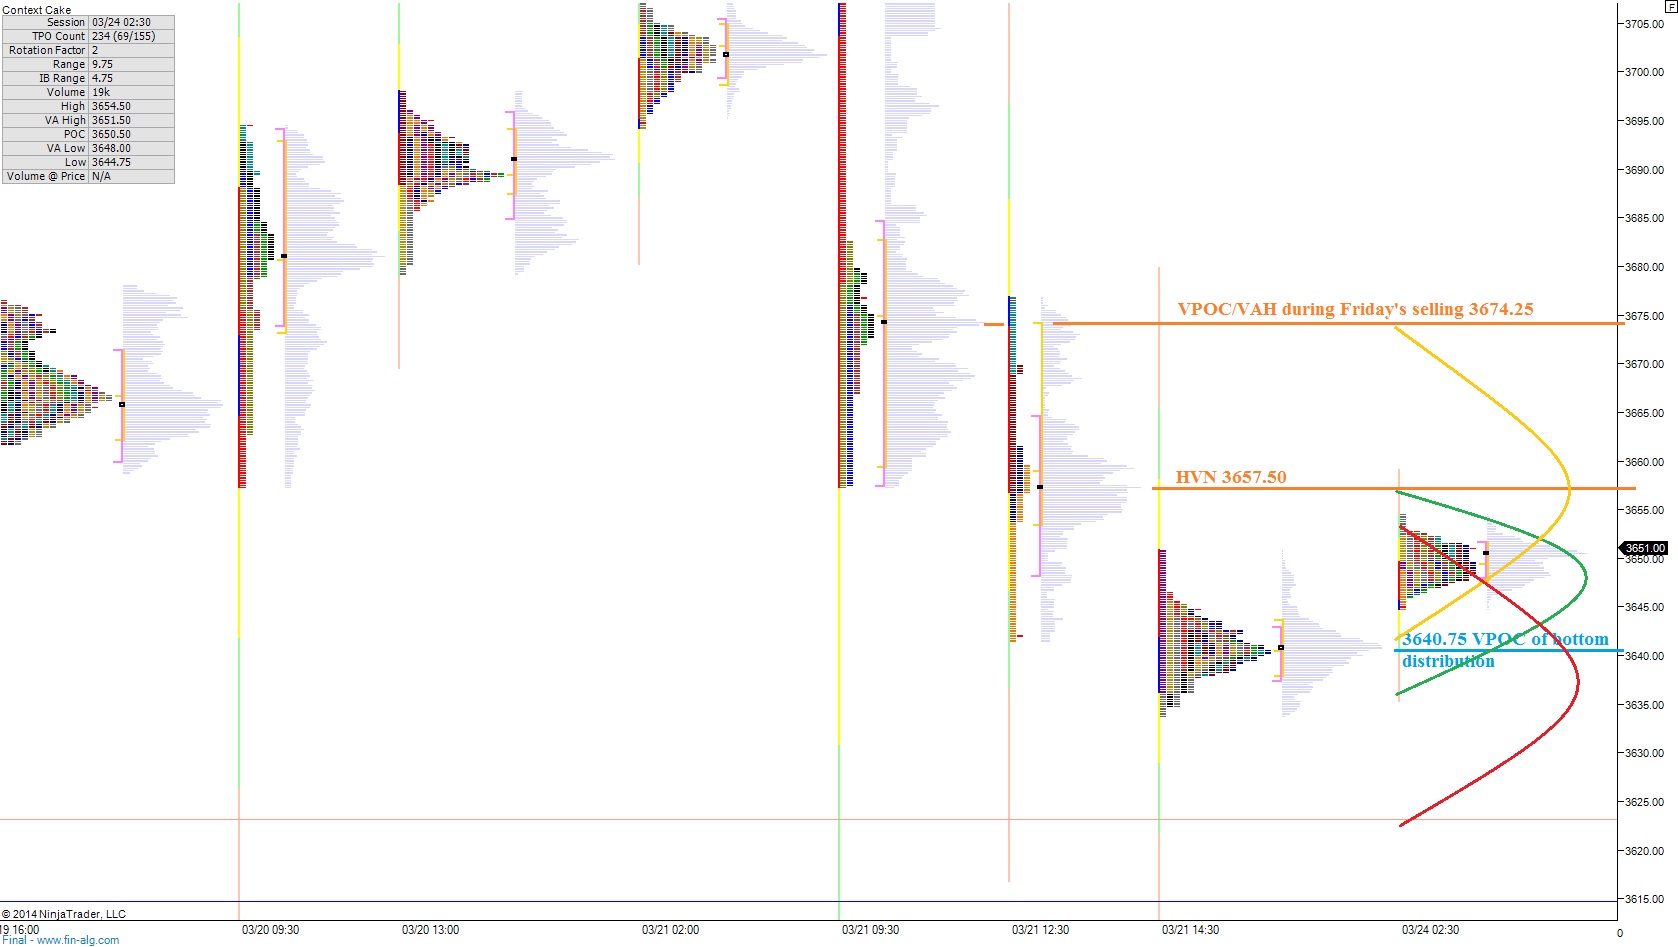
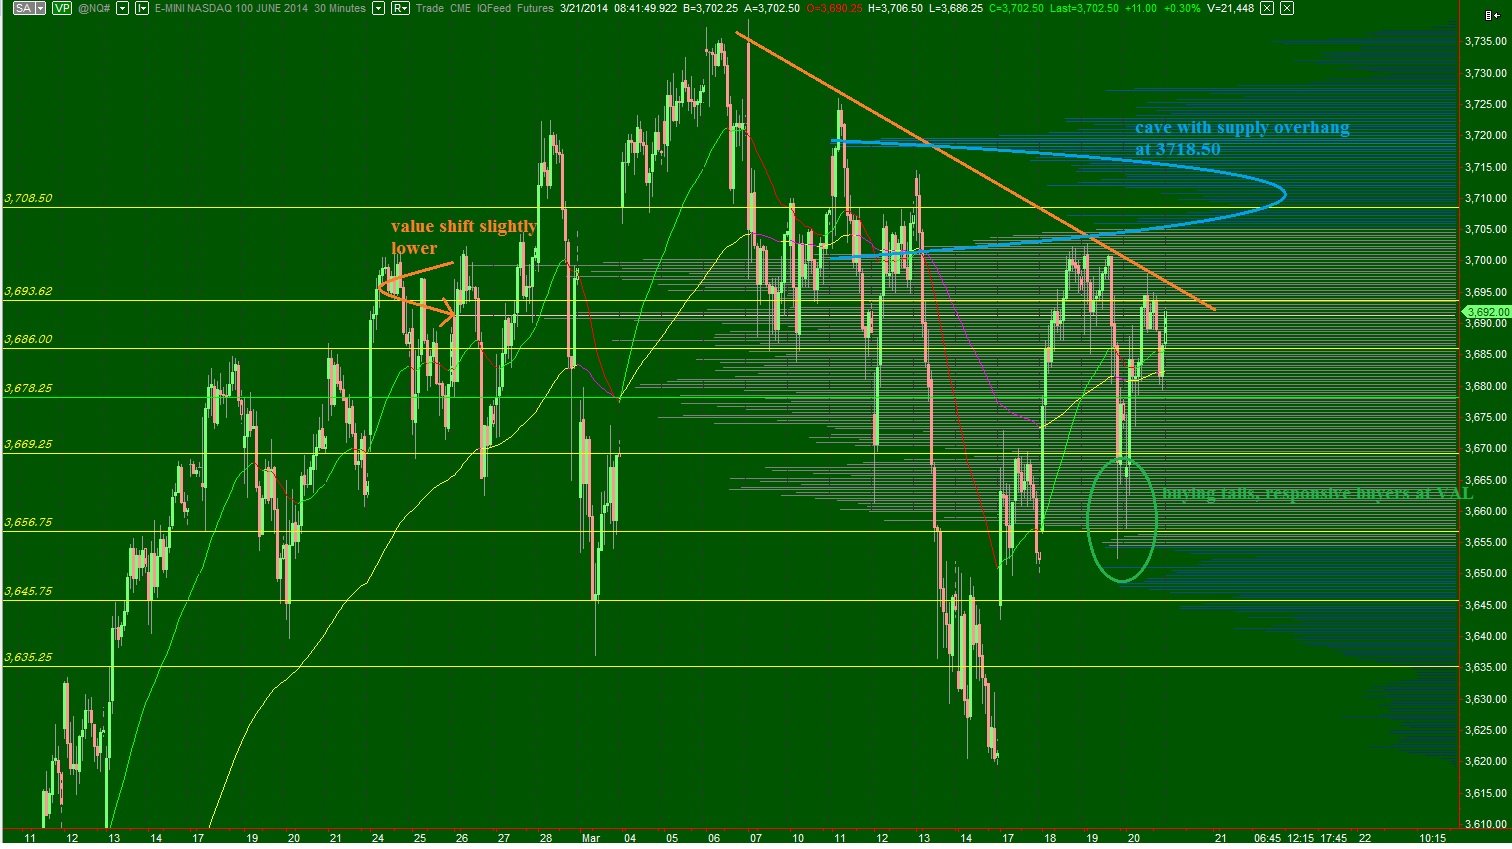
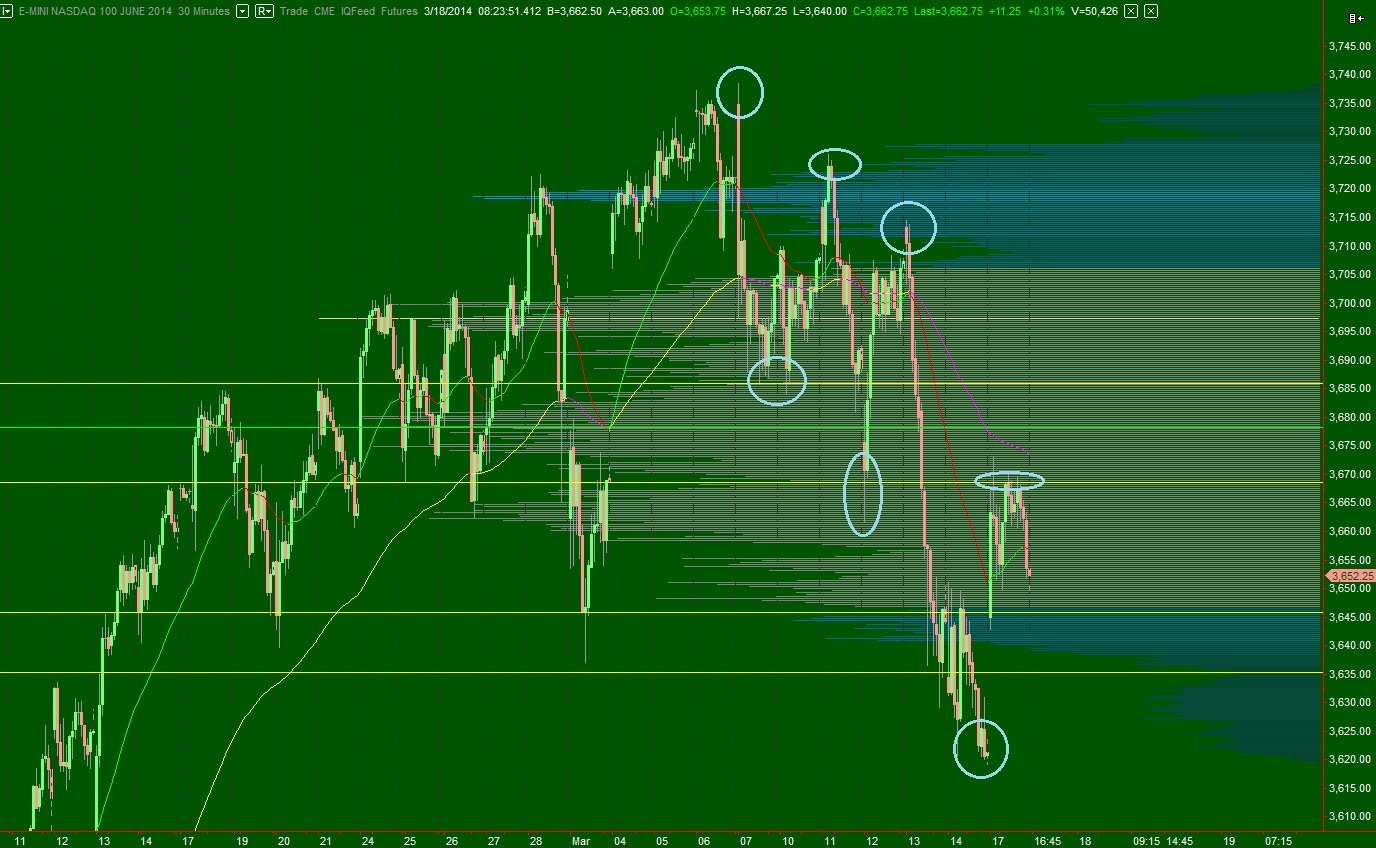
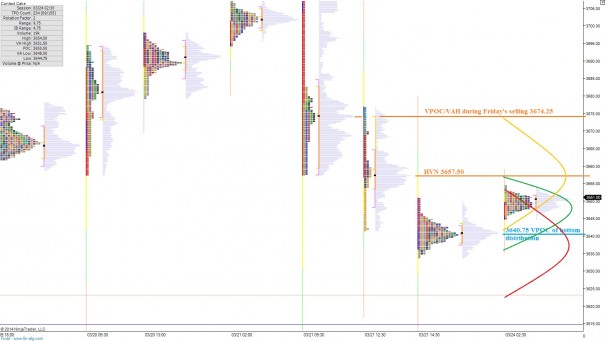
The intermediate term is balanced with an edge to the sellers.  The potential exists for another revision trade back to the midpoint of the maturing intermediate term balance we have been watching which dates back to February 13th.  The VPOC of our balance still sits well above the midpoint which suggests the market has not yet accepted the lower end of intermediate term balance as fair.  Sellers gain the slight edge because of the speed with which we have seen the market trade.  This fast environment creates anxiety which can result in liquidation.  If we are to stay in balance, then the market needs to not spend too much time below 3645.75 today.  I have highlighted the key levels pertaining to the intermediate term on the following volume profile chart:

NQ_VolumeProfile_intermediateTerm_03242014

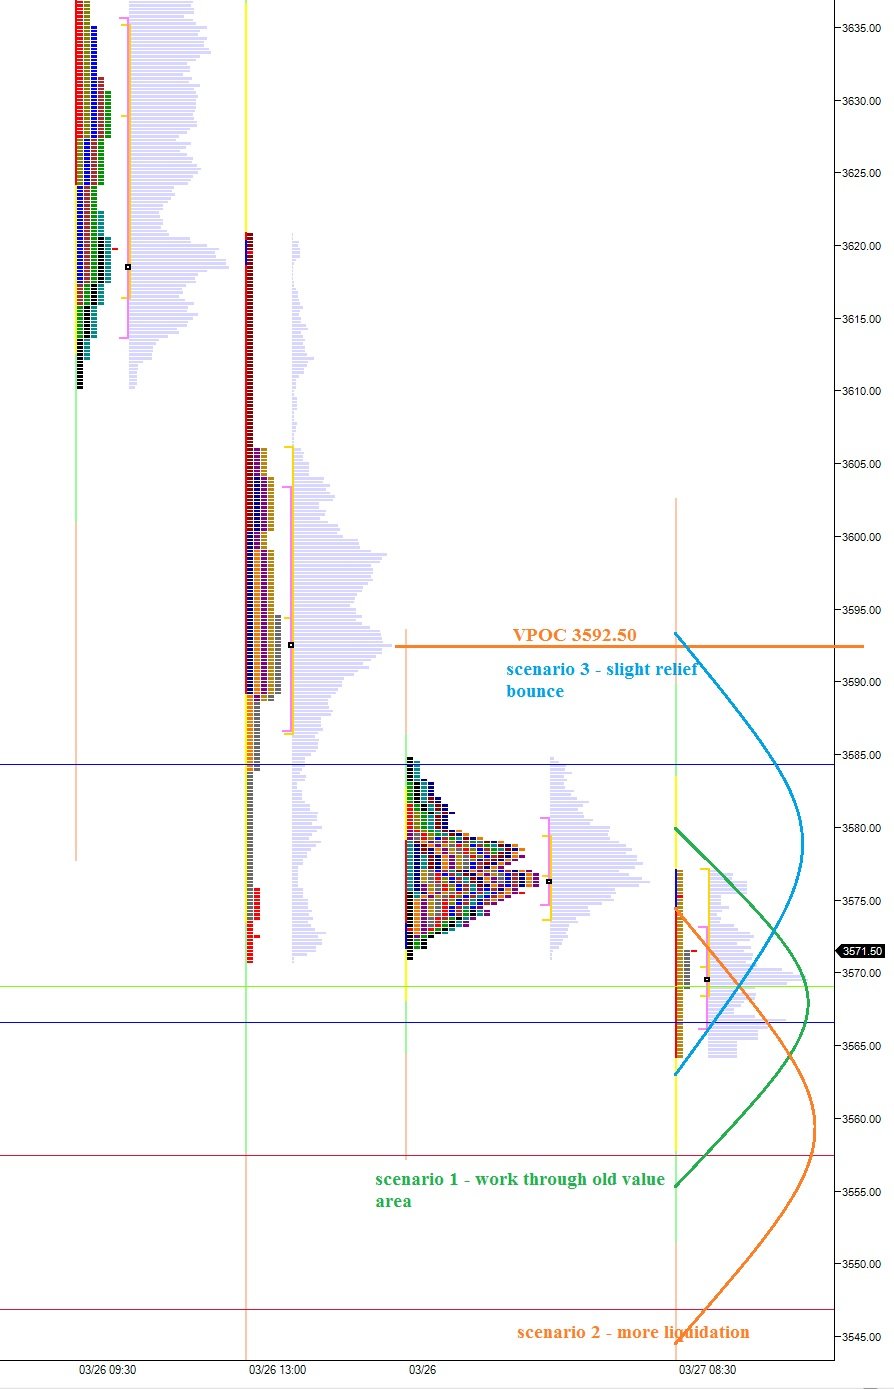
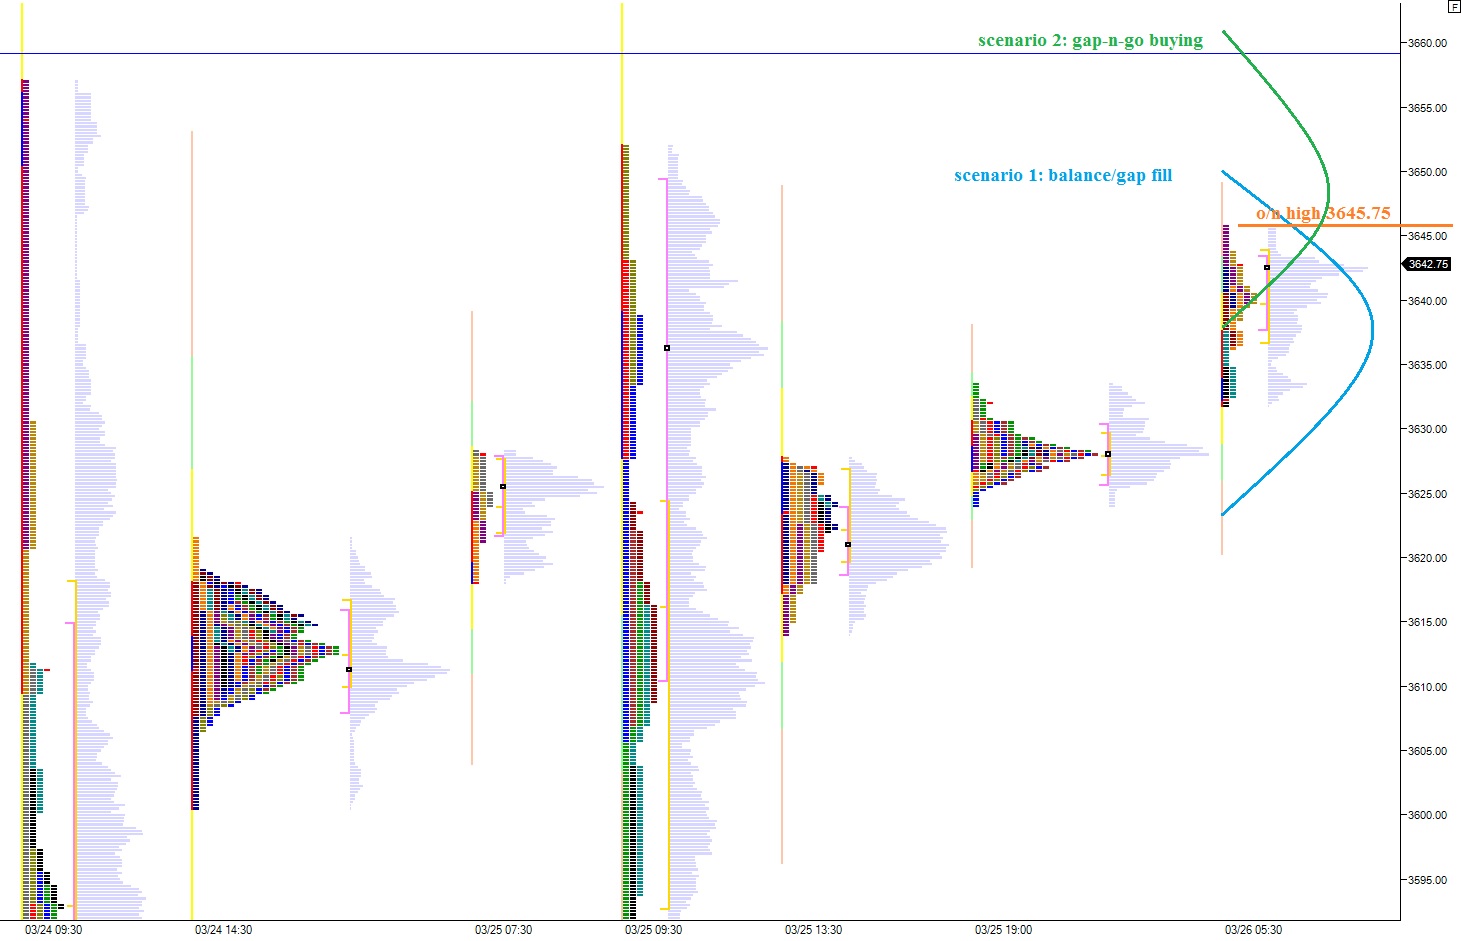
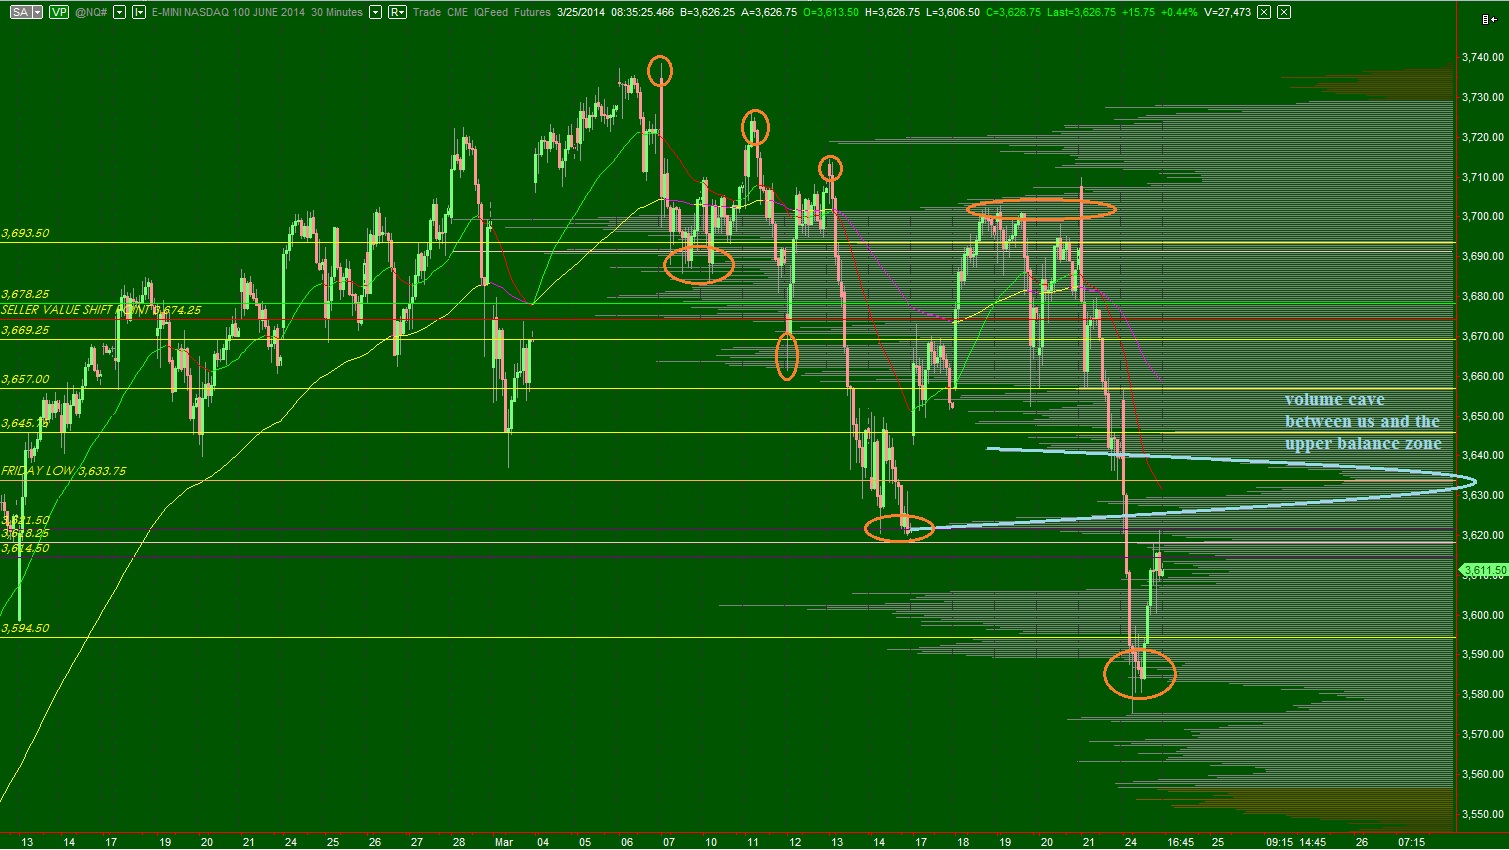
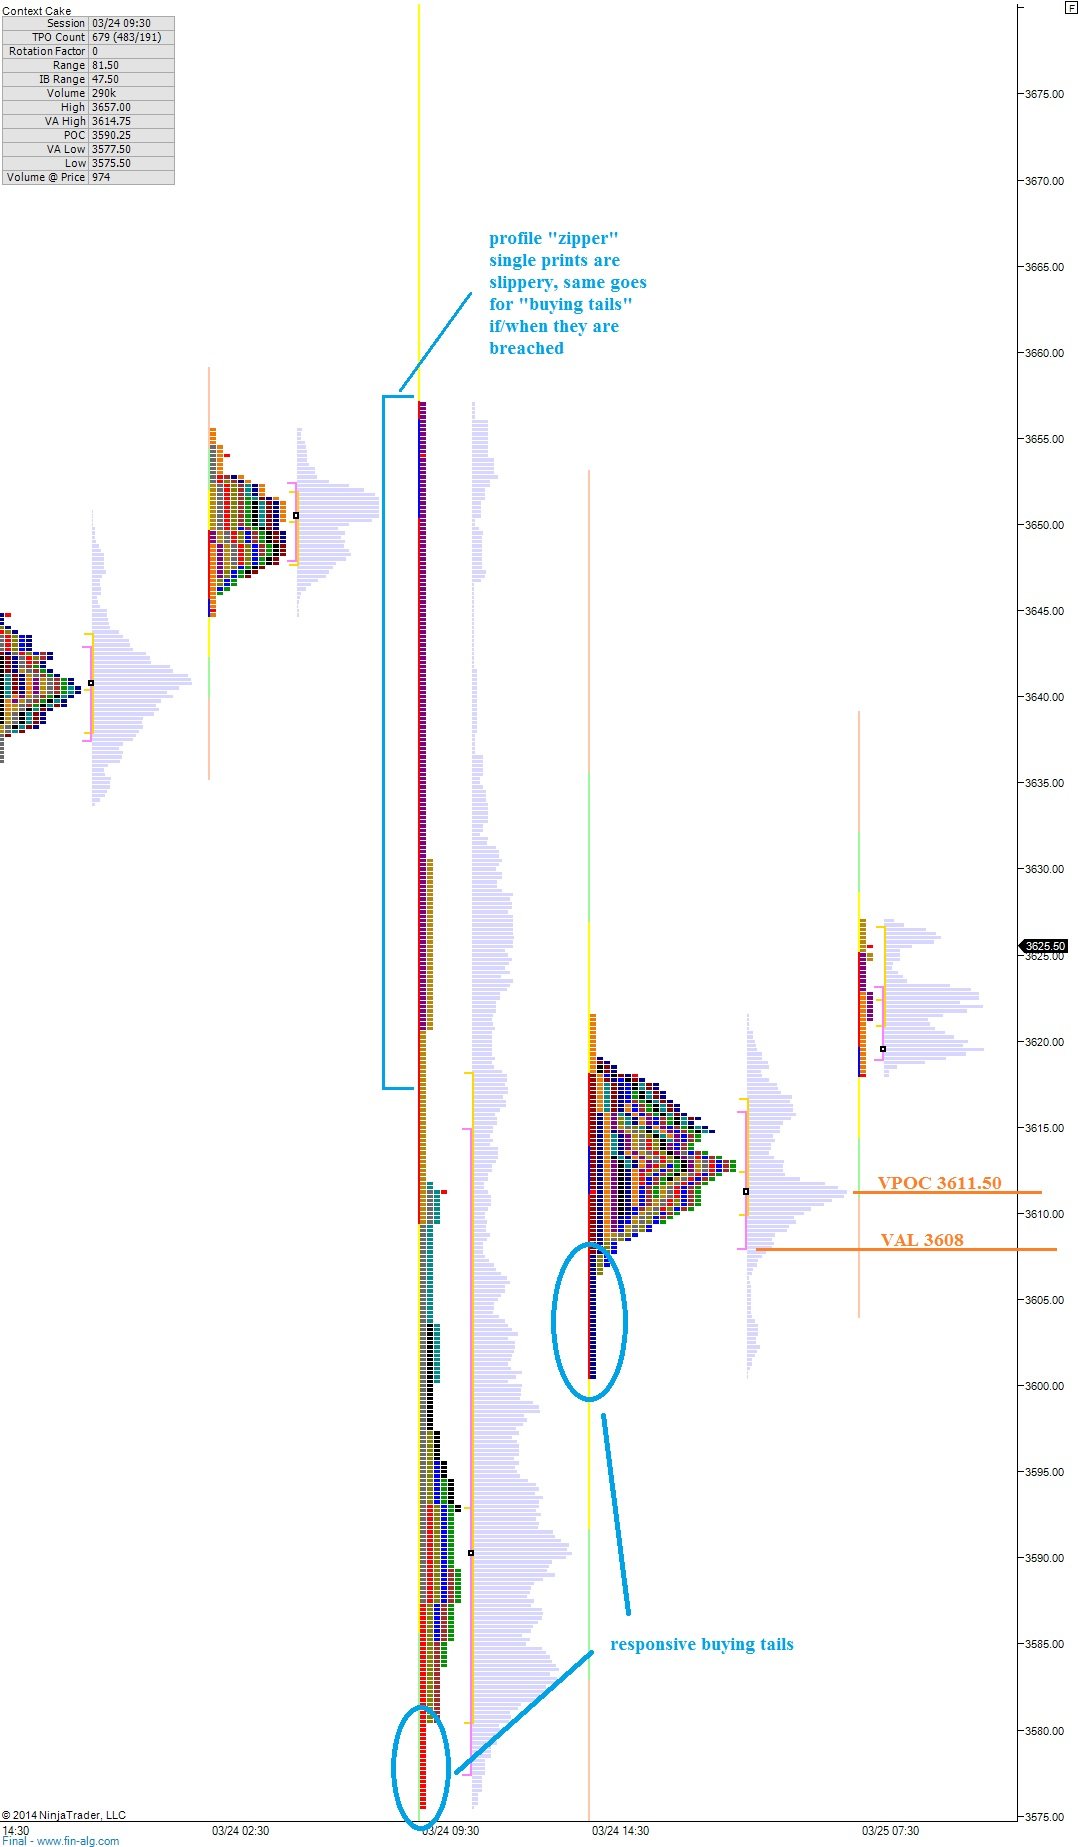
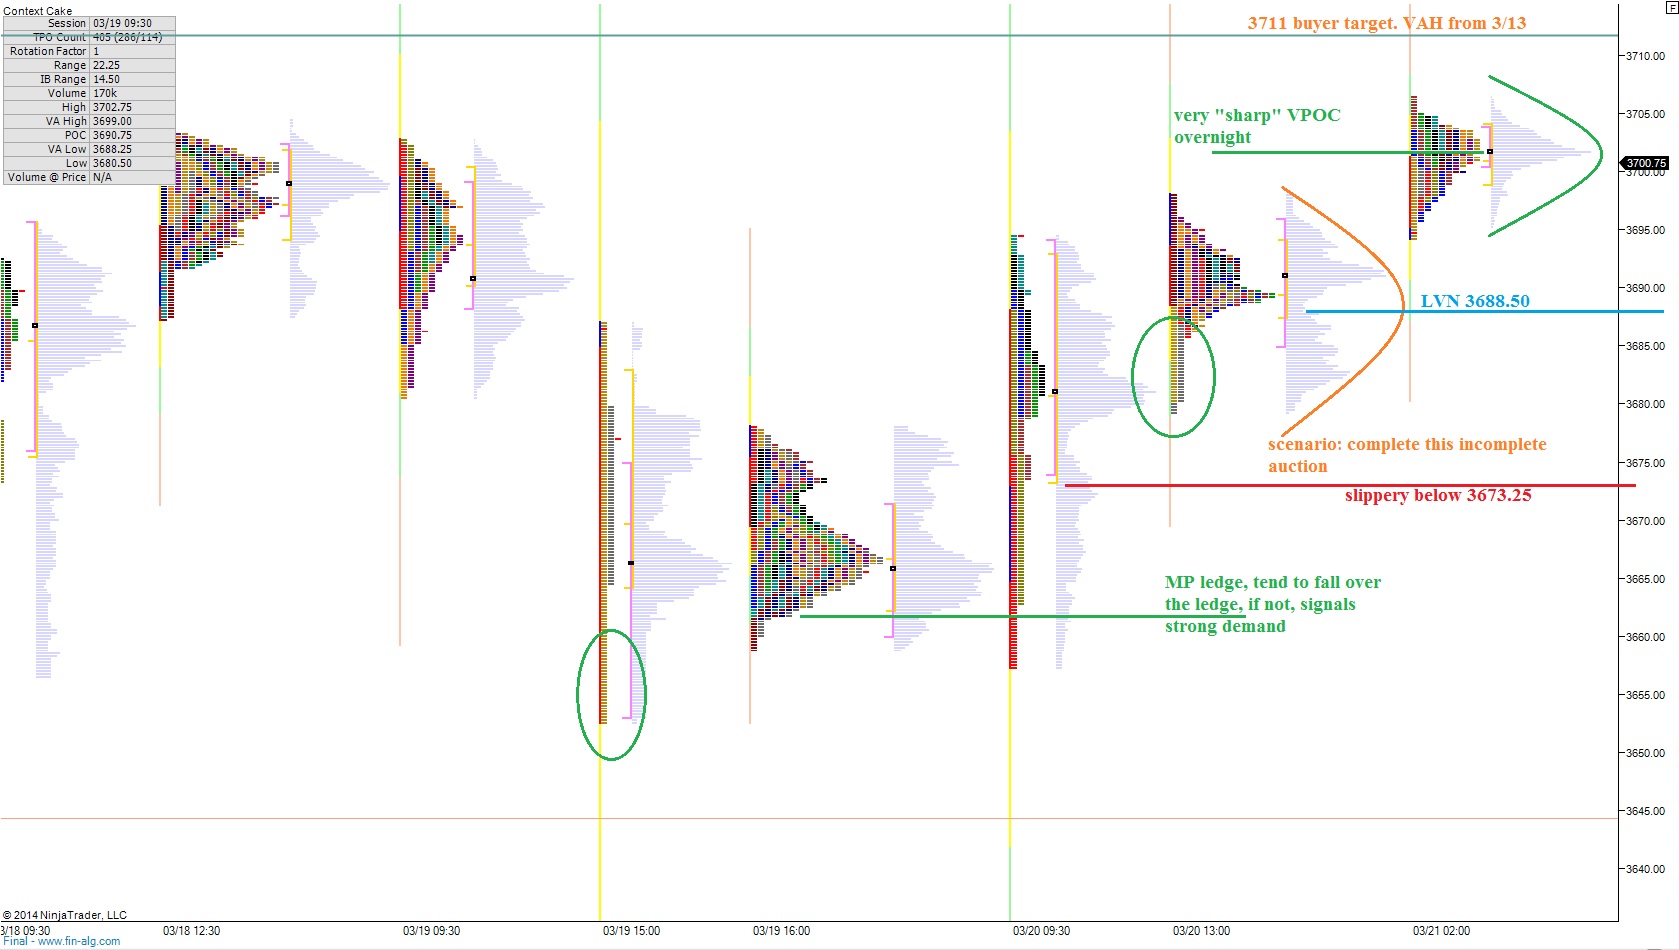
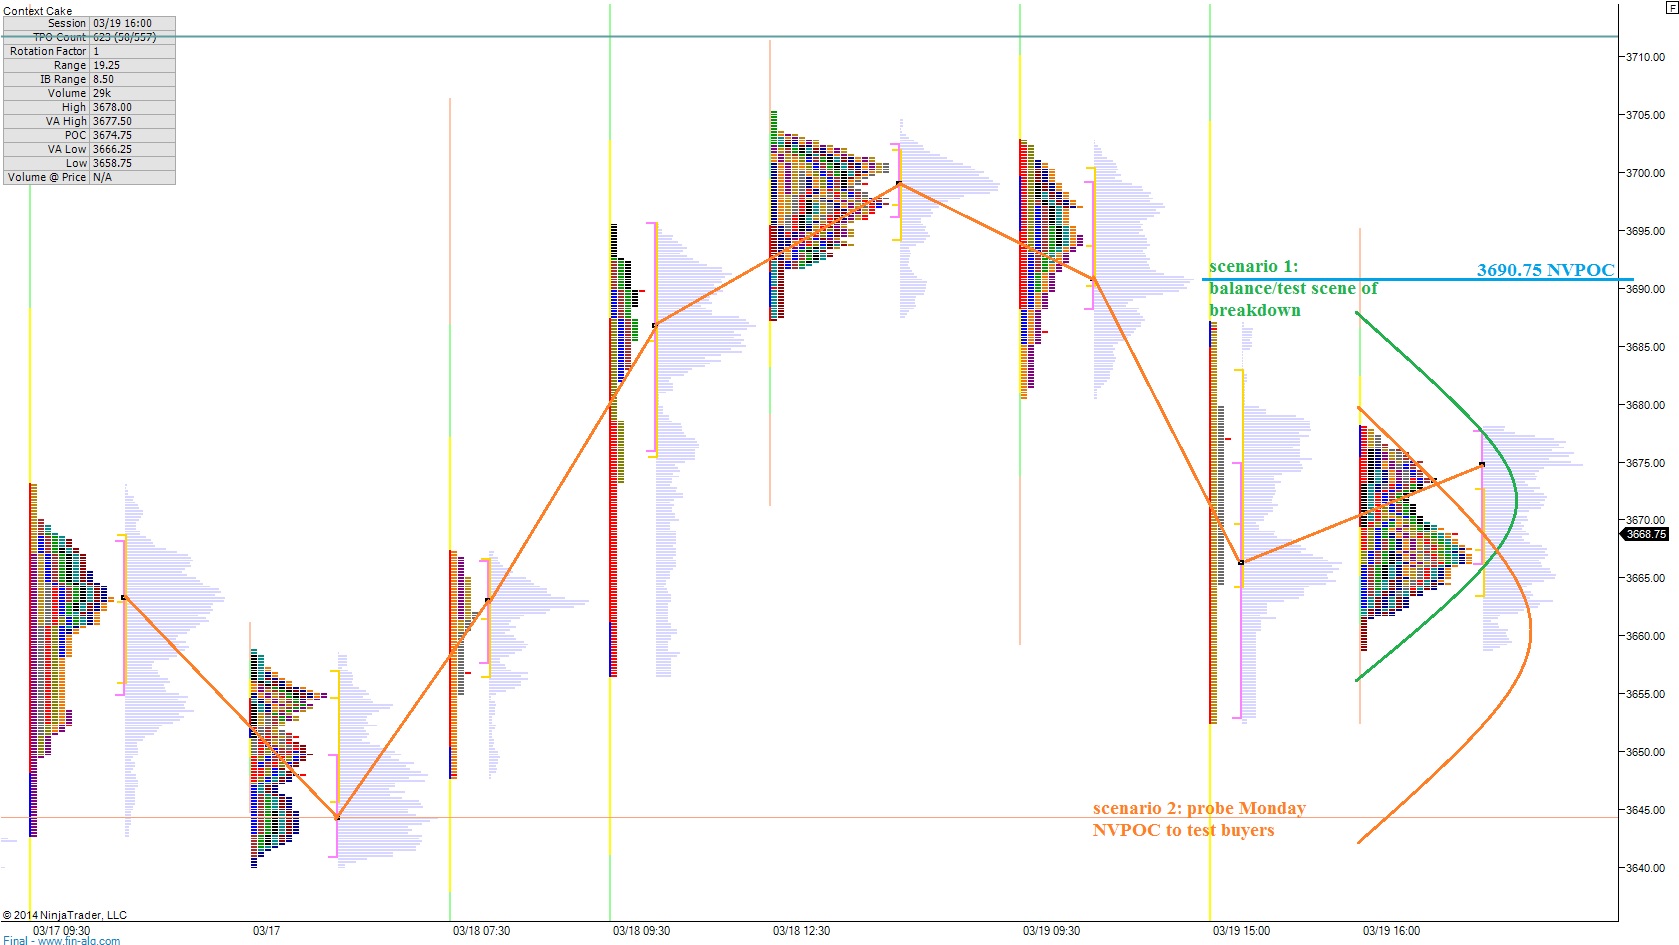
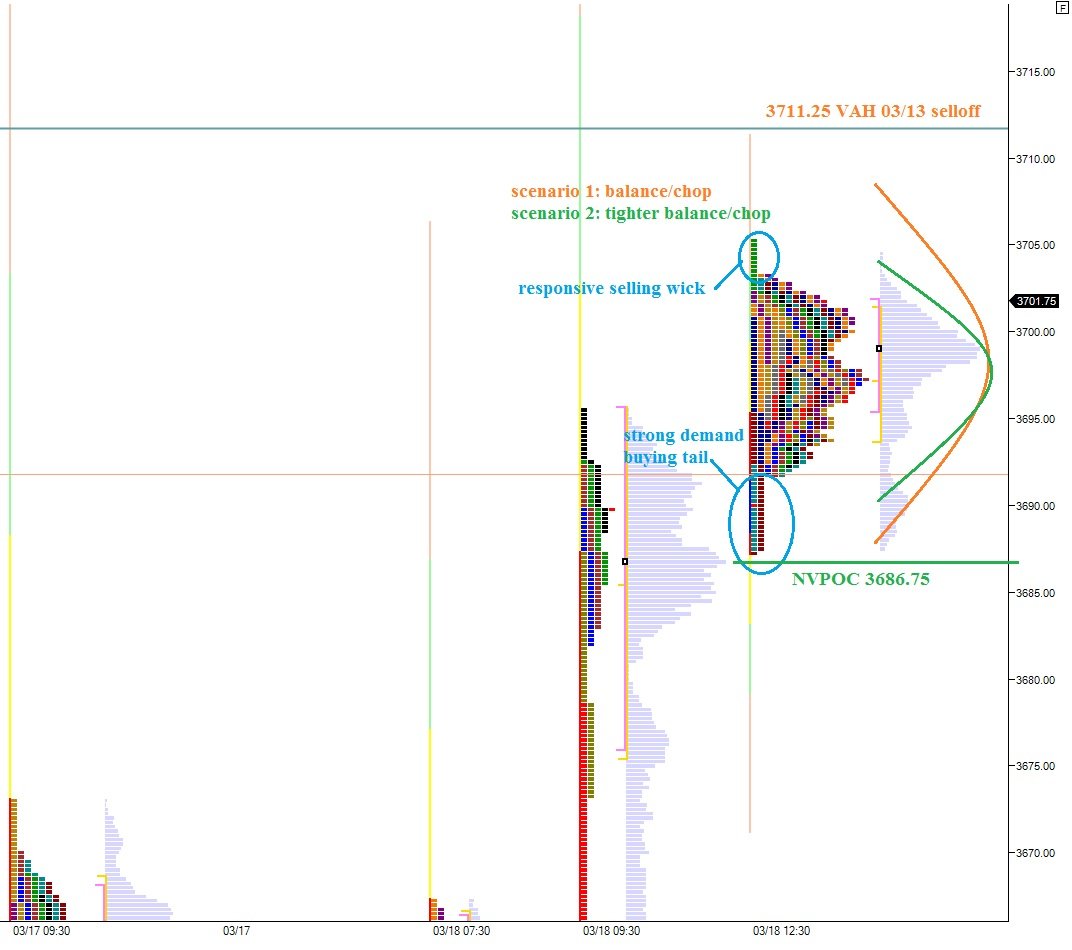
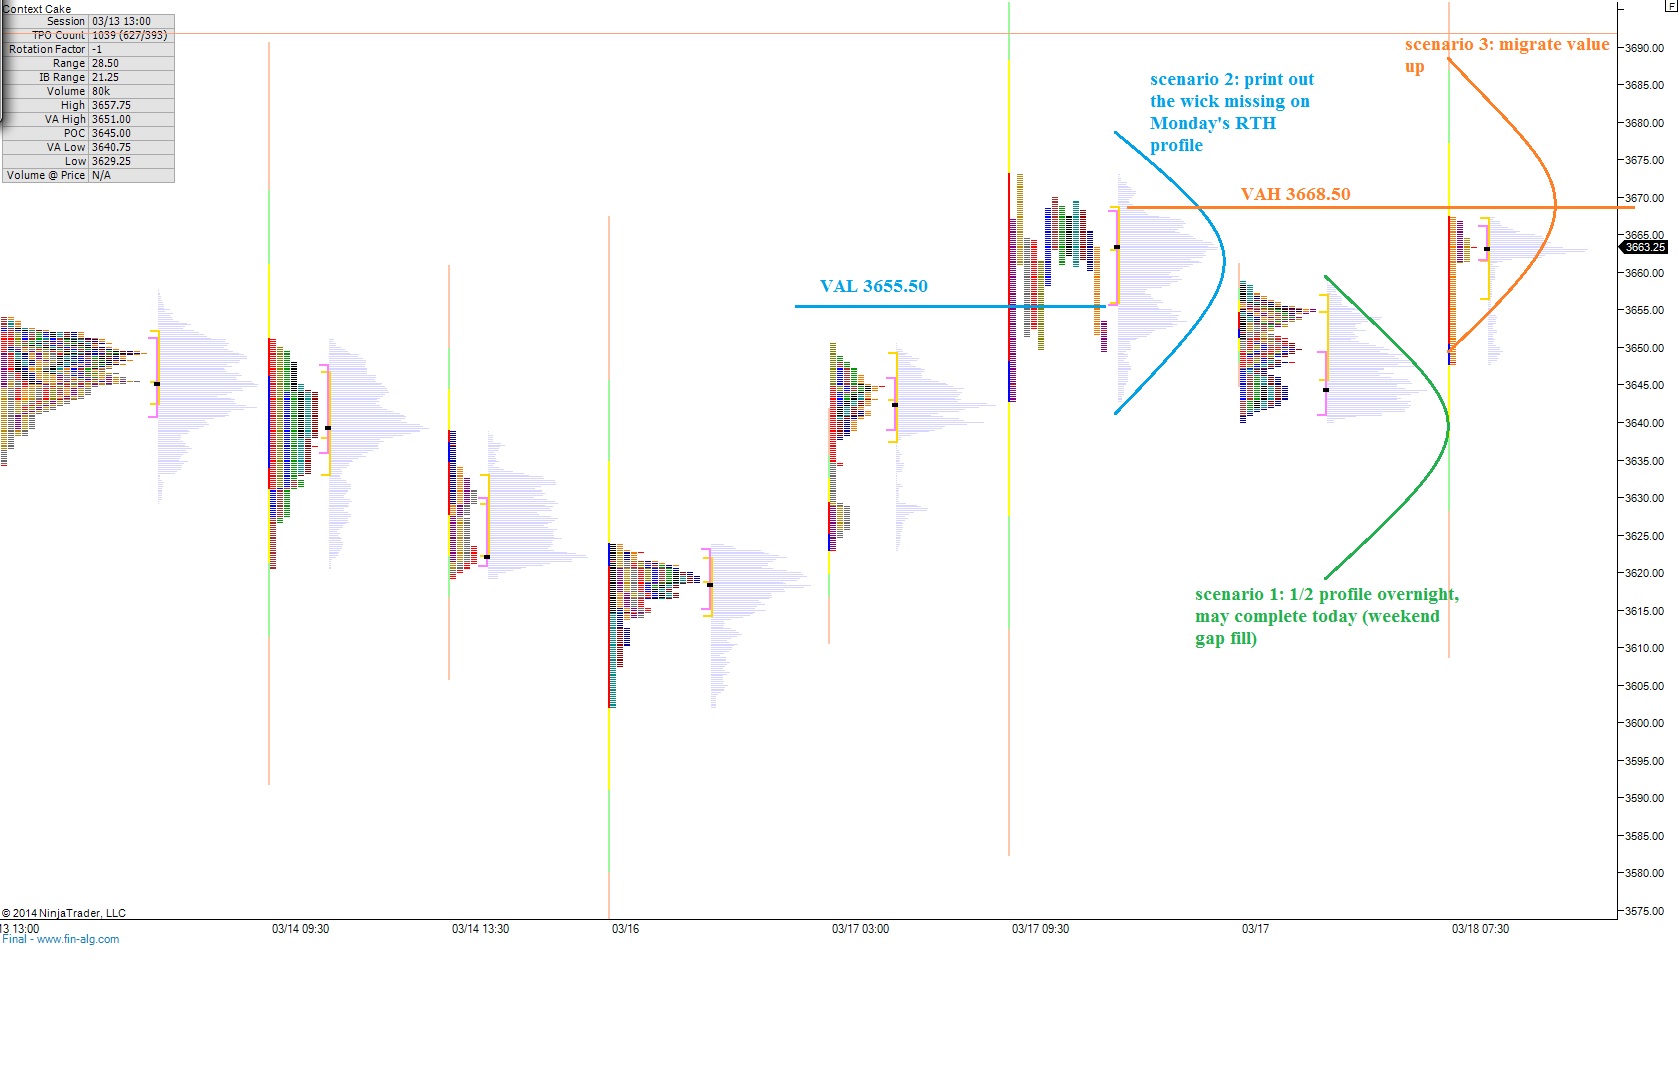
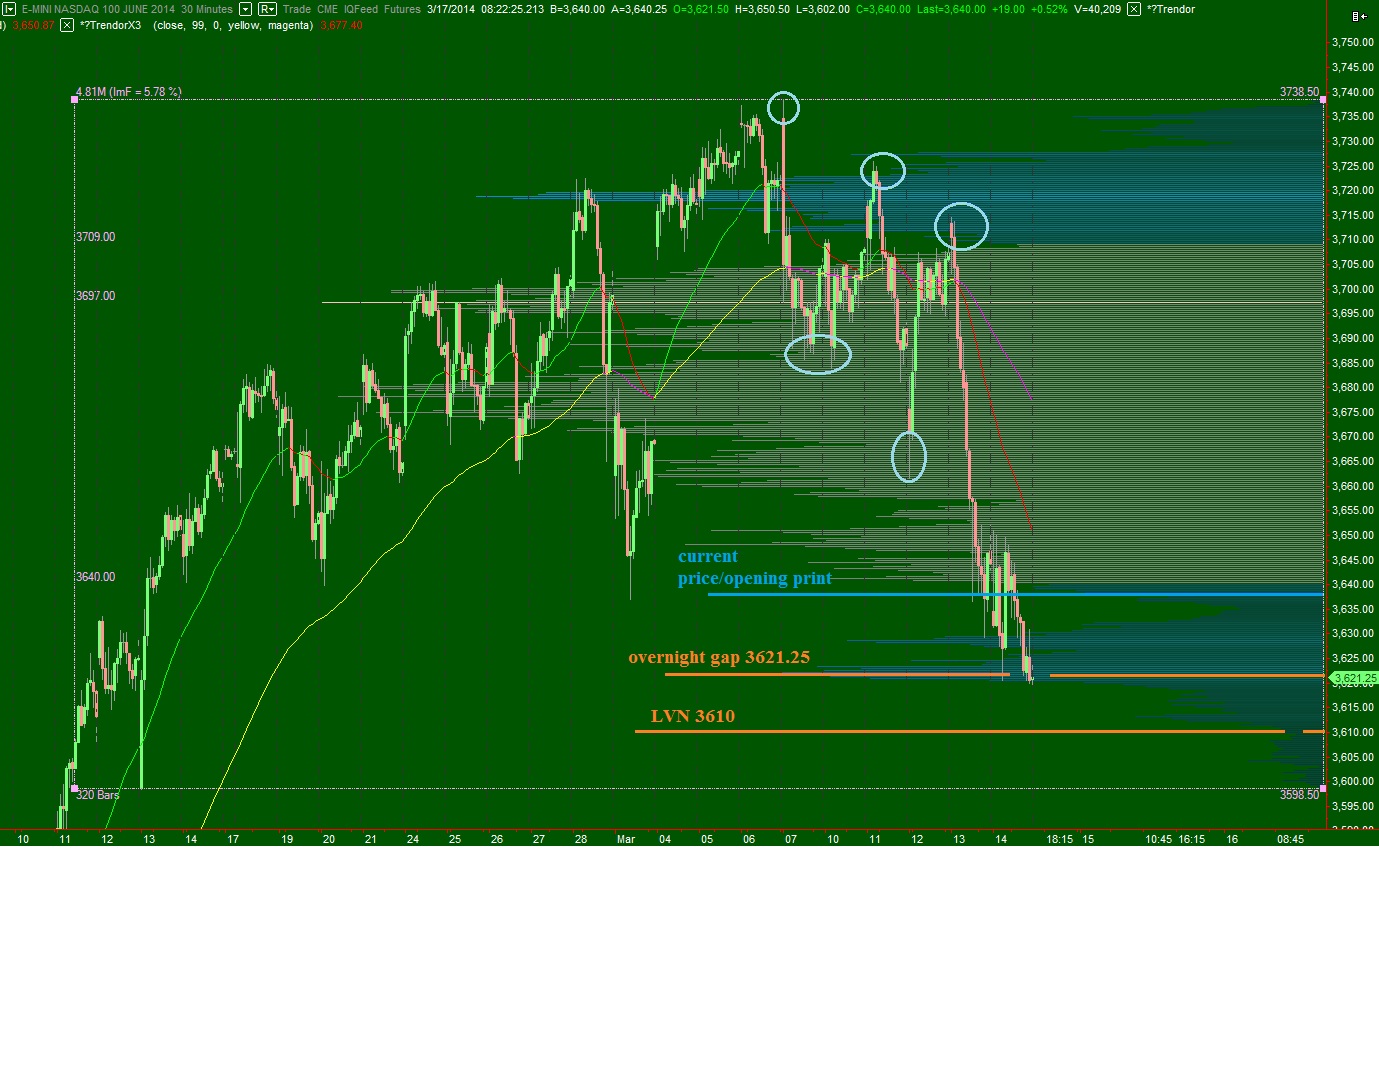
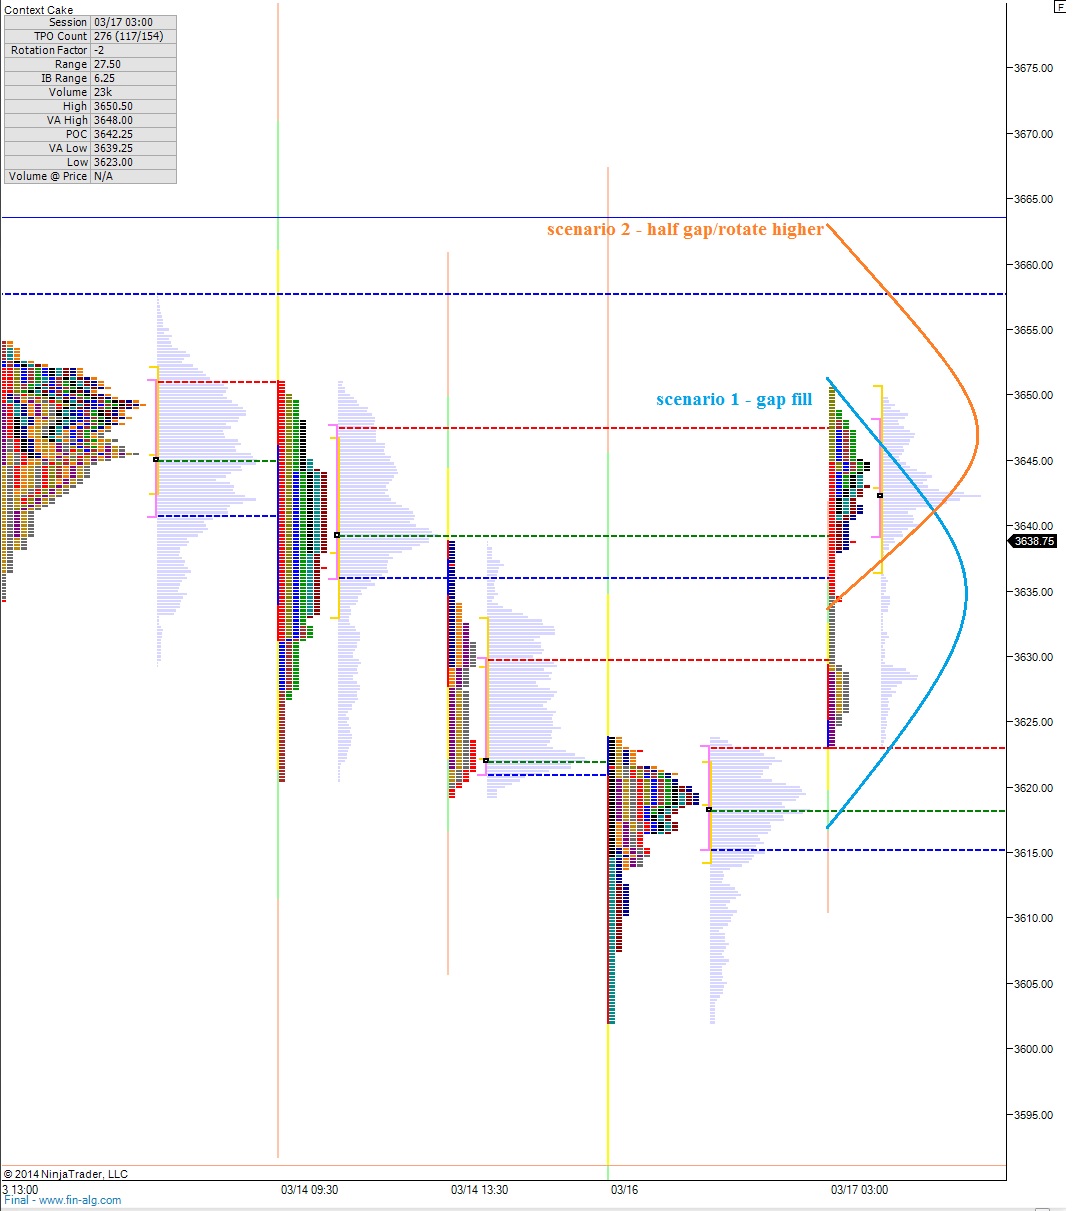
The short term auction is balanced.  After the afternoon selling Friday the market came into balance and the action carried through into the overnight session last night.  We are currently priced to open inside of Friday’s range in a thin volume area.  This may result in some fast action early on.  I have highlighted the price levels I find most interesting, as well as envisioned a few scenarios on the following market profile chart:

NQ__MarketProfile_03242014

Comments »

Opening Swing: Second Edition

Opening swing is an ongoing series where we review the opening swing for each day of trade in the NASDAQ futures and observe and discuss tradable opportunities.

The opening swing is a high and low that is set by the initial auction right after the market opens.  It is independent of time and is not the same as the opening range or initial balance.  The opening swing is the high of the first push up and the low of the first push down or vice versa.  It measures how far the Market On Open (MOO) orders take the auction right after the open.

This week is an interesting week to observe because we saw some big intraday moves as we grinded into option expiration.  One of the interesting characteristics of Monday and Tuesday was the inability or impatience of the market during the opening swing.  It seemed as if no MOO sell orders existed and the auctions were unable to set opening swing lows.  Instead price would set an opening swing high and then continue driving higher.  These were opening drives and without proper understanding of them a day trader can go bust rather quickly trying to fade them.

Wednesday presented the trade idea I have been envisioning, and it even came on the short side which was a bias I had for intraday trades this week.  Soon after the opening swing high was printed, too soon after, the market attempted to trade above opening swing and was quickly rejected.  It turned out to be the high of the day and if properly executed then all a trader had to do for the rest of the day was scale profits at logical price levels (like opening swing low, market profile levels we discuss in the mornings, etc.)  The influence of the opening swing levels was very clear Wednesday and was all the information you needed to properly trade the inaugural discussion from Janet Yellen.

Toward the end of the week, it was interesting to see how prior O/S levels affected trade.  I have already gotten too wordy.  Check out this week in the NASDAQ from the view of the opening swing.  If you are as eager as I am to trade this auction action, be sure to compare each day’s opening swing to my morning market profile report for a comprehensive view of live auction theory application.

MONDAY:

NQ_OS_03172014


TUESDAY:

NQ_OS_03182014


WEDNESDAY:

NQ_OS_03192014


THURSDAY:

NQ_OS_03202014


FRIDAY:

NQ_OS_03212014


Comments »

Building Energy

The NASDAQ drifted higher overnight and price is currently trading outside of yesterday’s range.  In terms of potential for a wide range/volatile day, this is as elevated a condition as the market can offer.  Today is also option expiration which can really result in some unique auction activity.  However it is ultimately order flow that dictates the direction of the market inside the day timeframe and we should be keen in our observance of it.

The long term auction continues to show buyer control.  We tested recent lows last Friday and gapped when we came back to market Monday morning.  We have held that gap higher all week.  We need to keep this gap in mind because often these gaps get filled, settling unfinished business if you will, before the market continues elsewhere.  Overall though, the market continues to find a bid on the long term timeframe and continues to auction higher.

The intermediate timeframe is balancing.  Tuesday buyers were able to quell the price action which up unto Tuesday suggested sellers were in control of the intermediate term auction.  After we trended higher Tuesday, we saw the late-afternoon selloff Wednesday (Yellen) which was met almost immediately with a strong buying response.   This can be seen as long tails on the candles suggesting dynamic responsive buying.  Since then we have consolidated and coiled right in the middle of intermediate term balance.  The market is building energy for its next move with a very clean auction into value.  I have highlighted our current balance and a few other observations on the following volume profile composite:
NQ_VolumeProfile_intermediateTerm_03212014

The short term auction is buyer controlled.  This can be seen as value drifting higher over the last few market profile distributions.  The overnight action in particular shows buyer control as it presses value up into the top of Tuesday’s action which marked the high point thus far on the week.  The key for buyers is to press above 3711 and gain acceptance above the level.  That could be the progress needed to invigorate initiating buys in the afternoon.  Otherwise we may see more backing and filling as intermediate term players continue to slug it out.  I have highlighted a few key price levels and observations on the following market profile chart:

NQ__MarketProfile_03212014

Comments »

The Discovery Process

Yesterday we saw the effects of overhead supply and how sometimes the weight of said supply becomes too great and liquidation ensues.  Many a market commenter will cite the Fed meeting as the reason for the move, but an understanding of the auction and balancing process yields the potential directional bias of the market.  An event such as the Fed simply accelerates the process of price discovery.

The long term auction continues being controlled by the buyer.  This can be seen clearly on a weekly chart of the NASDAQ Composite index which shows a pattern of higher highs and higher lows dating back to October 2011.  The daily chart suggests a similar buyer control with prices continuing to hold their recent low around 4200.

The intermediate term auction is in balance.  When we sold off yesterday afternoon, the market was able to find a higher low.  Responsive buying down inside Monday’s range was forceful enough to reverse the directional liquidation occurring.  Price eventually settled near where we hypothesized value to be yesterday morning, 3678.25.  I have highlighted the inflection points which resulted in the market coming into balance, as well as a few key action price points on the following volume profile composite:

NQ_VolumeProfile_intermediateTerm_03202014

The short term auction is in balance.  I have traced the movement of value since Monday and you can see it drifting and consolidating much like a sine wave with increasing frequency.  Sticking with Monday, 3/17, we left behind a naked VPOC at 3644.50.  This level may be targeted by sellers today should we see any follow through by them.  Overall my expectation is for the market to chop about and settle a bit early on before deciding on a direction.  I have highlighted a few levels I will be watching today as well as a few scenarios on the following market profile chart:
NQ__MarketProfile_03202014

Comments »

Mean Revision

NASDAQ futures are currently trading just above the high print on yesterday’s trade in an overnight session in a relatively quiet and balanced overnight session.  The first test above yesterday’s high occurred early this morning and found responsive selling by price since stabilized and is holding the high water mark.

We printed a trend day yesterday which started with a strong opening drive and continued making successful auctions higher for most of the day.  Once a trend day is recognized, a consistently profitable play is to find a place to get a trade on in the direction of the trend and hold the position into the following session.  That is because any entry during a trend day offers a near risk free entry into the following session meaning, at some point in the following session price will trade beyond the direction of the range of the trend.

The short term auction is buyer controlled.  This can be seen in the migration of value back higher and the buying tail present on our current profile.  As we approach the cash open, price action has stabilized near yesterday’s highs and is coiled tight.  It appears the market is waiting for news of catalyst before deciding short term direction.  We have an FOMC meeting this afternoon which may be what has the market on pause.  I have highlighted a few scenarios for this morning as well as interesting levels on the following market profile chart:

NQ__MarketProfile_03192014
The intermediate term auction is back in balance.  The sellers were quick to lose control of the intermediate term.  Yesterday morning it appeared they may sustain control by holding Monday’s high and printing another lower high.  However and entrance by the long term participant drove price through most areas of resistance and reverted price back to the mean or volume point of control at 3699 (or 3700 if you prefer round numbers).  Price and value always converge it is just a matter of how they do so.  In this case, price reverted back to value and not the other way around.  This suggests the current value of the NASDAQ is perceived as about 3700 by buyers and they were aggressive buyers until the level was reached.  This begs the question then, why did I begin shorting the index yesterday?  My hypothesis is that value is actually a bit lower, more around 3678.25.  Therefore I want to participate in the discovery process by selling into this two day rally.  I have highlighted the intermediate term balance on the following volume composite chart:

NQ_VolumeProfile_intermediateTerm_03192014b

Even though I am confident in my short and willing to add to it upon further strength, I realize the long term auction still favors they buyer.  Thus this trade carries a lower probability then a mean reversion long trade.  I am willing to cut this loss if price is accepted above   ~3715.

Comments »

Respect The Seller

Index futures are higher overnight after briefly taking out yesterday’s low late last night.   Yesterday the low of the day was printed within a few minutes of the cash markets opening for trade at 9:30am when an opening drive erupted.   The opening drive gives us a sense of the responsive buying demand that exists down at these bracket lows, and it gives merit to the idea that the intermediate term may sustain balance.

The long term auction in the NASDAQ Composite shows control by the buyer.  This control can be seen as a series of higher lows and higher highs on the weekly price chart.  Two weeks ago, we printed an outside candle on the weekly candle which is yet to confirm as a reversal candle lower.  We need to see follow through downward before considering the potential for a reversal on this long term timeframe.

On the daily chart, the auction is still buyer controlled after their success in holding the support at 4250 from Friday-to-Monday.  We are closely watching for the next leg higher to make new highs, otherwise the recent support becomes vulnerable.

The intermediate timeframe auction is seller controlled.  Their control can be seen dating back to March 7th when a series of lower highs and lows began to print.  We briefly breached intermediate term bracket lows on Friday before gapping back into the balanced bracket price yesterday.  The key here is to not be stubborn, and if the market succeeds in printing a lower high to consider the intermediate term to be back in balance.  Note how the low volume node at 3668.50 was converted into resistance with relative ease by the sellers.  For now, we remain seller controlled.  I have highlighted the intermediate term auction on the following volume profile chart:
NQ_VolumeProfile_intermediateTerm_03172014

The short term timeframe is interesting.  Yesterday’s opening drive produced a wide initial balance.  So wide in fact we never breached it for the rest of the session.  This is called a normal day and they are anything but.  Normal days show a lack of directional conviction by both parties to the auction.  However, in not losing sight of the intermediate term, it was clear the up move was likely to fade.  Couple yesterday’s afternoon fade with the overnight action and you can see we are balanced and indecisive in the short term.  I expect some chop early on today as we deal with the imbalance of the overnight session after yesterday which was a relatively big up day.  I have highlighted a few scenarios and the levels I will be watching on the following market profile chart:

NQ__MarketProfile_03182014


Comments »

Trading The Overnight Strength

Equity futures printed an abnormally large range overnight, one that began with a selloff before finding strong responsive buying activity which triggered a rally in the Globex hours.  As of this post, the NASDAQ futures are set to open inside of Friday’s range but outside of the value area set Friday.  These conditions are slightly out of balance and present an elevated risk/reward environment.

The long term control of the auction is buyer controlled.  This can been seen on a weekly chart of the COMPQ, however the daily chart is not as clear.  The daily chart still presents a picture of buyers in control, however that control is being tested as we made a slight lower low on Friday verses March 1st.  This week we will be closely monitoring any sort of bounce that materializes and the potential of price to form a lower high.  This would change the character of the long term auction from being buyer controlled to balance.

The intermediate term timeframe is seller controlled.  We have seen prices make a series of lower highs and lower lows dating back to March 7th.  The price action has been fast and choppy with the momentum edge favoring selling.  Price slid out of balance Friday and closed near the lows.  Above we have a large overhang of supply.  How the market reacts to this supply will be telling this week.  I have highlighted the intermediate term volume composite on the following volume profile chart:

NQ_VolumeProfile_intermediateTerm_03162014

The short term auction is balanced.  We have overlapping value areas and price stabilizing inside of these value areas.  The overnight inventory is long, thus I am looking for prices to press into these overnight longs.  Early on, I will be on watch for a gap fill trade back down to 3621.25.  If you refer to the intermediate term profile above, you can see we are set to open on top of a volume cave.  Price can quickly move through this area which would aid sellers in pressing for the gap fill down.

I have envisioned a scenario for today on the following market profile chart:


NQ__MarketProfile_03172014

Comments »