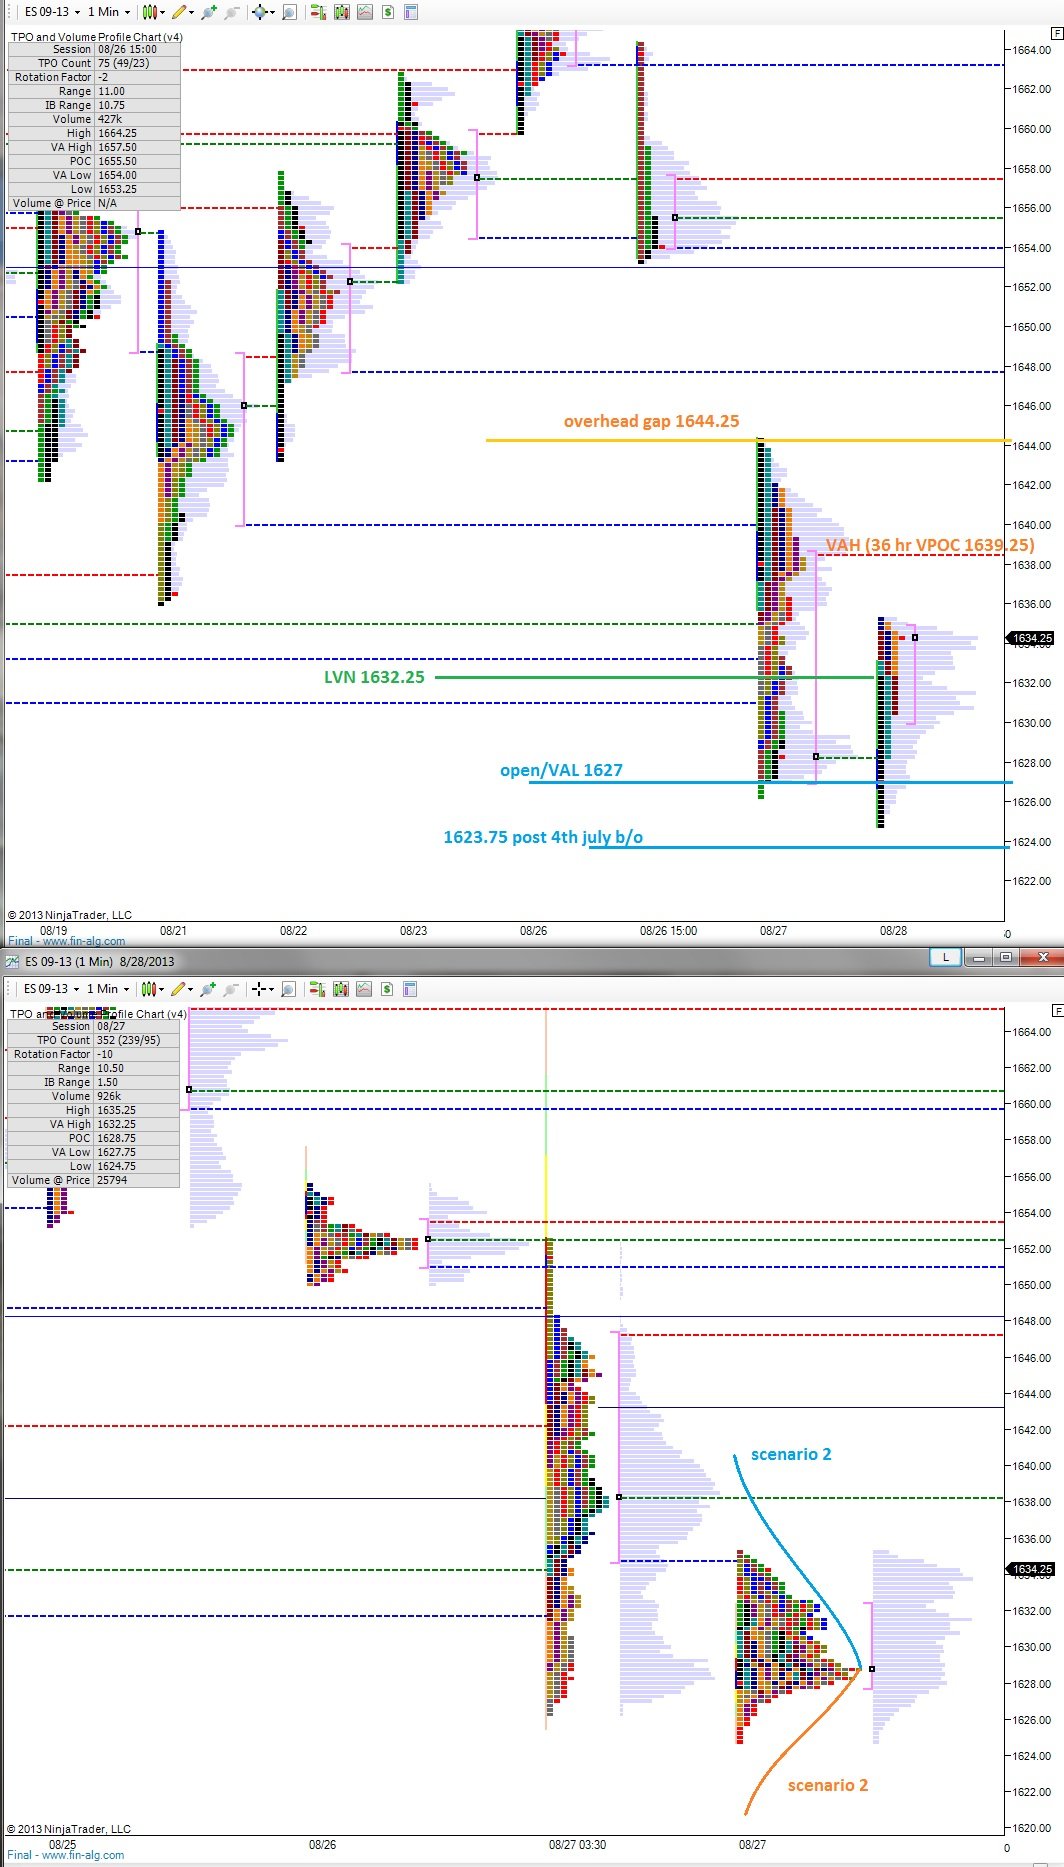
It has been an interesting session thus far in the S&P futures, where we’ve seen strong volume overnight and near the open but since then it has dropped off significantly. However, the market has found accumulating buyers after a reactive-type rejection at 1624.75, which is only one handle above the initial breakout point from the post 4th of July rally.
As of this update, the momentum has made a slight turn in the favor of the bulls intraday, and we’re working through the wide value area established yesterday. A full rotation of the value area would take price to 1639.25 which also marks the VPOC of the last 36 hours of activity. It’s a logical bull target.
Downside risk increases if we lose today’s lows, and especially if we see the market accepting trade below 1623.75.
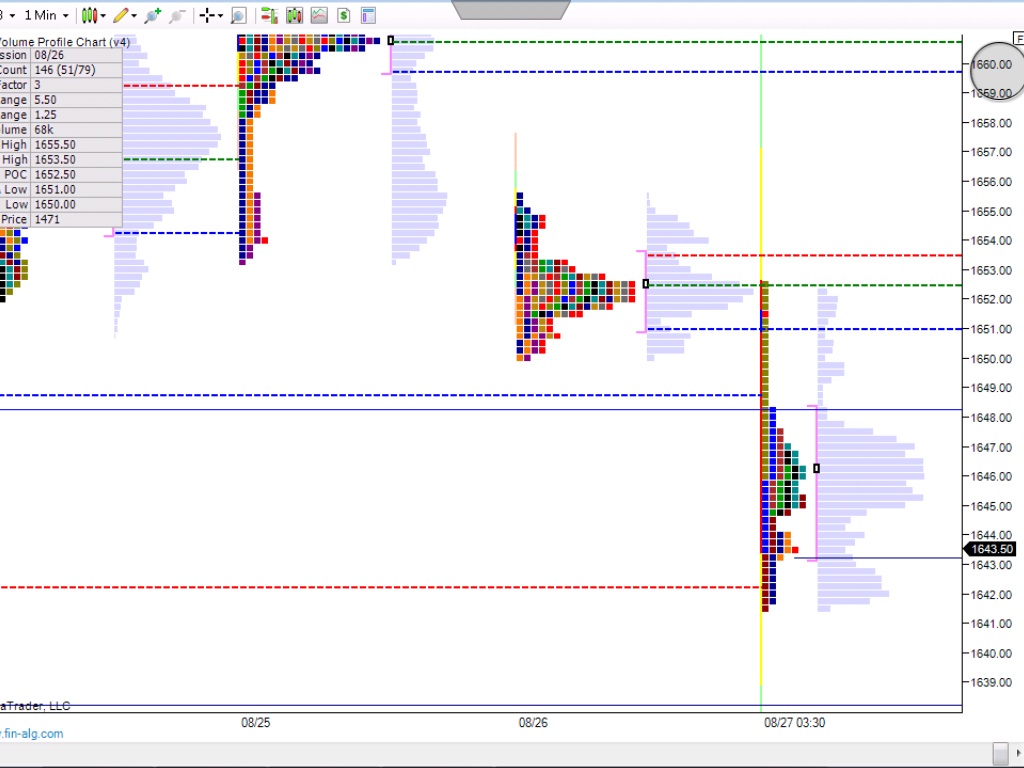
I’ve highlighted a few possible scenarios on the following 24 hour market profile chart and noted potential areas of opportunity on the RTH profiles:
The S&P futures are lower by nearly 13 handles giving back most of the progress the bulls slowly accomplished since last Wednesday. There’s been an above average amount of volume done and the velocity on this follow through move is higher than normal.
As I write, the bulls are attempting to stabilize price near 1642. This level marks the value area low of the lowest distribution from our recent 8/21 – 8/22 swing low. Failure to establish support here (trade sustained below this level) opens the doors for a retest of the swing low at 1631.50 which is a reasonable seller’s target if we see a liquidation trade occur.
Should there be a full fledged panic liquidation lower, beyond the swing low, I will be looking for signs of buyers at 1623.75, the starting point of the 4th of July rally.
It’s been a while since we’ve seen this fast of a move overnight, so I’m interested to see how it’s received during the open. In terms of momentum, although rapid, we’re already into the third dip. Bar complete liquidation conditions, this downward move is already long in tooth. The dynamic action also left plenty of unfinished business (incomplete profiles) in its wake.
A healthy, rational market could rotate higher and auction levels like 1650.75, the scene of the overnight breakdown and eventually and the low volume node at 1653.75. Eventually, it would come as no surprise to see a more thorough auction of the entire range from 1659.50 (very key level, lots of supply trapped above) to the 1653.75 level.
I don’t have the technology to draw out these scenarios today, so you’ll have to visualize them. But we can still give a reasonable expectation to seeing the market stabilize and properly auction the above levels if buyers are able to perceive today’s pricing as a discount.
A gap and go situation although uncommon is possible today so use caution and predefined stops with any attempt to fade the market.
The S&P futures printed nearly a 10 handle range overnight, printing a fragmented profile in its wake. The lack of any symmetrical shape clues us to the lack of balance in this price range.
As we approached midnight a a rally ensued but was entirely given back. We didn’t quite make it into the gap above 8/15 before supply came into the market. Going forward this week, it will be interesting to monitor any further strength in the market and whether or not price takes out today’s globex high at 1667 since swing high/lows most often occur during regular trading hours.
By this I mean we’re likely to see a more active test of the gap soon, where we can more actively assess the condition of the supply overhead.
Capturing 1559.50 was the accomplishment of the week for the bull camp. We’re trading right around this level early on. Whether buyer or sellers make the initial push from this level will be our early look into the market sentiment.
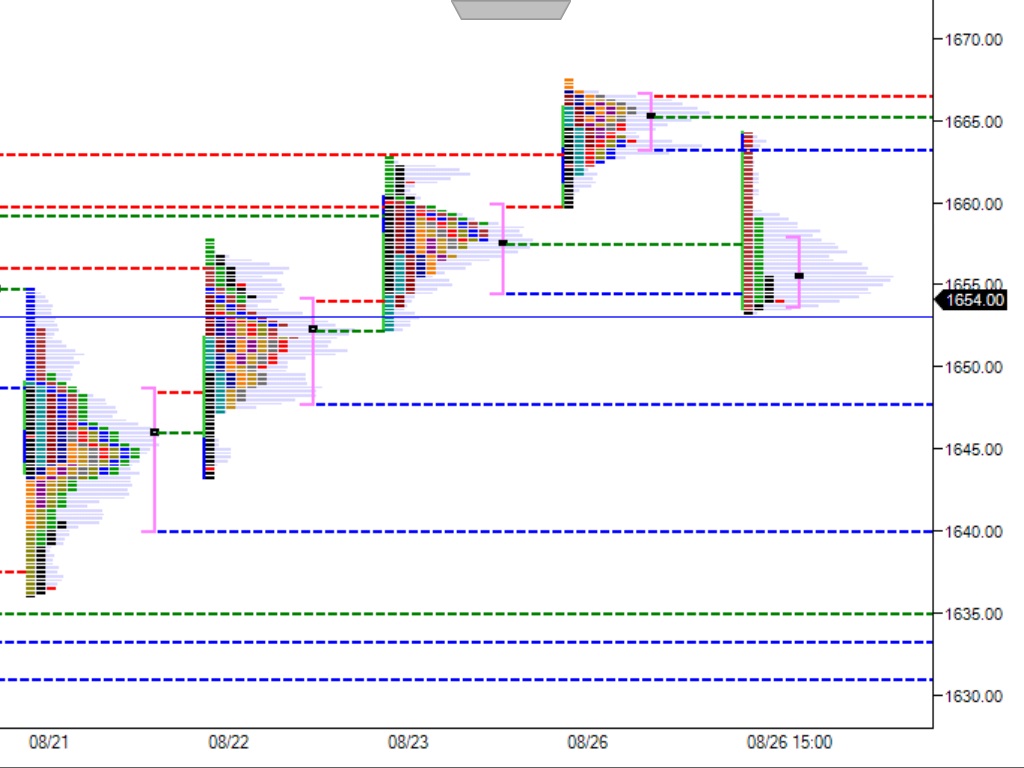
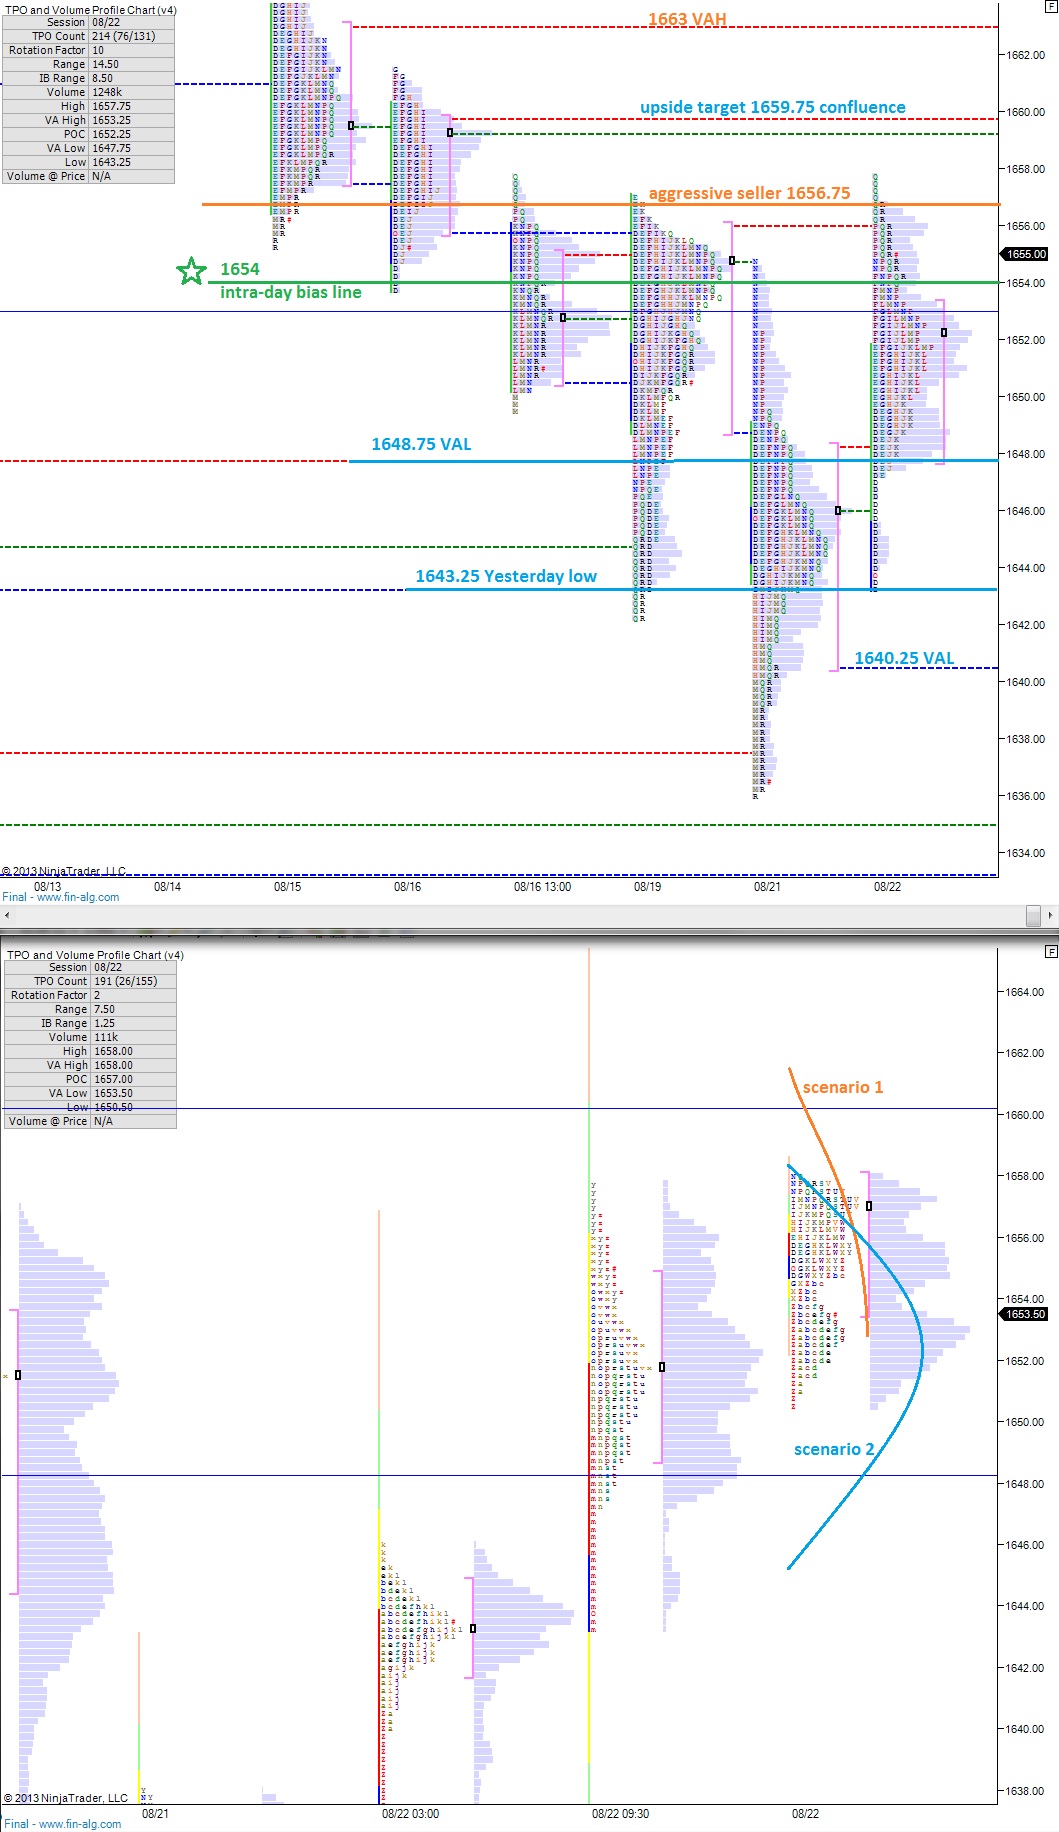
The first level catching my eye this morning is 1654. Back in July, we rallied up to this point, found quite a bit of selling force before eventually the force of buy flow became too great and sent us spiraling higher to all-time highs. The price level wouldn’t be visited again until late last week, where buyers worked adamantly to convert the prior resistance into support.
Since losing the level, we’ve tested it several times, and it’s been an environment where sellers are absorbing buy flow and reacting aggressively. Overnight, we’ve churned around this level, but oddly enough, the price level marks a low volume node on the profile. Price continues to behave like two magnates with the same polarity at 1654, flinging price away. Something is afoot at 1654.
Into Friday’s tape, I’ll be keen on my observance of 1654 to see who establishes trade relative to the level. As we approach the 7am hour, we’re pricing just below the level and the buyer’s momentum has stalled out a bit. It wouldn’t surprise me to see sellers making the first move today. However, control of the afternoon will be paramount going into the weekend, and they know that, which may keep sellers quiet early on.
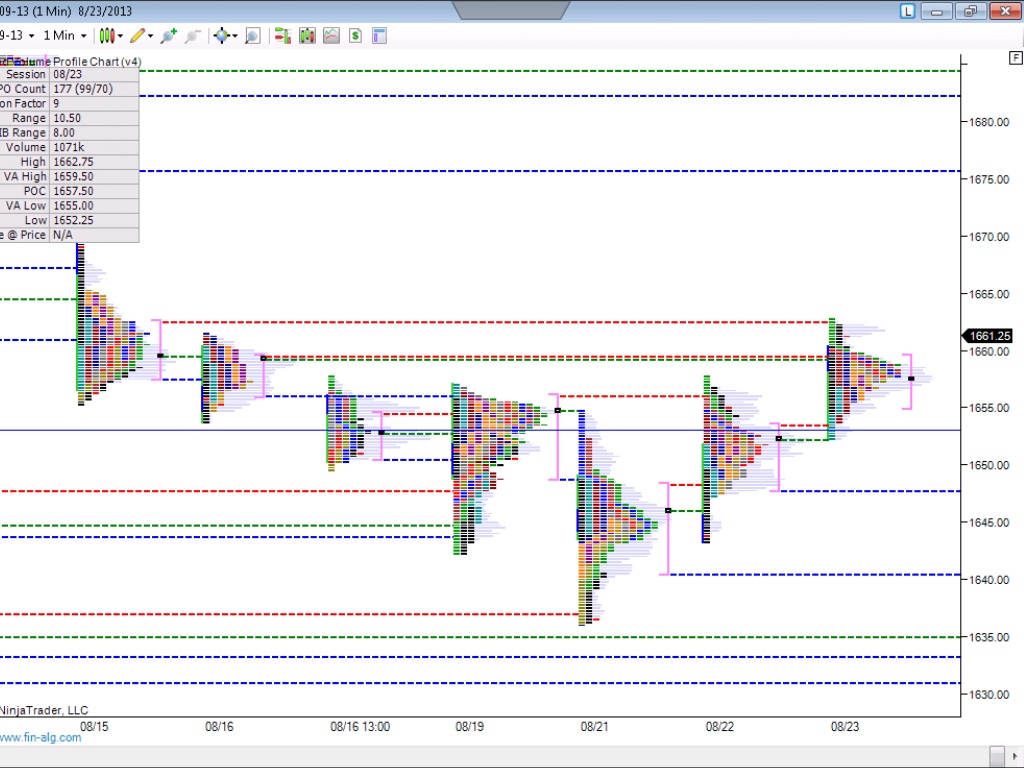
The overnight profile marked a poor high at 1658, a point shy of my upside target for the latest move. Any trade above 1660 would mark quality progress for the bulls. Sellers will want to pin us deep into Wednesday’s value area, pressing south of 1644, the opening print yesterday.
I’ve highlighted these levels of interest and also mapped out a few scenarios on the following market profile charts:
Thu Aug 22, 2013 8:38am ESTComments Off on Big Moves Overnight
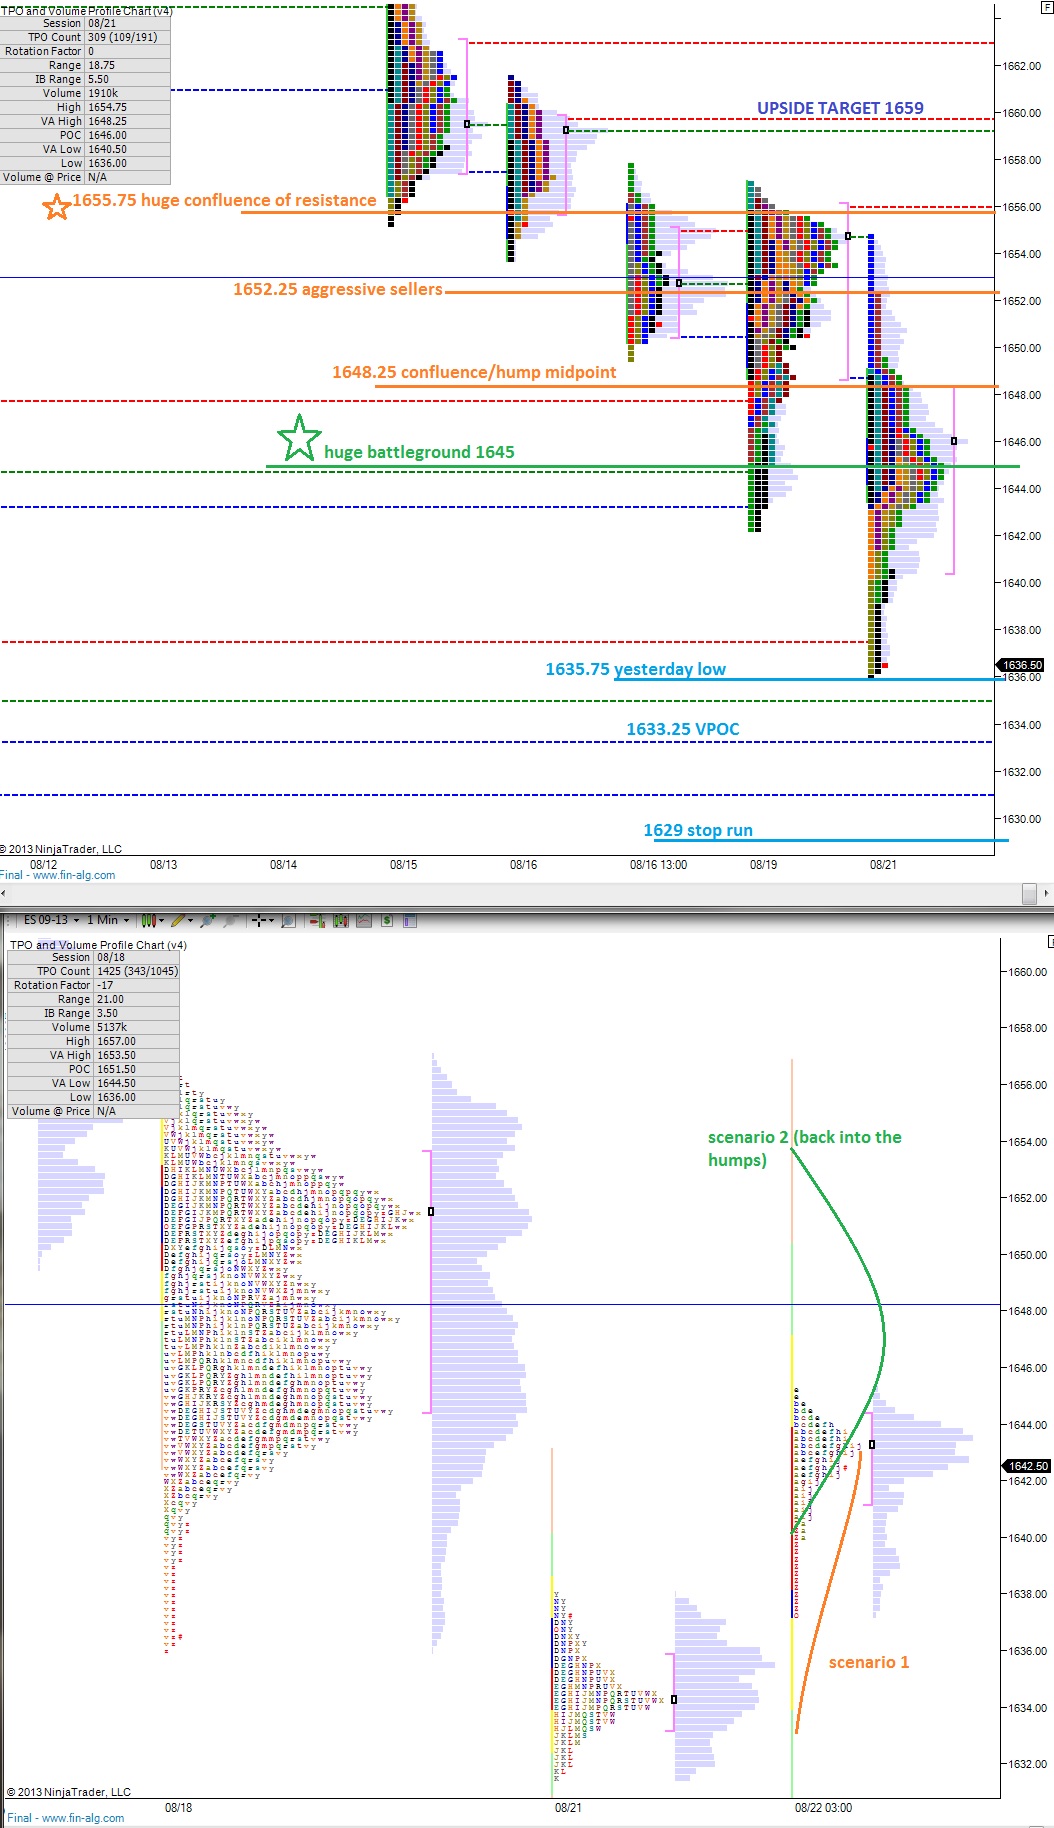
Large waters overnight in the S&P 500, where the globex session printed a 14 handle range. Wednesday’s late afternoon selloff continued into the evening before stabilizing around 9pm at 1631.50, which is right at the lows of 07/08, the Monday after Independence Day. As of this writing, the market stalled out 1645.25 which marks yesterday’s volume point of control (VPOC) and also the tip of the lower breast we observed yesterday afternoon.
The upward rotation overnight picked up steam around the European open, and put the squeeze on from 1637.75 – 1643.75. What I mean to say is the market made no pause or rotation lower throughout the entire move upward, giving overnight shorts little room to cover.
Since then the market has stalled a bit, but is aligned in such a manner that welcomes bulls back into the tape. Whether or not they will oblige early on is debatable.
I’ve split the overnight profile into two parts to emphasize the short squeeze P-shape that developed and highlighted a few scenarios for today’s trade. I’ve also marked the RTH profiles with levels of intraday opportunity on the following profile charts:
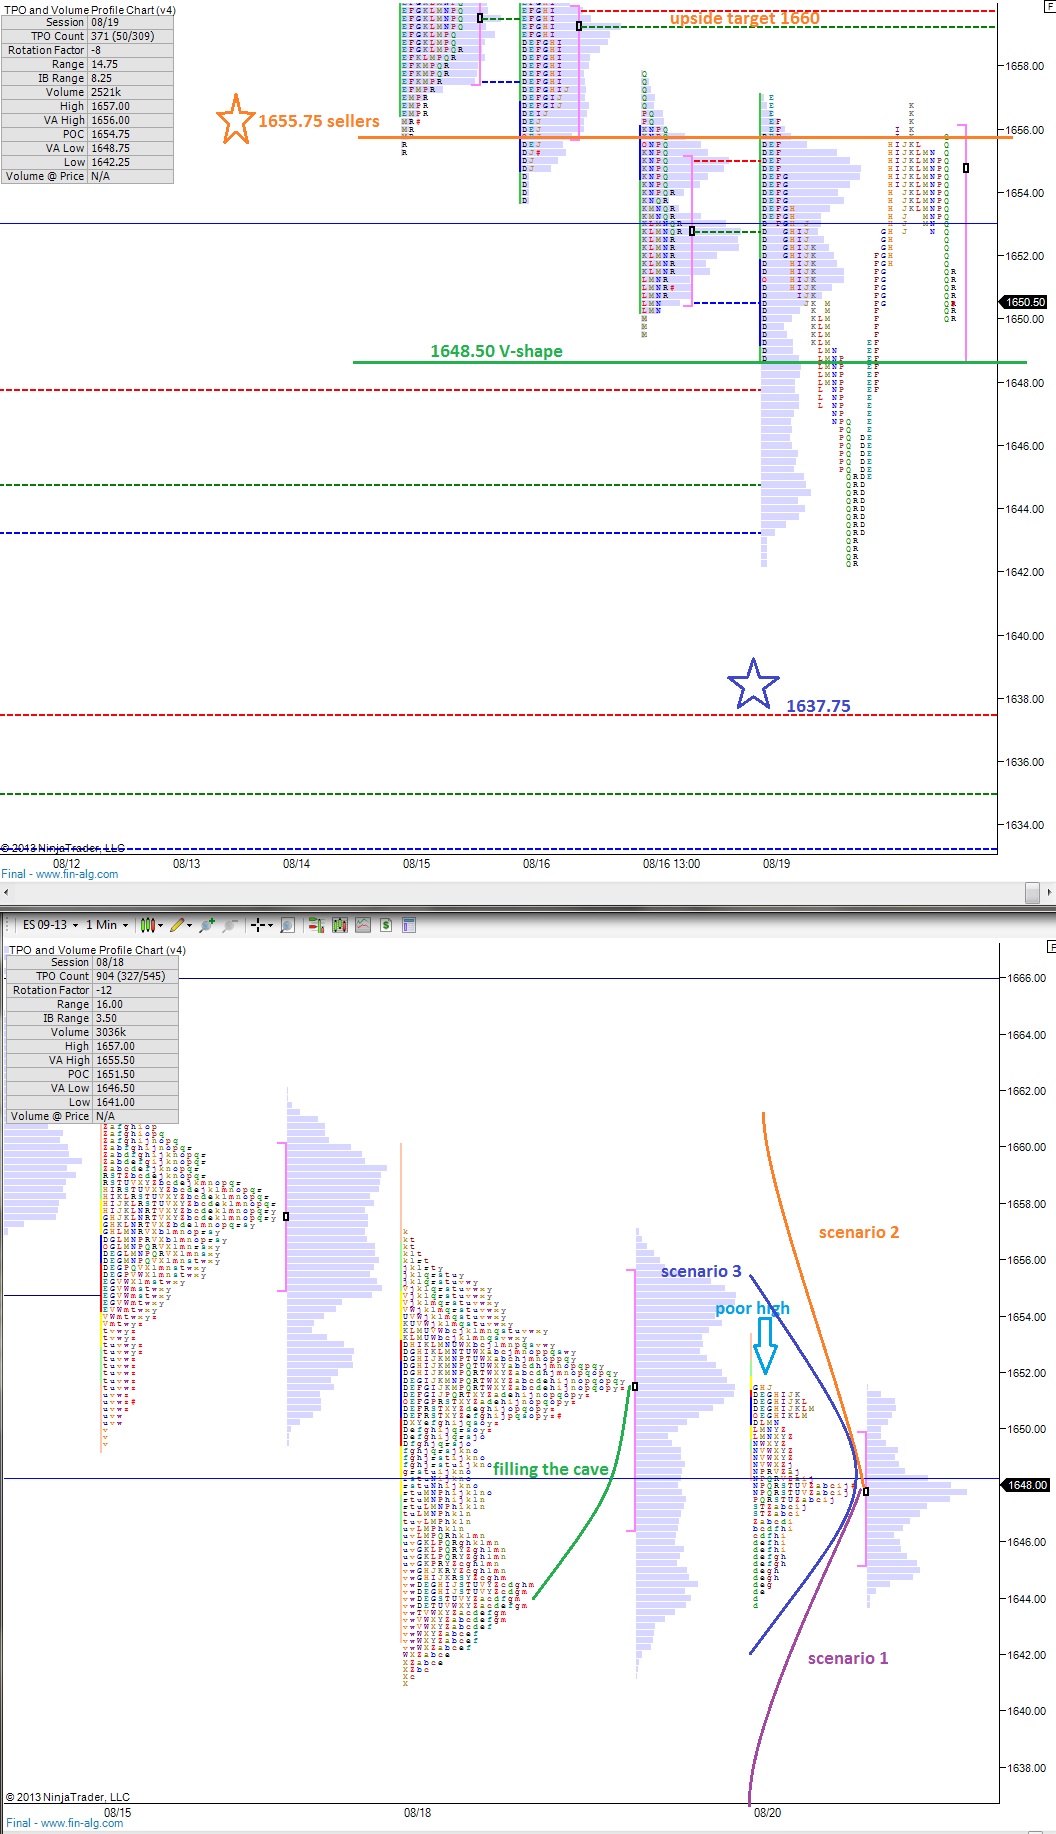
A simple price check of the S&P futures via your favorite electronic device may give you the impression the market has weakened overnight. However, when you frame the overnight auction in the context of our recent profile developments, you’ll see the market is still stuck between two large value humps and working at filling in the cave.
Market profiles are quirky characters that insist on adhering to the familiar bell-shaped distribution. It’s nature, really. For the most part, we can play along with these formations to build context into our trading.
The momentum ball is still in the seller’s court but the bulls did a decent job of stalling their progress yesterday. My initial expectation is to stay stuck in between the two value humps highlighted below until we get some Fed talk to move the market.
I’ve highlighted a few scenarios in the following profile charts, as well as marked up the relevant price levels on the RTH chart:
Tue Aug 20, 2013 5:04pm ESTComments Off on Bad Move Bulls
My book recaptured over 1.5 percent of the most recent losses today if you don’t count RVLT. Unfortunately for the Raul, RVLT very much indeed counts, and today’s respite was much less.
BLAST.
A stock down big during an all-up tape is like a cold dagger to the back. The blade is chilled even further, perhaps dipped in liquid nitrogen, when a stock gets crushed on no news…simply more sellers than buyers. But since said blade has been dipped in liquid cold nitrogen with the intent of delivering a shrilling cold death blow it is brittle. Pathetically brittle in fact, to the point where my Greek bones, formed atop Mount Olympus, shatter the dagger into a million tiny fragments at the point of contact.
Such is the eventual fate of those who bet against me in RVLT. Of that you can rest assured. I added to my position today.
Other interesting thoughts toddling through my mind: I started getting the itch to size my O long back up yesterday. I didn’t actively listen, and the thought continued in my mind all day, like a catchy merry-go-round jingle. I like O down here, but I know so little about REITS and RATES and ROUTS which made me a bit abash to sounds the horns. Consider this: O is unch on YTD and pays a 5.5% coupon. If you didn’t get a piece of the capital appreciation, you’re still making bank. Relax, and wade into this space before it is again en vogue.
YGE was my largest position coming into the day. I’ve been in this name for quite a while, wondering if I’d one day wakeup to a Chinese air raid, a Red Dawn of sorts. It hasn’t happened yet. The Chinese have been very kind to me because I’m a diplomatic gent. Respect is important in all cultures. That being said I consider this week’s action is YGE to be of the do-or-die variety because we’ve reached a critical juncture on the chart that can explode in either direction. Odds favor the long side still, so I’m expecting the gods to shine on these solar panels.
The tape as dictated by the /ES got a bit ahead of itself today. This became evident when the market didn’t rotate off the value hump at 1652.25. Given the weight of tomorrow’s Fed talk and the confluence of value around these levels, to disregard them and print higher seemed either surprisingly bullish or getting a bit ahead of ourselves. The market, our favorite arbiter, answered that question by swiftly correcting the tape into the bell. It was nothing more than a ruler slap to the bull’s knuckles IMHO.
Being about 85% long, I clearly am free of bias.
But seriously, I work hard to remain objective in my profile analysis.
Buyers entered the market early Monday morning and lifted prices higher during the first half hour of trading. It was at this point that the force exerted on the tape by the flow of sell orders became greater than the momentum of the buyers. We spent the rest of Monday auctioning lower. The action trickled into the globex session until the market finally found buyers at 1641 about the time European markets opened.
The Euro dollar firmed up overnight as well.
As the USA came online, we saw more buy flow entering the tape, pressing prices back toward the opening print from Monday near 1650. This makes for an interesting junction to open the cash market.
I’ve looked at the 24 hour profile two different ways this morning, first exclusively separating the profiles into individual distributions, and second I looked at a merge of the nearby auctions to create a micro composite of the last several days’ activity. From these two looks I’ve drawn out three possible scenarios that would not surprise me in today’s trade.
I’ve also highlighted some price levels of opportunity using the RTH profiles on the below charts:
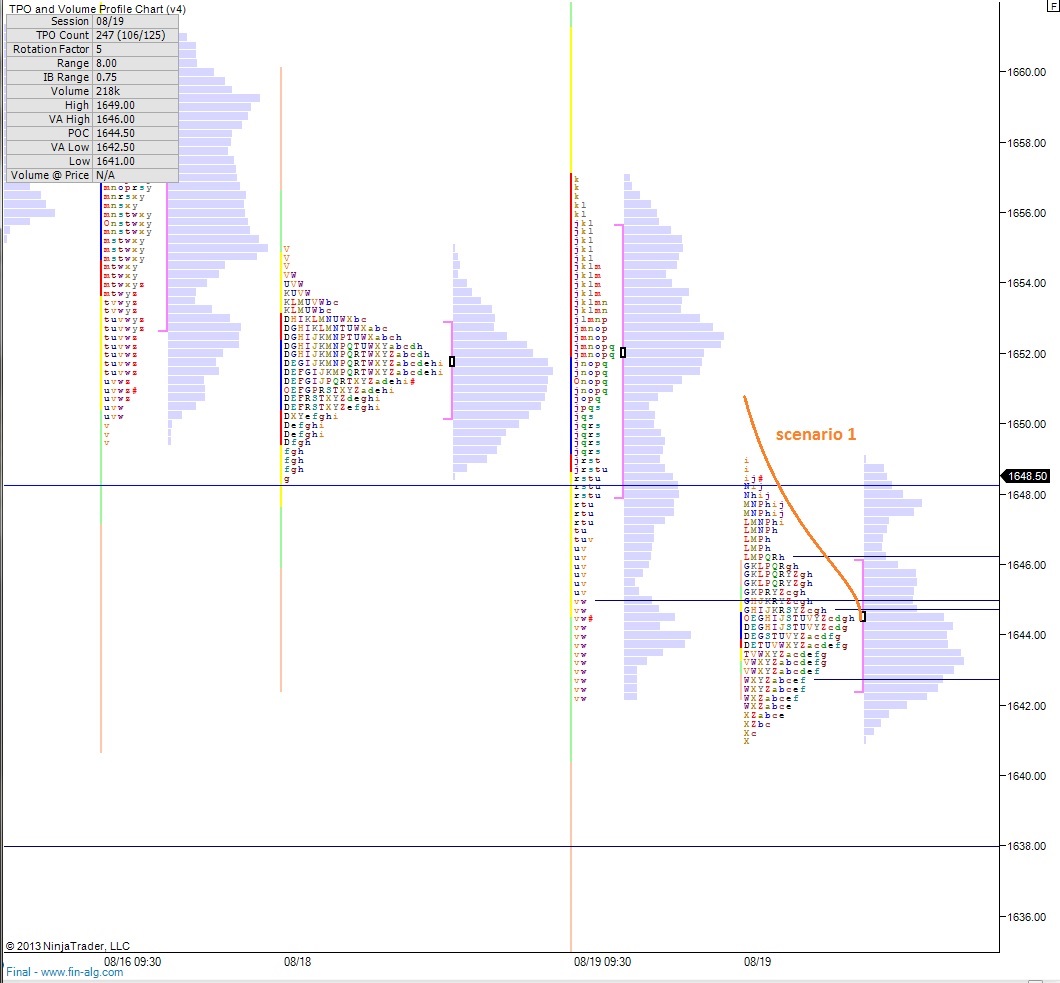
Mon Aug 19, 2013 8:21am ESTComments Off on The Big Gap Fill Marches Onward
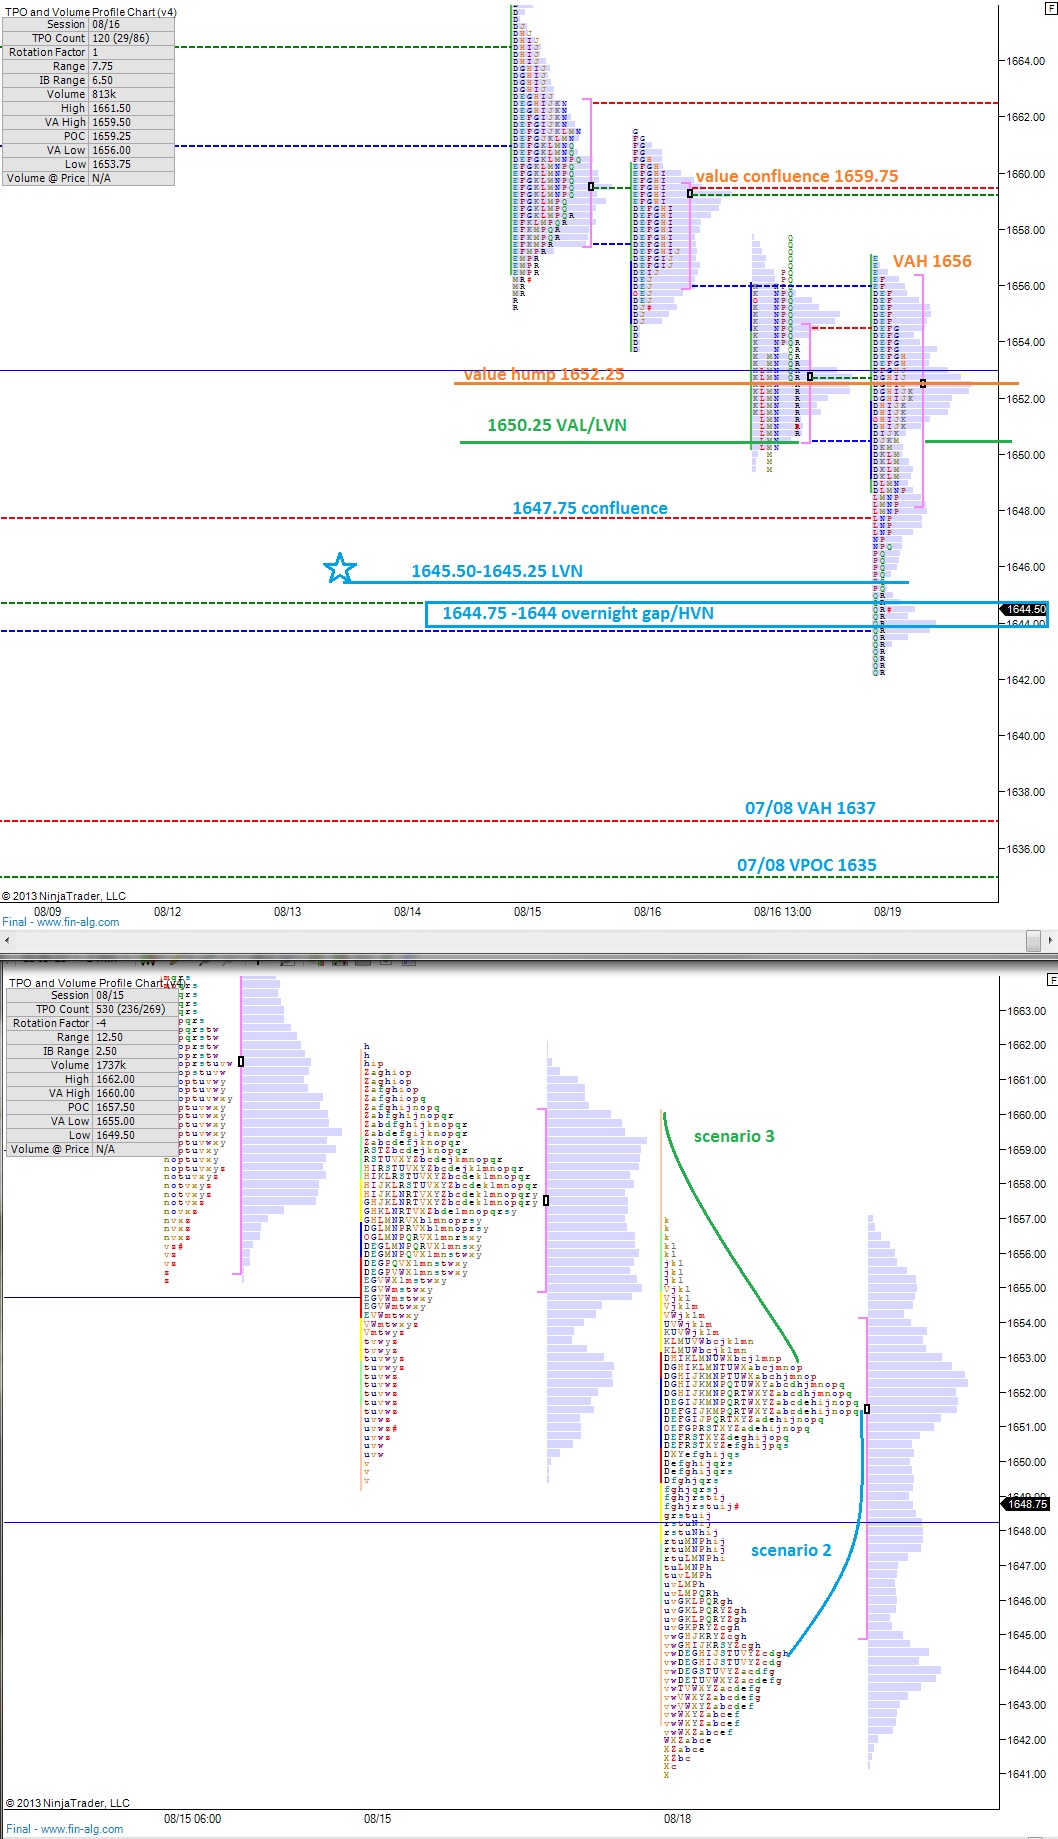
After gapping higher in July and pressing to all time highs, the S&P grinded out a sideways consolidation before experiencing the corrective trading we experienced late last week. The downward action is accomplishing the ever important task of filling a gap in the price action. When we gapped higher on 07/10, the market left a large gap in its wake, spanning from 1661 to 1653. The closing price on 07/10 was even lower, at 1644.75 which is where we need to trade to fulfill the gap.
It will be pertinent to monitor the profile levels from 07/10 early this week as we come into its range. 1647.75 marks the value area high. Spending an hour or more trading below this level swings the door wide open for trade down to the gap-fill/VPOC at 1644.75 and the value area low at 1643.25.
The S&P is currently priced three handles below the Friday closing print and this gap is another (smaller) piece of context to be mindful of. Trade back up to 1651 or perhaps to the overnight VPOC at 1651.50 seems a distinct possibility if the revision trade kicks in early.
Up above we have plenty of tradable opportunities at resistance which I’ve highlighted on the following profile chart:
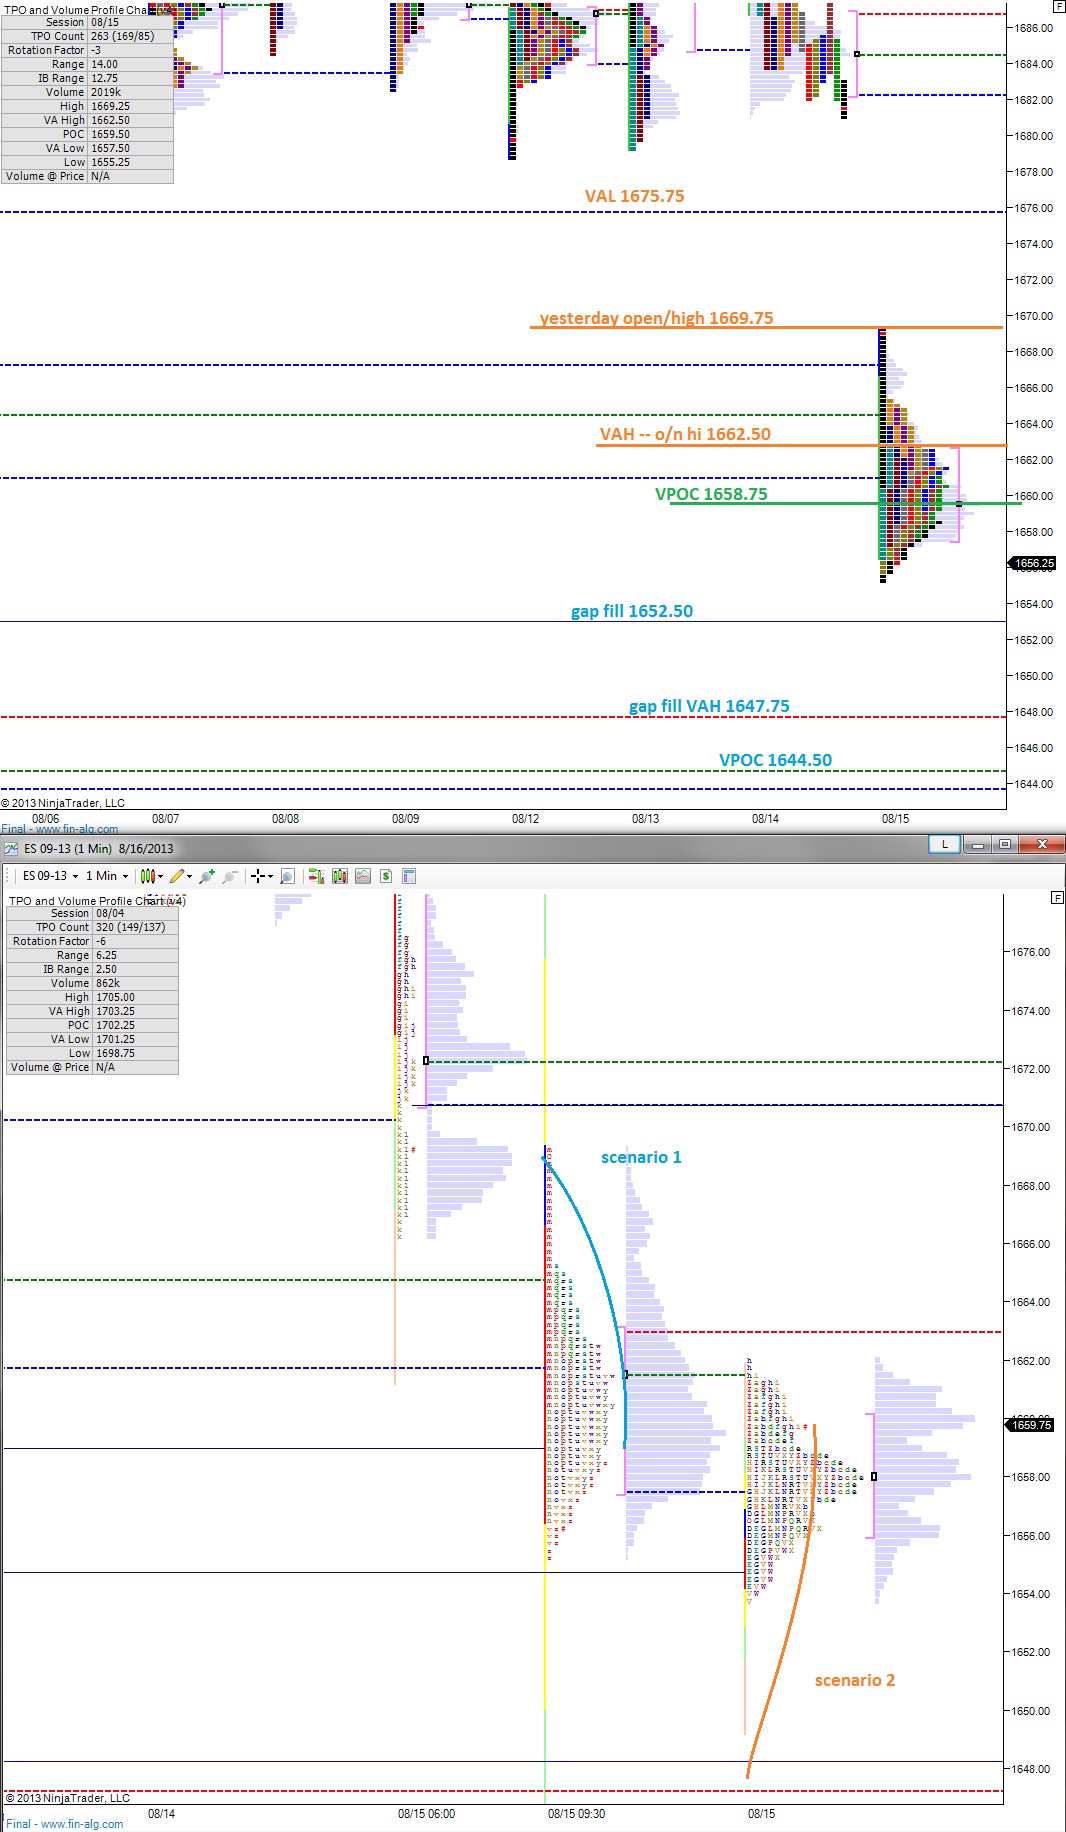
Fri Aug 16, 2013 8:14am ESTComments Off on On The Lookout For Dynamic Action
The overnight session continued gyrating and trading decent volume after yesterday’s strong move. The profile printed by the action shows a semblance of balance with the buyers working to regain a bit of control. The key achievement of the buyers overnight was setting a higher low at 1656.75. It will be interesting to see if they defend this level early on (if necessary).
Going into Friday trade, I’m interested to see if participants are as inactive as we’ve seen in other quiet Friday summer trading days, or if they’ve been lured back into the market by the dynamic action. If we see a small range session with little range extension that would tell me we’re seeing mostly local trading.
I’ve highlighted a few larger scenarios that wouldn’t surprise me to see play out on the below 24 hour profile chart. Either one of these distribution completions would firm up the auctions taking place. However, both would require a push from larger market participants, so it will be interesting to see how today plays out.