iBankCoin
Home / Tag Archives: $ES_F (page 5)

Tag Archives: $ES_F

Clear Sentiment Emerges from The Fog

This morning took a bit of extra chart work to get the right context built.  I want to sum my thoughts very briefly before turning your attention to the following chart diagnostics for the S&P 500 and what they suggest about the sentiment of the overall market.

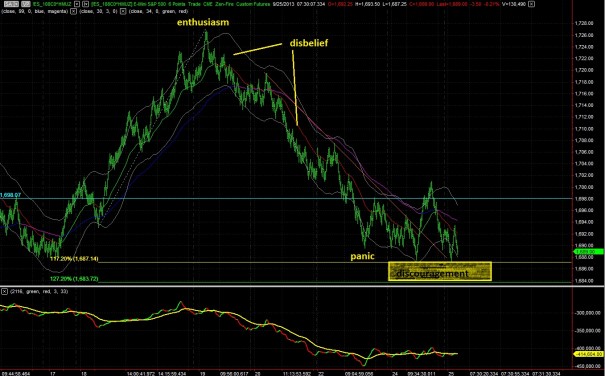
First I present a bar chart with some sentiment commentary.  You may recall this chart’s similarity to the frequently referenced Option Addict sentiment chart.  To my eyes we are working through discouragement, which is a buying opportunity as long as we do not blast through the lows:

ES_Sentiment_09252013

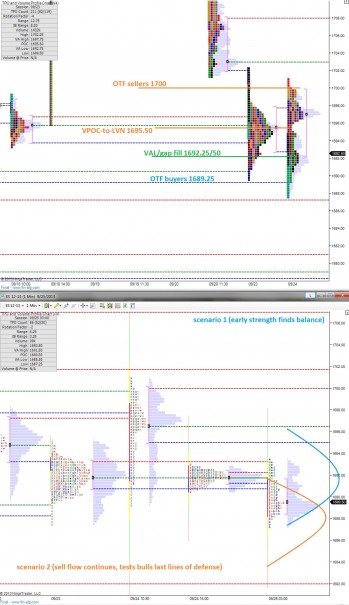
Next I present my usual daily profile analysis, both on the 24 hour profile and the RTH profile.  I like the RTH profile more for defining areas to do business, inflection points, etc.  I use the 24 hour chart to map out a few potential scenarios on the day.  I have only listed two scenarios of setting value in a balanced manner.  If we achieve the high or low of either scenario in short order, it opens the door for a third or fourth scenario of trending.  Keep that in mind when you observe the following market profile charts:

ES_MarketProfile_09252013

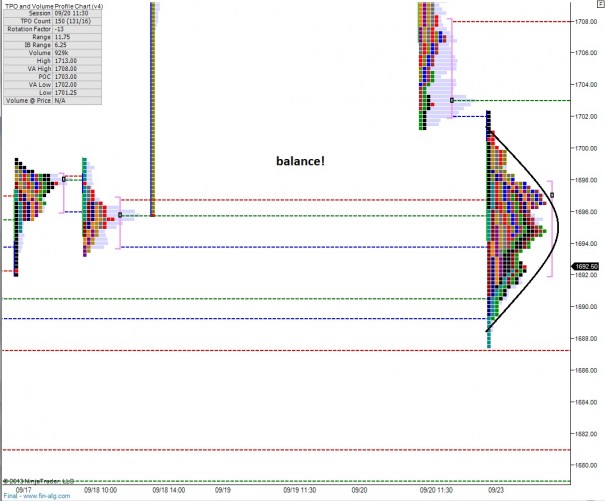
Finally, when I was working the above RTH charts, I found it very interesting that the volume point of control from Monday formed a rather extreme low volume node yesterday.  It is quite the contrasting treatment of 1695.50, yes?  So I merged the two profiles together and it gave me the right picture.  We have, in fact, balanced out:

ES_MarketProfile_0925b2013

Therefore we must closely observe how the market treats the VAH and VAL of this combined profile.  It will give us a clear picture of the buyer/sellers conviction and capacity to dictate the direction of the tape.  I am considering reducing long exposure if price is accepted (traded greater than ~1hr) below 1684, otherwise I see 1684 as a buying opportunity and any trading above these levels as peddle to the metal long.


Comments »

We Stopped Going Down That Is The First Step

The intraday volatility was certainly in place today as risk came off the table.  The S&P printed ten handles of selling with a few healthy rotations to allow short entry.  The Euro dollar via the /6E was confirming risk off too, trading in tandem with the /ES before going flat around noon.

Since around 1pm the market stabilized and balanced out.  The question on every bull’s mind is are we at an inflection point where this countertrend rally comes to an end?  I saw an interesting tweet from @StevenPlace that we have only had four consecutive down days twice this year.  The sellers certainly have been effective in erasing the euphoria that ensued post #NoTaper so perhaps a third data point is on the docket.

I will cover key levels to monitor on the S&P tomorrow morning to gauge sentiment and a potential turn around Tuesday, but as we close I get the feeling we will see overnight rotations and a sizeable gap to manage in the morning.

My portfolio is down a sultry two percent, championed by the broken wings of RVLT.  The weakness in RVLT neither surprises nor upsets as it has been my expectation for weeks.  Hell, I think it prints fresh swing lows to really get people off their rockers.  Ah, the stock market can be so cruel.  I will continue to dollar cost average.

I earned about 50% of what I made last week today trading futures.  It is good to see some intraday life coming back into the market as we enter Fall trading.

I cut off my Zillow loss early on and moved the funds laterally into AMBA.  I may be early to the AMBA party here as it is still consolidating.  Dash cam, FTW.

Top picks into Tuesday’s tape: AMBA and ELLI (no position currently in ELLI #want)

I also want some Miley:

Comments »

Weakness Carries Over Into Early Monday Morning

The S&P is on the move still.  The weak Friday action is continuing as US markets come online this frosty Monday morning.

The futures gapped higher a bit Sunday evening and methodically rotated the gap off before initially holding the Friday lows.  Around 5am price took out the overnight highs and was met by sharp-reactive selling which makes 1707.50 an interesting level to monitor today.

The selling is accelerating as a write, and it has effectively erased all of the gains from the no Taper Fed announcement.  Therefore, the broad index will have an overhang of supply as we start the week.

After a fairly long period of quiet consolidation both before and after the Fed last Wednesday, the S&P certainly seems out of balances which could increase intraday opportunities for the astute trader.

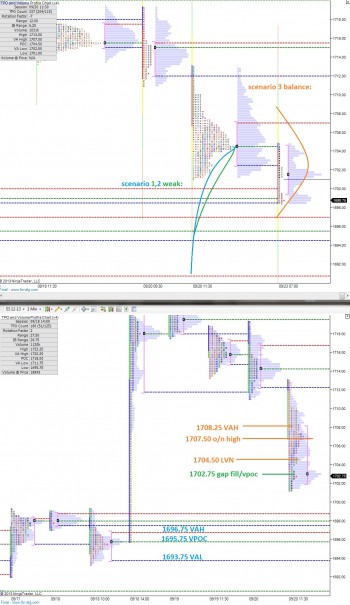
I have highlighted key price zones to measure sentiment upon today, and also a few profile scenarios on the following market profile charts:

ES_MarketProfile_09232013

Comments »

Tranquility Ahead of Quadruple Witching

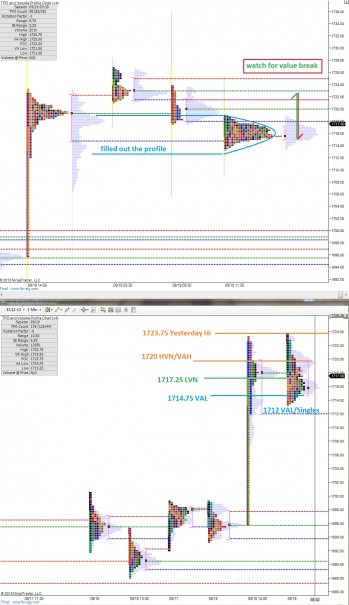
Overnight the markets were very tranquil, perhaps even complacent on an international scale after yesterday’s consolidation tape.  If you look back to 09/18 and the volume profile it produced, you can see how we settled the unfinished business of filling in the volume cavern.

What is important now is which way we break from yesterday’s value.  We may even see a head fake.  But I will be looking for an hour or more of trade above or below yesterday’s value as acceptance away from the value and a cue going into the weekend.

I have highlighted the value area high and low on the second volume profile chart.  The prices below 1712 are very slippery due to the thin profile.

ES_MarketProfile_09202013

Comments »

Baking a Contextual Cake

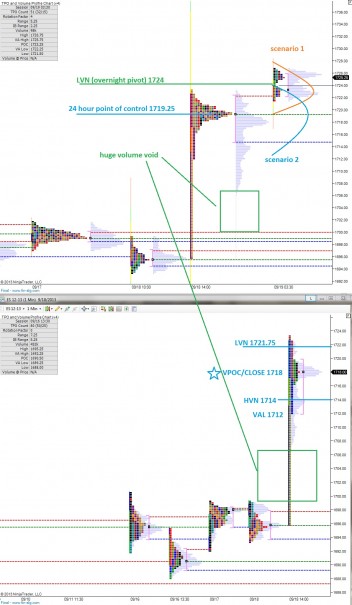
The overnight session featured follow through strength in the S&P, creating a contextual piece of unfinished business.  Making swing highs/lows outside of regular trading hours is a very uncommon occurrence, thus we can build an expectation into our trading mindset today that the overnight high is vulnerable.

The velocity of the order flow at 2pm yesterday left some unfinished business below too in the form of a cavernous, toothy profile.  These types of volume voids tend to behave as magnets because nature abhors a vacuum. However, much like pressing two magnets with the same polarity together, you can find these caves initially behaving as hot plate-esque support.

The overnight profile suggests a lack of balance with two well defined distributions and a low volume node separating them.  It suggests other time frame (OTF) traders were active overnight, and the buy orders continued to flow at a greater force then could be abated by selling until 6am.

Therefore we have an out of balance market, two pieces of context above and below to measure buyer/seller context against, and we are looking at how the USA handles this information as we come online.  I have highlighted a few scenarios and opportunistic price levels on the following market profile charts:

ES_MarketProfile_09192013

Comments »

Shrinking Targets Ahead of The Fed

My journal work these last two weeks brought attention the fact that I had been nailing my entries, but getting stuck in trades, losing interest, and then just managing to scratch them and lose a few bucks.  I think this behavior was a byproduct of our coiling markets ahead of the Fed.

What worked really well this morning was taking smaller profits.  Thus far I have taken three wins in the futures: two in the spooz and one in the 6E.  I would still be in two of these trades, contemplating scratching them for losses, had I not lowered my profit expectations by one to two ticks. 

This is adapting, this is surviving.  You must be one with the flow, one with your environment.  I strongly believe once the market gets some visibility (after the reaction to the Fed reaction) we will return to an environment where I can push my profit expectations back to their planned levels.

I cut EXK, no other portfolio adjustments.

Be amorphous, like water.  And stay calm if the market gets wiry around 2pm.  Perhaps listen to The Buena Vista Social Club:

Comments »

Holding The High Water Mark

The overnight session in the S&P was again quiet, setting a range only 3.75 handles wide.  The interesting observation is where the small range took place—at and above yesterday’s high.  The market is hanging high into the Fed today after poorly rotating lower during yesterday’s session.  This did two things—it made shorting very difficult and a losing venture, and left the dip buyers on the sidelines.

Therefore, my expectation is for early dips to be bought through the natural demand of underwater shorts being made whole (perhaps partially whole) and eager buyers putting fresh money to work. Given the implications of the Fed meeting today however, we must also be aware of a rug pull scenario where we slash through levels of support as the market attempts to digest the announcement.

I’ve highlighted a few scenarios for today which may be rendered ineffective if we begin trending, but still are context to keep in mind, and key price levels on the following market profile charts:

ES_MarketProfile_09182013

Comments »

Gentle Rejection Overnight

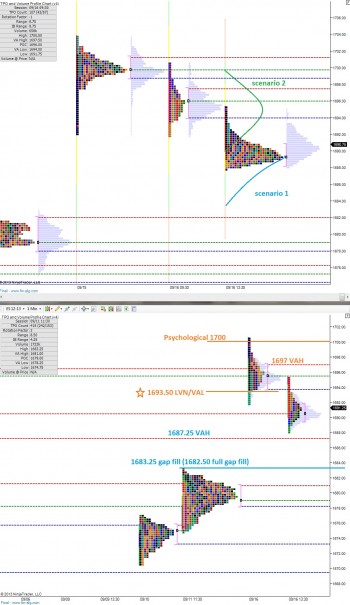
The overnight session was quiet, and the first thing to catch my eye is the way price kept bouncing off yesterday’s low at 1688.  There were four instances overnight where we saw buyers reject attempts to break this level.

As a result of all that time being spent near the lows, we have formed a very lopsided market profile overnight.  This gives us some interesting context clues as we trade today.

Many other markets are quiet too.  Take for instance, the Euro currency future via the /6e.  There has been strength but not enough to break yesterday’s highs.  Instead the Euro marking time with a gentle sine wave.  If however the Euro cannot strengthen this week, it could still be stuck in a bracketed range dating back to the beginning of 2013.

Returning to the /ESZ3 or $SPX December future, our key upside level of resistance is close at 1693.50.  When we broke down yesterday to commence gap fading we left a sharp low volume node at this price.  It can’t be seen as clearly on the below market profile charts as it is on a pure volume profile, but you will notice a split in the profile at this point and a value area low.  I’ve highlighted this level, other key areas of opportunity, and a few scenarios for today on the following market profile charts:

ES_MarketProfile_09172013

Comments »

Out of Balance

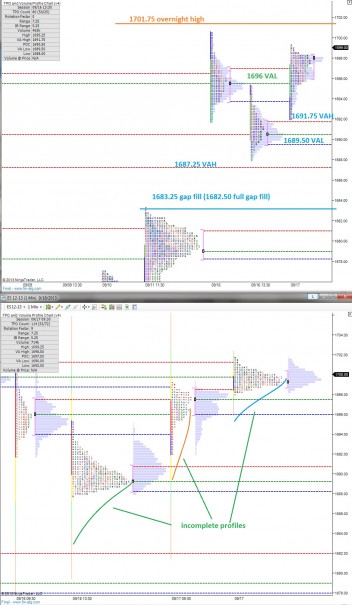
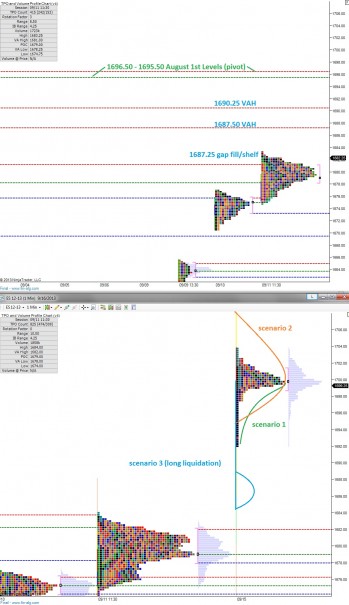
Good Morning and welcome to another work week, we have quite a gap higher to manage this morning.  The +20 gap that occurred when the market opened last night is a perfect example of something not being priced into the market.  This is the risk we carry when we hold positions over the weekend.  The 20 point gap also doesn’t mean the news is priced in.  Instead it has thrown us out of balance, which provides opportunity, as we auction our way back into balance.

The overnight action is currently forming a head and shoulders pattern with a neckline at 1698 and left shoulder at 1701, head at 1703.75, and right shoulder at 1702 give or take a few ticks.  The downside target of the move is 1692.25 which is one tick above where we opened yesterday evening, and also showing other confluences of support.  This is a huge level to monitor today, and one that is likely to offer excellent trading opportunities.

We’re also coming into the market action from the first days of August which gives us a few handy reference points, a value area high and volume point of control a point apart at 1696.50 – 1695.50.  Keep these levels in mind, if the bulls make short work of establishing value above here, we may be in for a fast and furious move higher.

Otherwise, my expectation is for profit taking type selling to enter the market early on and back fill the single prints from last night a bit.  I’ve highlighted this scenario, important price levels, and more on the following market profile charts:

ES_MarketProfile_09162013

Comments »

Calm Before The Storm

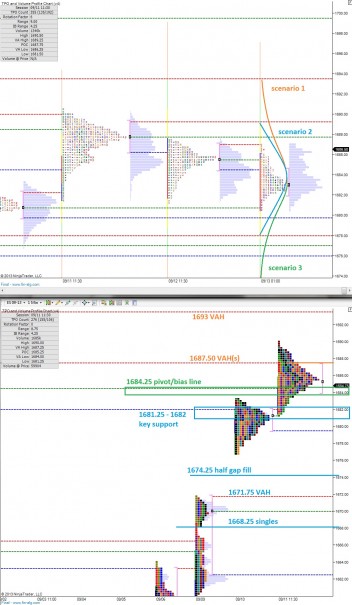
The overnight session has been very quiet and balanced with little to report in the way of new development.  Price action on the S&P is coiling up tight as we approach the Friday trading session.  Given the overall trend higher, even at this potential inflection point, my expectation is still to see some early strength.

To my eye when looking at this price consolidation on the bar chart and through the market profile lenses, 1684.25 looks to be the pivot point today.  That means I’ll be forming my intraday bias based upon how we trade relative to this level.

I’ve noted this level, a few possible scenarios, and other price levels of opportunity on the following market profile charts:

ES_MarketProfile_09132013

Comments »