iBankCoin
I turn dials and fiddle with knobs to hone in on harmonic rotations
Joined Oct 26, 2011
4,121 Blog Posts

Weak Employment Data Rattles The Premarket

 The NASDAQ has been rotating higher all evening, a drift which suggests buyers have been initiating exposure through the night.  I am writing as we come into the 8:30am employment data.  The overnight volume profile print shows three distinct distributions, each growing in size as price appreciated.  The third and final distribution has a VPOC of 3505.25Price is currently trading above yesterday’s range and value, suggesting the market is opening out of balance.  Price is careening lower on the employment data and we are currently trading in the slippery levels we trended up during yesterday’s trade.

Price is all over the place right now.

The intermediate term control has reverted back to balance after yesterday’s short squeeze, where buyers pressed higher all morning and then held value near the highs.  This type of profile suggests the early action was dynamic enough to trigger short covering, but the afternoon buying activity was not dynamic enough to press a second discovery higher.  Instead we formed a distribution on top of a thin profile, a capital letter-P.  The market was likely waiting for the employment data before moving elsewhere.

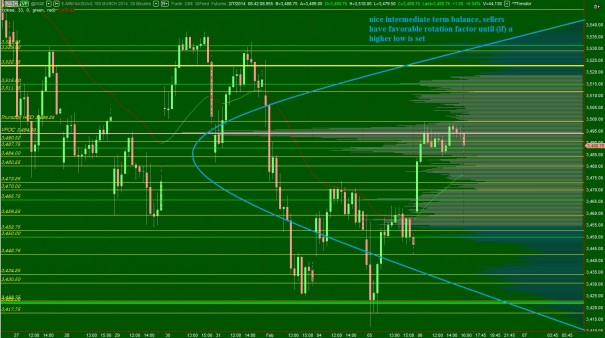
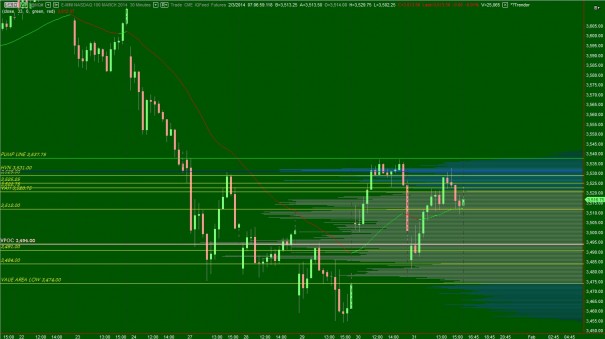
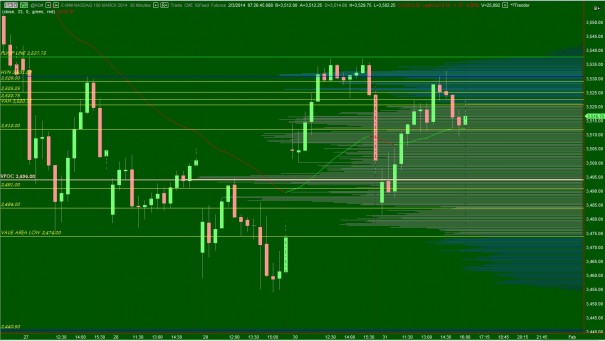
Usually a short squeeze is a temporary market phenomena, and the intermediate term will reassert itself soon after.  Therefore I have carefully built the profile which highlights intermediate term balance.  It’s crowded with reference points suggesting it is aged and ready to pop.  See below:

NQ_IntTerm_02062014

Let’s run through controls:

Long term – buyers unless weekly close < 4000 on $COMPQ

Intermediate term – balance (see relevant levels above)

Yesterday – buyers, but a temporary phenomena known as a short squeeze, sellers can continue lower on it.

Overnight – violent indecision, slight downward bias post employment data

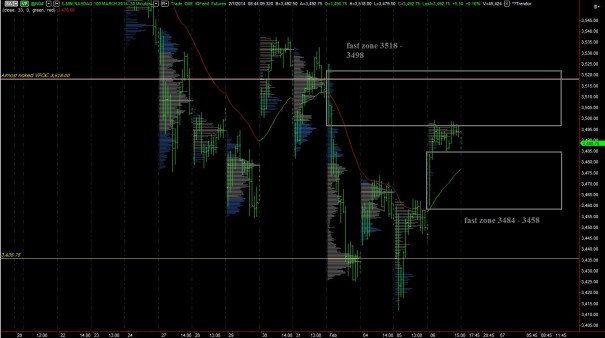
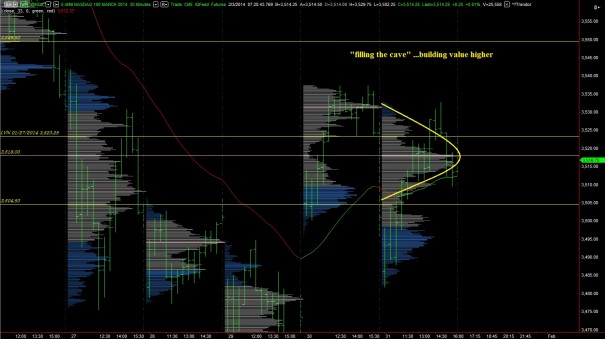
These are risky conditions.  I will be watching the first hour of trade before taking action, unless I am pressed to stop out any existing longs.  Here are the daily volume profiles, for your reference:


NQ_volumeprofile_02062014

Comments »

Musings from The Polar Vortex

It is no secret that February has been a cold month for everyone’s favorite Russian diplomat, Raul.  My home country, MOTHER RUSSIA, is being ridiculed by media pundits, many who would reduce this country USA to the same disheveled conditions if they could succeed in pressing their socialist agendas.  Remember that when you consider disposing of used toilet paper in a waste bin instead of flushing it down the pipes built by the strong hands of immigrants.

I am holed up in the subzero north myself, laboring tirelessly under the oppressive grip of the arctic vortex.  It would seem most of this work has been without fruit as I have been chosen as the sacrificial lamb to the stock market gods twice in one week.

I give my left limb to AMBA and my right to OESX.  Last week, I offered a hunk of my torso to the gods via an Apple call option into earnings.  What the hell was I gambling?  Stupid.com

Anyhow, I will not dwell but only point these losses out for the sake of full disclosure.  I have two strikes and common in FSLR.  I have incredible conviction in this name, until I do not.  They are doing a wonderful job boiling me, slowly, so I stay in the pot.

Elroi was doing well in February, and then the marketplace tripped him up.  Now I his entire credibility has come to question.  He may not be robust enough.  The shorts he entered today were not trades I would ever take on a discretionary basis.  And if I did, they would be exited well before they hit stop loss.  Thus at this stage, Elroi must be a helper robot, walking alongside me during the hunt, as opposed to an autonomous hawk, circling the prairie grass and fetching me varmint to eat.  If anyone has taken their algos fully autonomous, feel free to discuss your successes in this forum.  Sharing is caring.

I am thinking either a timed stop or a max intraday drawdown.

To keep this trading endeavor rolling, I had to find some juice intraday.  I took a solid entry on some Z yolos early on.  This trade has the look, and if right promises to recapture all the other yolo losses undertaken this year.  I like my odds here.

I took a large position in KNDI too.  It has the right look.

What can I say, the day session in NASDAQ looked like a trend day, but we could not find any initiative buying during the afternoon.  Thus we printed the infamous P-shaped profile.  We will cover this further in the morning.

Finally, LNKD is getting crushed after hours because the market has decided against aggrandized resumes and endorsements.  When someone can endorse me a hoagie, I’ll flip to bullish on LNKD.

I bought some TWTR at the bell, bringing my cost average up to $46 from $41.  I have more buying power idled and ready to buy additional TWTR blood because this is a real disruptor—misunderstood like a vapor pipe.

Crack to smoke, chocolate to eat gents…are you still hungry?

Comments »

You Rack Discipline

Today started looking and smelling like a trend day about 10 minutes into the session.  It all started with elroi getting worked over like a handrail at a roadside park.  He was long at 8:32 am, tricked into going short at 8:57 am, and dealt an uppercut for the knockout at 9:37 am.  It was painful to watch him get lit up, but it helped reveal opening type: opening drive.  This occurred atop a gap higher, atop of a nasty TWTR beat down, and certainly the big KO deal with GMCR caught a few shorts flat footed.

The stage was set for a rally.  We have PPT mojo in effect, too.

I took to my think or swim platform which was giving price quotes only, directed my browser to stockcharts.com and found KNDI was indeed looking sweet this morning.  Someone in 12631 had bought it a buck lower.  I bought a sizeable chunk, ¾ long.  Then I went out just now and bought more.

I am over here, buying Chinese electric car stocks already up eight and a half percent on the day.  The market wants to chop more of my nips off, because I lack discipline.  Or do I?  The KNDI chart looks great, and momo is concentrated to a few studs.  Thus I am concentrating on a few studs.  This either works very well, or blows my portfolio up.

Run and gun.

In other news, the solid state lighting trade is finally catching a bid, after sucking hard all year.  Funny they should perk up while OESX gets crushed post earnings.  This is all very perplexing.  I am sticking with the theme until March at least, even staying long the cheese fed goats at OESX.

Comments »

Signs of Stabilization

Yesterday was a tricky day in the NASDAQ.  We ended the day slightly lower than Tuesday, yet the intraday action suggested buyers were making a bit of progress toward overpowering the sell flow we have experienced of late.

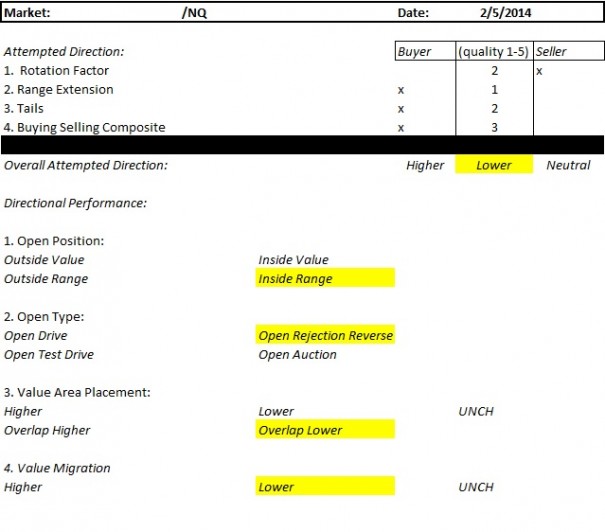
I had to run through my market report template to confirm what I had been speaking about yesterday.  This template helps me answer the two basic, sweeping questions that stem from the market’s ultimate purpose in facilitating trade:

Which way is the market trying to go?

and

Is it doing a good job in its attempt to go that way?

Here is the template:

02052014

Yesterday’s market was attempting to continue lower in the morning but responsive buyers were found below recent swing lows.  This resulted in the snapback rally we saw intraday that was perhaps fueled by POMO.  As a result, even though the market was attempting to go lower, however volume dried up and responsive buying took hold.  Now we have a floor to work with and the auction pressed higher.  Buyers managed to take control of the day timeframe.

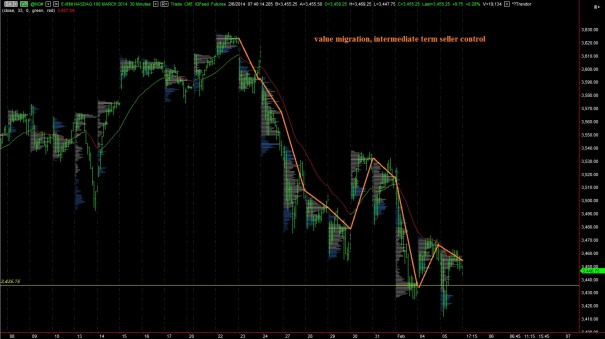
The intermediate term control is still in seller control.  This can be seen as a series of lower highs and lows best seen by tracing the migration of value like I have done on the following volume profile chart:

NQ_02062014_valuemigration

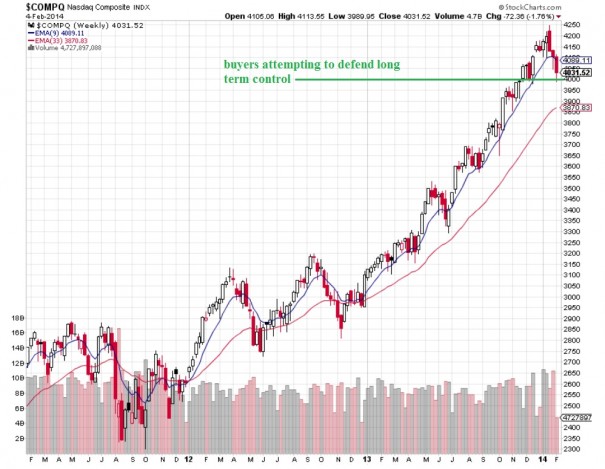
Long term control is still buyer dominated, but becoming more questionable.  The daily chart no longer shows a series of higher lows.  Instead one must take to the weekly chart to see buyers still controlling the long term trend.  I will call this control into question if price closes below 4000 on the $COMPQ on a weekly basis.

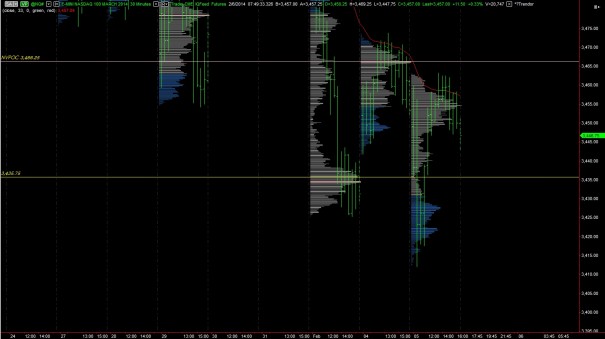
Overnight we have seen higher prices in the NASDAQ, however as the USA comes online the prices are fading a bit.  The key level I will be watching today is 3435.75 on the /NQ March contract.  This level printed a very low volume node on the buyer snapback rally.  If it holds, it would suggest a sentiment shift, and buyers showing up again at the scene of their reactive buying.  If we sustain trade below it, it will become apparent another leg lower is materializing.  I have highlighted this level on the following volume profile chart:

NQ_02062014_volumeprofile

Comments »

Lateral Movement

I churned a bit today, waffling on PHOT intraday.  I bought MOAR PHOT, like I really needed more, and subsequently sold my new shares and more when a wave of paranoia swept over me.  I suddenly felt the fins of degenerate OTC sharks tickling my toes.  I bounced.

Then this afternoon, I allocated said funds to GRNH because I realized I needed some pot exposure.  They are running hot, so I chalked it up as a lateral move.

I did not make it far this morning, attempting to drive across town proved a waste of time, so I returned home to face the day from the mother ship.  I wonder how people hole up for weeks on end, as I find the home to mostly be a sleeping facility with nice groceries.

I was stopped out on AMBA this morning when prices dove down relentlessly.  I capitulated into the move.  Now I need to figure out where to buy back in because I like this name.

I sold out of YGE.  I have had many good trades in this name over the last 12 months.  This last one was not, and I booked a 5% loss.

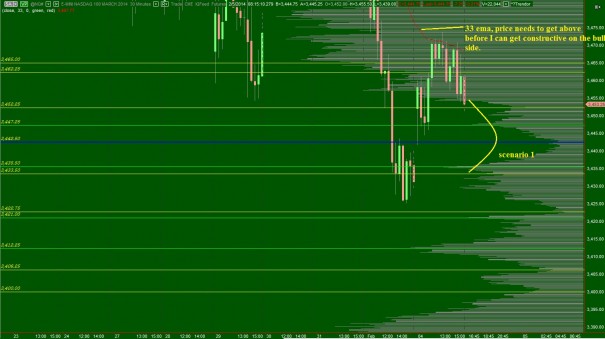
After bidding in the options market for some time on WDAY, I decided I was bananas and canceled my orders.  The issue here is the NASDAQ.  It simply cannot reclaim the 33ema on the 30 minute chart.  Price has become increasingly sensitive to the moving average, and until buyers can hold price above it and get value back to migrating higher, I simply cannot get excite about adding longs.

There was a moment intraday where I thought it might get reclaimed.  It was at this moment I bought EXK.  Odd, sure, but I like this chart and figure the miners can trade in a microcosm even when the broad equity market is sweating blood.

Elroi is loving February thus far, three-for-three.  I can sense he is poised to have a solid month.  Here’s the Elroi stats:

Elroi_FebStart

If he stays green this month, I will be reinvesting the profits into an upgraded helmet for him.  He deserves it.

I have 28% cash and a hard time keeping it.  I want to invest it into ideas!  But I will sit, and wait for better conditions.

Get exited, for Twitter is about is rock the social media space.

Comments »

Sell Flow Controlling The NASDAQ

Trade was balanced overnight in the NASDAQ futures after prices worked a bit lower in the early pm hours. Price briefly took out yesterday’s low of the session before finding buyers and trading in balance.  As the US comes online, the sellers appear to be reasserting themselves with another rotation down thus they claim control of the overnight session.

Yesterday prices traded higher, as did value, but the challenge was getting across the 33ema which held prices down all day.  Prices fell out of their upper value distribution in the afternoon but ultimately closed higher.  Buyers were in control during yesterday’s day session.

Intermediate term shows sellers in control also.  This can be seen as a series of lower highs and lower lows.  Their control of the intermediate term remains until we see the market put in a higher low.

The long term control can still be seen as dominated by the buyers, where the weekly chart has made a series of higher highs and lows since the beginning of 2012.  However, the chart is trading below the weekly 9 period exponential moving average.  This creates a higher risk environment t where price can accelerate to the downside rather quickly.  The key level from the COMPQ appears to be 4000.  A weekly close below this level could open the door for a test of the 33ema down near 3870.  I have highlighted this action below:

COMPQ_WEEKLY_02052014

Taking to the composite, my expectation is for sellers the attempt another push early on.  My algorithmic target is from 3435.50 – 3433.50.  This level is near the Monday lows.  I would expect these levels to hold price initially.  This action would also shore up the gap left behind yesterday morning.  From there, I expect us to trade higher and work inside of the volume cave from 3447.25 to 3433.50.  I have highlighted these levels on the following composite profile:


NQ__VolumeProfile_02052014

Comments »

SOCIAL APOCALYPSE APPROACHES

Tomorrow is a big day for the social media industry.  Tomorrow we get to see how the market reacts to our first Twitter earnings announcement.  Twitter will be joined by special guests YELP!  Together the pair makes up a big piece of the social media space.

We have absolutely no way of knowing how the market will react to this news.  We do know that up unto this point TWTR has behaved almost exactly the opposite of FB during the first three months of public trade.

Facebook pretty much bottomed after their first call.  Will Twitter pretty much top?

It deserves a consideration.  On the eve of what promises to be a special day for the market, I have decided to raise some cash and buy popcorn rations.  I want to be a casual observer of the action, not a red eyed madman trading the fallout.  I want to instead casually observe the action and pick a spot to pounce and eat.

Social media is the ultimate disrupter.  Solid state lighting and eCigs and reefer and big, but social media is HUGE.  Thus we must continue to find ways to profit from it.

I still hold my $40 cost basis shares in Twitter, and these $57.50 February calls in Facebook.  I sold out of the YELP calls for a handsome gain.

With these actions my book is now 30% cash.  Cash rich, if you will, and resisting my junky urges to get another fix.

For now.

Comments »

The Day After a Trend Day

In market profile theory, one of your goals is to detect trend days as early as possible and get on board the move.  One of the catalysts for a trend day is an opening drive.  The opening drive features one maybe two ticks in one direction, then a strong drive in the opposite with hardly any overlap in the TPOs (or 30 minute bars).

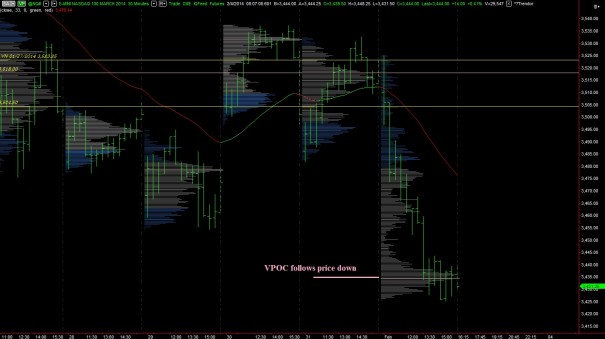
Yesterday we had a slightly different open, the open-rejection-reversal, but it indeed sparked a trend day.  It could be seen a few other ways, too.  The volume profile print showed no definitive value area all session.  Instead volume-at-price would form a modest node and then press lower again.  We ended the day with value hear the low as can been seen on the following volume profile chart:

NQ_02042014_trendday

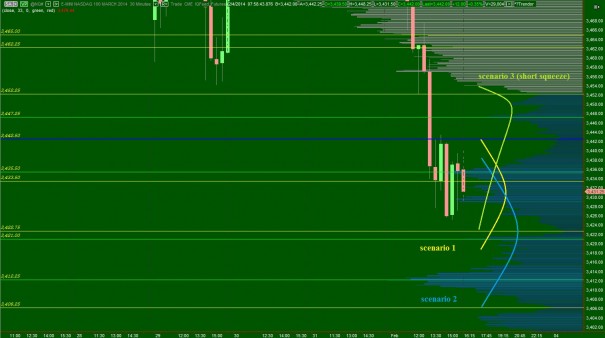
The market profile theory says any entry in the direction of the trend day offers a low risk entry into the next session.  Thus, any short taken yesterday could be held overnight with anticipation of being able to buy the position back at lower prices.  With this idea in mind, I have highlighted a few scenarios and also the relevant price levels for today’s trade on the following composite chart:


NQ__VolumeProfile_02042014

Comments »

Circling The Wagons

I have been very busy today, busier than most days, thus I must apologize for not being more active in my local feeds.  I have, however, been working on selling down positions all day inside of the pelican room.

I am working down to my favorite positions, after building too many, into a tape I perceive as weak.  I have sold the following:

Scaled some FB for a solid win, stopped out MCP, TRLA AREX, SINA, and GOGO.

There are more names on the chopping block, too.  The above, however, were of no use to me any longer.  With GOGO, it was an emotional decision and I will be the first to admit that.  I have made wonderful gains trading GOGO, and I became complacent.  I bought the earnings dip and have taken heat ever since.  It is nearing a buyable level, but I can always buy it back with a fresh costs basis.

These sales have brought cash to 26 percent.  This puts me in a solid position to buy more of my favorites, like TSLA, FB, YELP, AMBA, FSLR, ANGI, and YGE.

The LED trade needs to turn the lights on.  Believe me, this can turn fast, we are in a seasonality sweet spot with these names through March.  That being said, the CREE chart, my favorite company of the lot, looks like poop.

Elroi took a winner premarket and is thus green for February.  He has done nothing since.

Pot stocks are all the rage, look at PHOT and HEMP go.  Then if you’re feeling left out, consider buying MDBX or MJNA.  Then realize you’re dumb, and should probably allocate said funds to starting your own narcotic venture.  Then realize ultimately that this is all federally illegal and go fuck yourself.

Finally, for anyone saying I was calling for a bottom, please read the following except from this morning’s market analysis:

“The other possibility is we have not even begun to see panic.  If this is the case, the market should accelerate rapidly to the downside, soon, blowing through intermediate term and long term control.  This is very much a possibility and a would be remiss to ignore this possibility.  I have a line in the sand at 3440.50 but should price begin accelerating violently to the downside, I may begin reducing exposure well before then.”

I am bracing for more pain.


Comments »

A Heaping Dose of NASDAQ Context to Start The Week

The futures were active overnight, albeit slightly quieter then we have seen in recently.  We do not have any major premarket news on tap, thus our early analysis should hold relevant into the opening print.

As the USA comes online, the equity futures are trading slightly lower with the NASDAQ down 1.5 and the S&P down 0.75.  For the duration of this post, I will be focusing on NASDAQ futures via the /NQ contract.

We came into last week on the tail of strong sell flow from the week prior.  A gap lower on Thursday the 01/23 resulted in an odd print because afternoon strength took prices to the high of the session at the close.  The next day we gapped lower and printed a trend day down.  This marked the beginning of sellers taking control of the intermediate term auction.  We continued lower on Monday before finding some responsive buyers in what I perceived as panic trade lower.  The rest of the week the market began balancing out, and by Friday the intermediate term control was back in balance.  I have pictured the above commentary on the following chart:

NQ__VolumeProfile_02032014_INTERMEDIATE_TERM

The trading has been framed within the context of the sentiment cycle chart option addict introduced and often referenced.  I have been under the impression that action quickly worked through discouragement and climbed the wall of worry before ultimately printing aversion on Friday morning where we bought the dip.  If this is the case, I want to see quiet market action over the next few days—denial taking hold.

The other possibility is we have not even begun to see panic.  If this is the case, the market should accelerate rapidly to the downside, soon, blowing through intermediate term and long term control.  This is very much a possibility and a would be remiss to ignore this possibility.  I have a line in the sand at 3440.50 but should price begin accelerating violently to the downside, I may begin reducing exposure well before then.  Let’s run through who controls the auctions on various timeframes:

Long term control: buyers—this can be seen as a series of higher highs and lows on a weekly chart.  However, the daily chart is not as pristine as it was from October to now because we have made a lower low verses late December-to-early-January

Intermediate term control: BALANCE—we have a near-perfect bell curve intermediate term.  It is 87.5 points in range with a VPOC at 3494, which is slightly below the midpoint at 3498.

Short term control: buyers—buyers were able to get price back above the 33ema and hold value within the higher print.  This can be seen on the following chart, where the last two days of market action migrated value higher:

NQ__VolumeProfile_02032014

Overnight control: BALANCE with a slight seller edge—we have printed a bell curve overnight.  The sellers had a slightly better rotation factor then buyers.

Net of all of this context, you can see there is a power struggle going on, with balance dominating the conversation.  Thus we must monitor intermediate term balance.  The open is key too. It can give us early cues of who is in control on the day.  Is it two-timeframe action, back and forth, or do we see a strong drive from the long term buyer control?  Or does the seller come in and drive lower for an hour, reasserting their control on the intermediate term?

The key, in my opinion, is velocity of price movement, and the following value and its relevant levels:

NQ__VolumeProfile_02032014_INTERMEDIATE_TERM-2


Comments »