iBankCoin
I turn dials and fiddle with knobs to hone in on harmonic rotations
Joined Oct 26, 2011
4,121 Blog Posts

Active Overnight Session and How It Fits inside The Big Picture

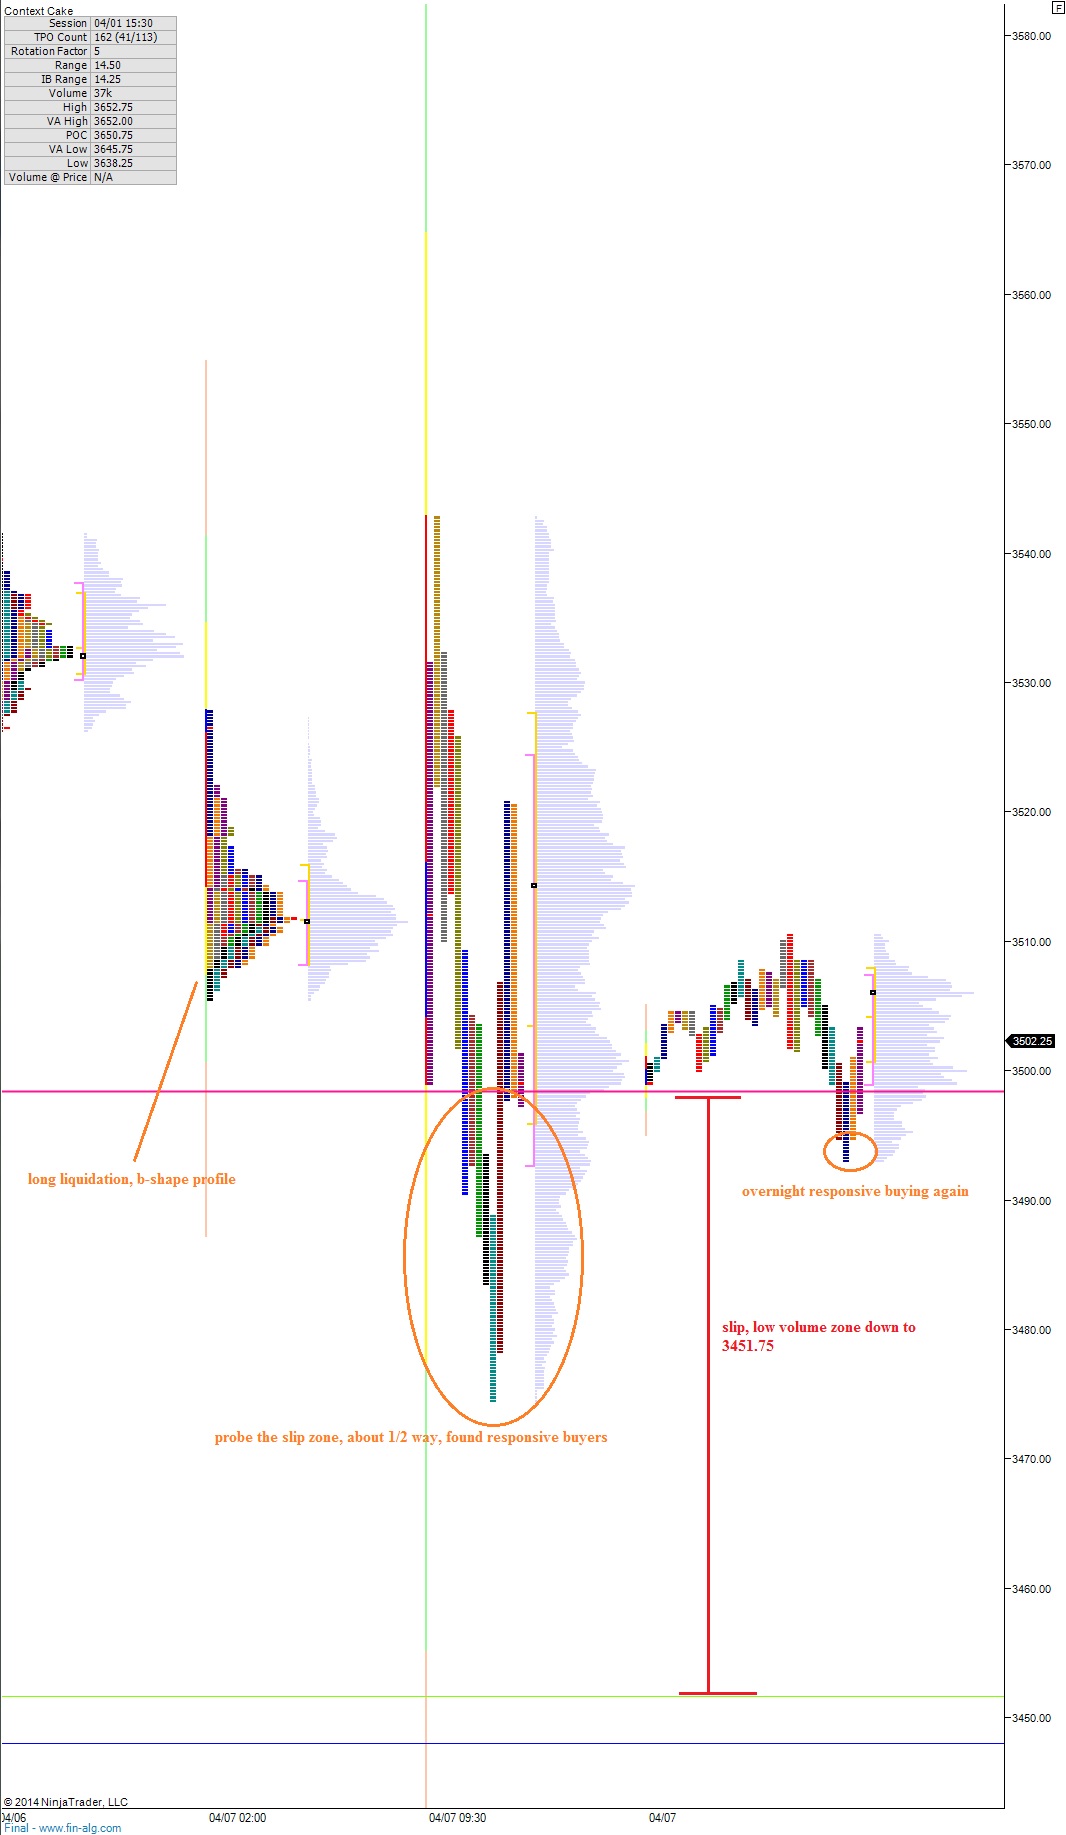
Futures traders had some action early this morning when equity futures abruptly fell out of balance and knifed lower.  The wave of selling rolled in around 5am and it was soon met with responsive buying.  The overnight profile shows no clean consensus on value and we are currently trading near unchanged in the NASDAQ.

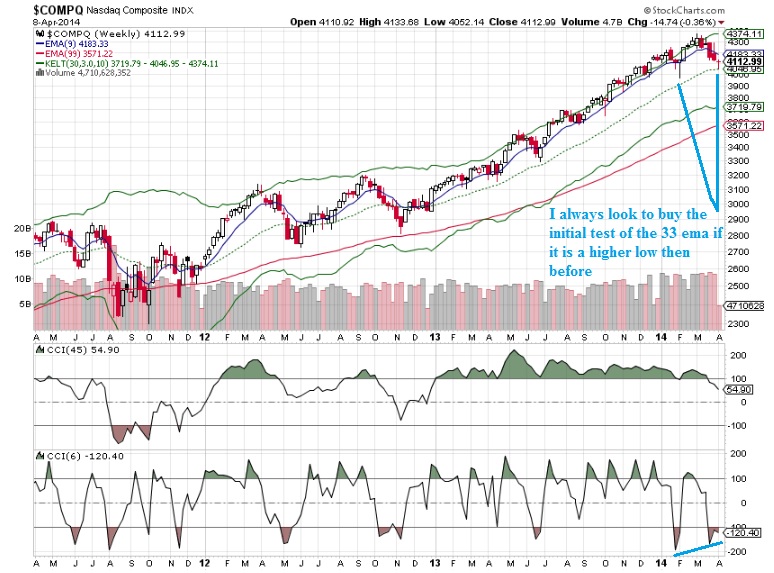
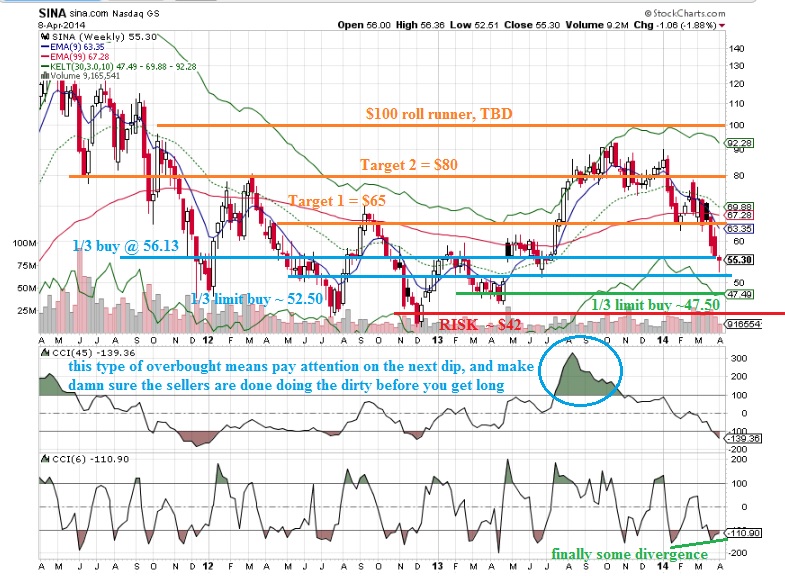
I will always buy the first test of my EMA if I feel the chart is still trending and the EMA resides at a higher low then our previous swing high (or lower high then our previous swing low).  However, the buying is typically the easy part of this trade.  Knowing whether the trend will resume or whether price will roll tide back is the management key.  The very long term auction as seen on the weekly composite chart is still buyer controlled.  We were buyers ahead of the 33 EMA which has now edged higher to touch the low print.  Did you know moving averages move?  See below:

NASDAQ_WEEKLY_04102014

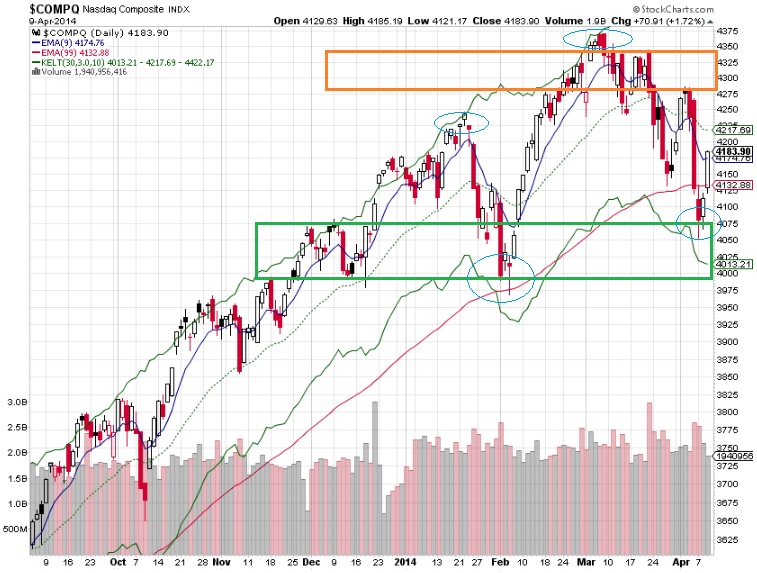
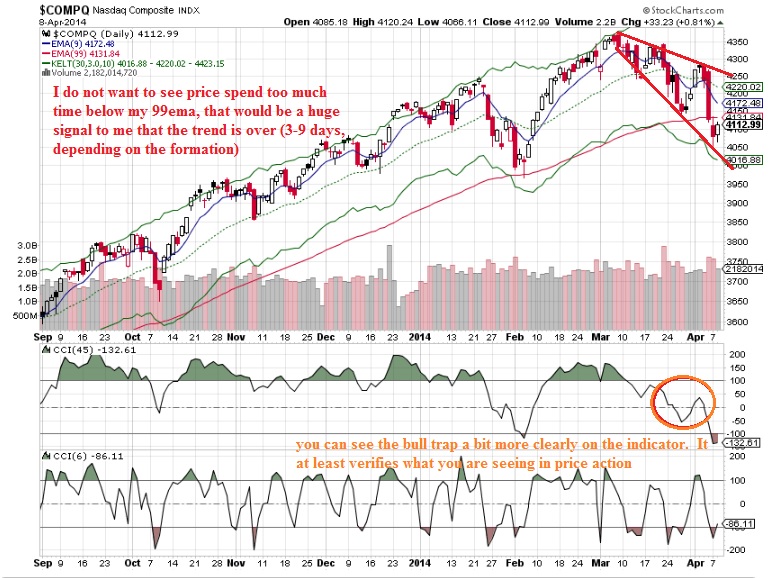
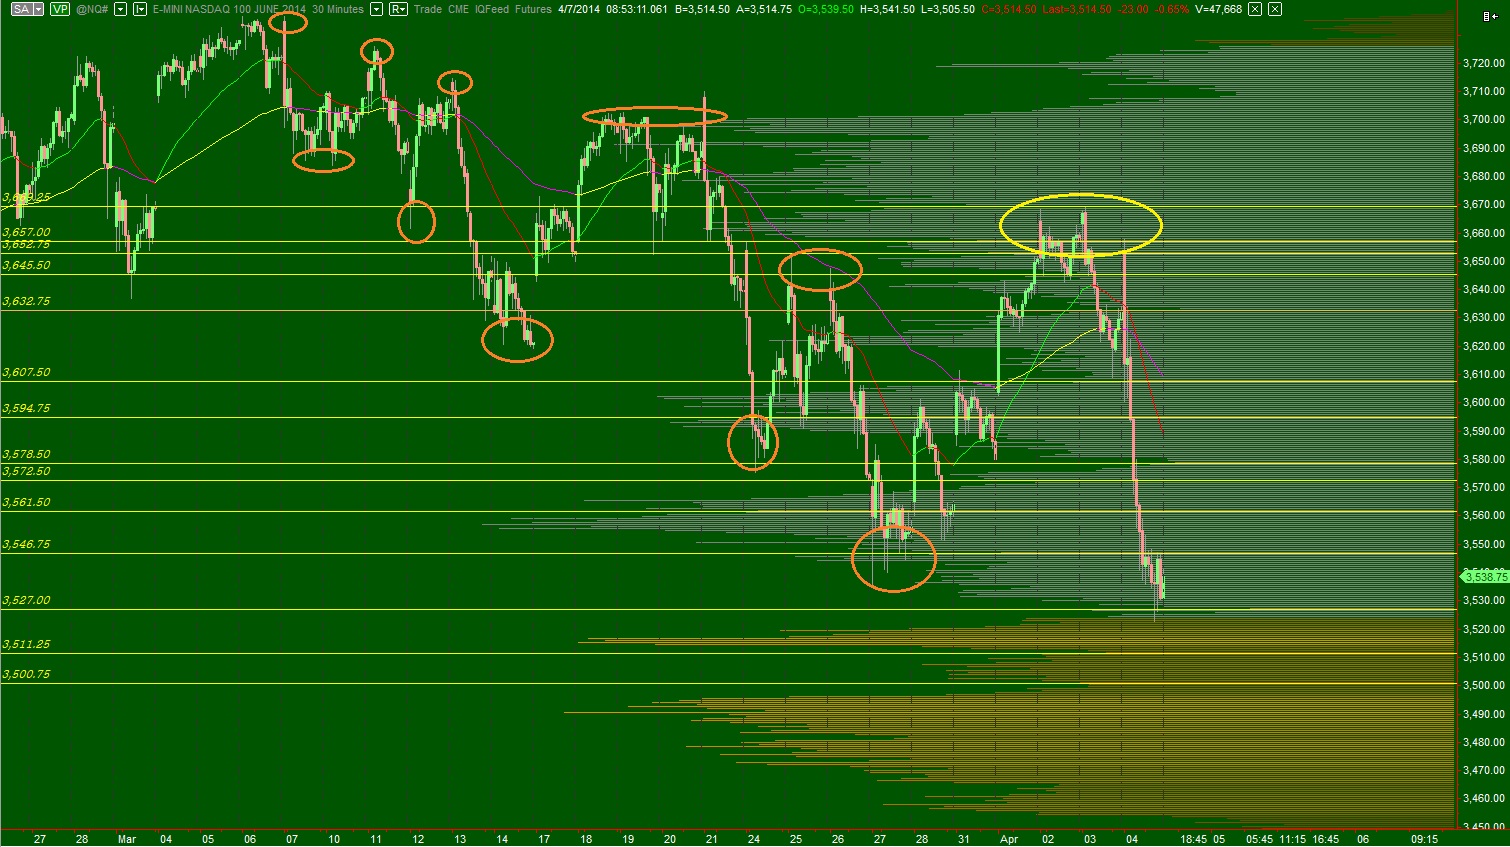
The daily chart which I most commonly refer to as the long term auction is no longer a clear picture of buyer control.  Our EMAs are not in full alignment and our longest term EMA, the 99, is flat.  We have also seen a pattern of lower highs and lows recently and it appears the long term timeframe is in balance.  Now buyers and sellers must slug it out before one or the other becomes the clear controller of the long term auction.  However, buyers have a slight control edge remaining (see blue circles on major swing levels).  See below:

NASDAQ_DAILY_04102014

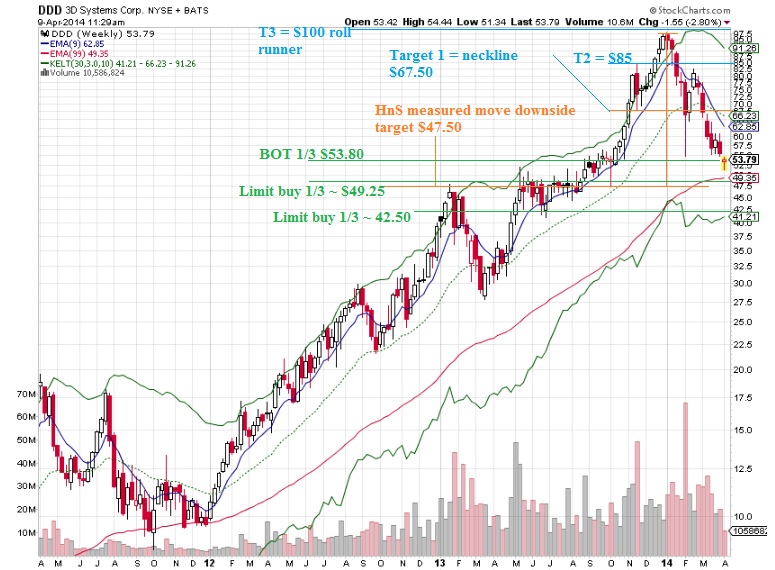
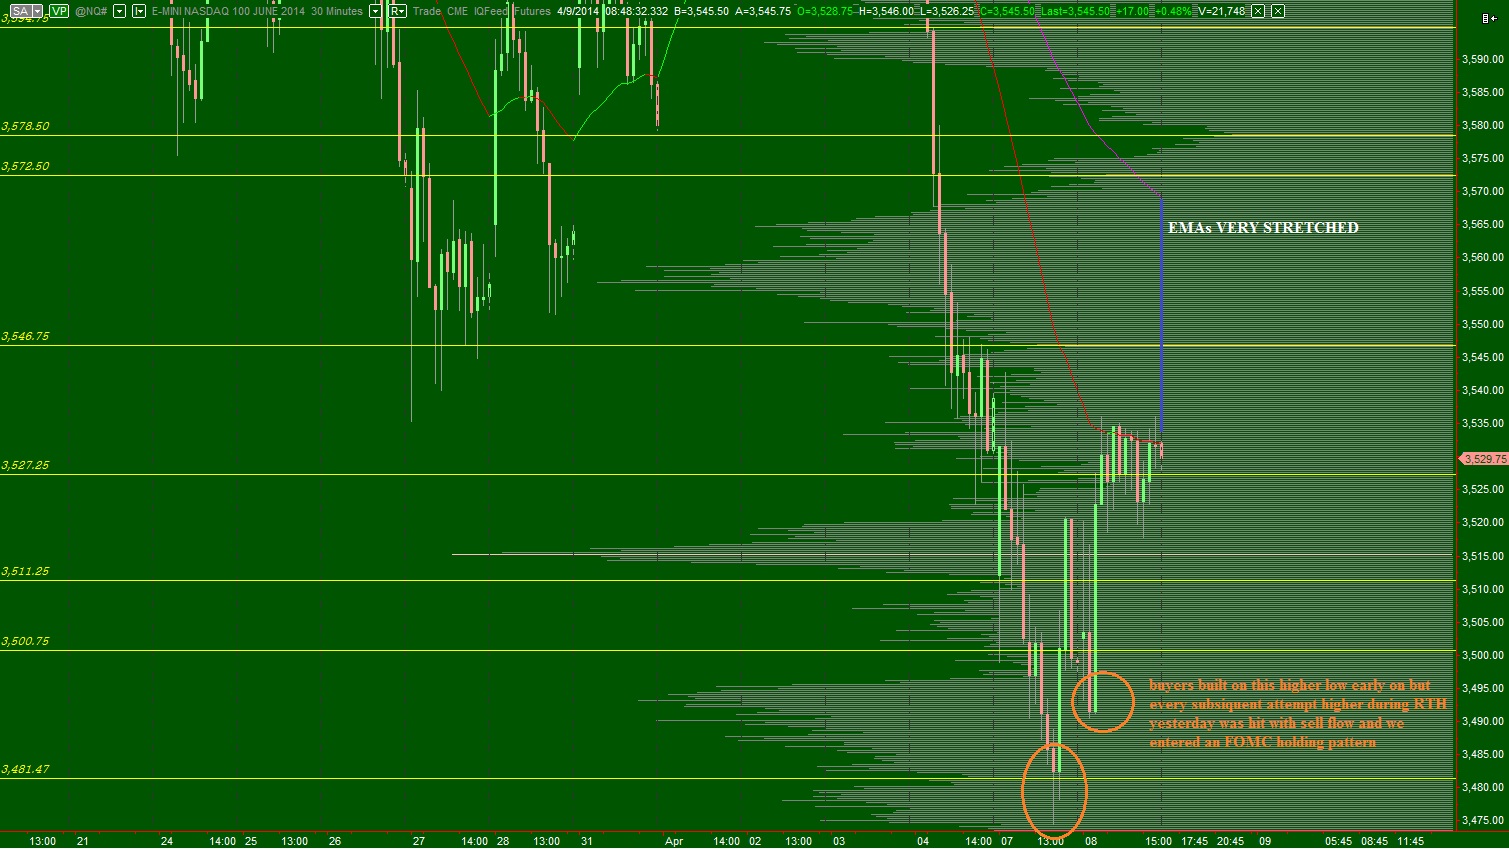
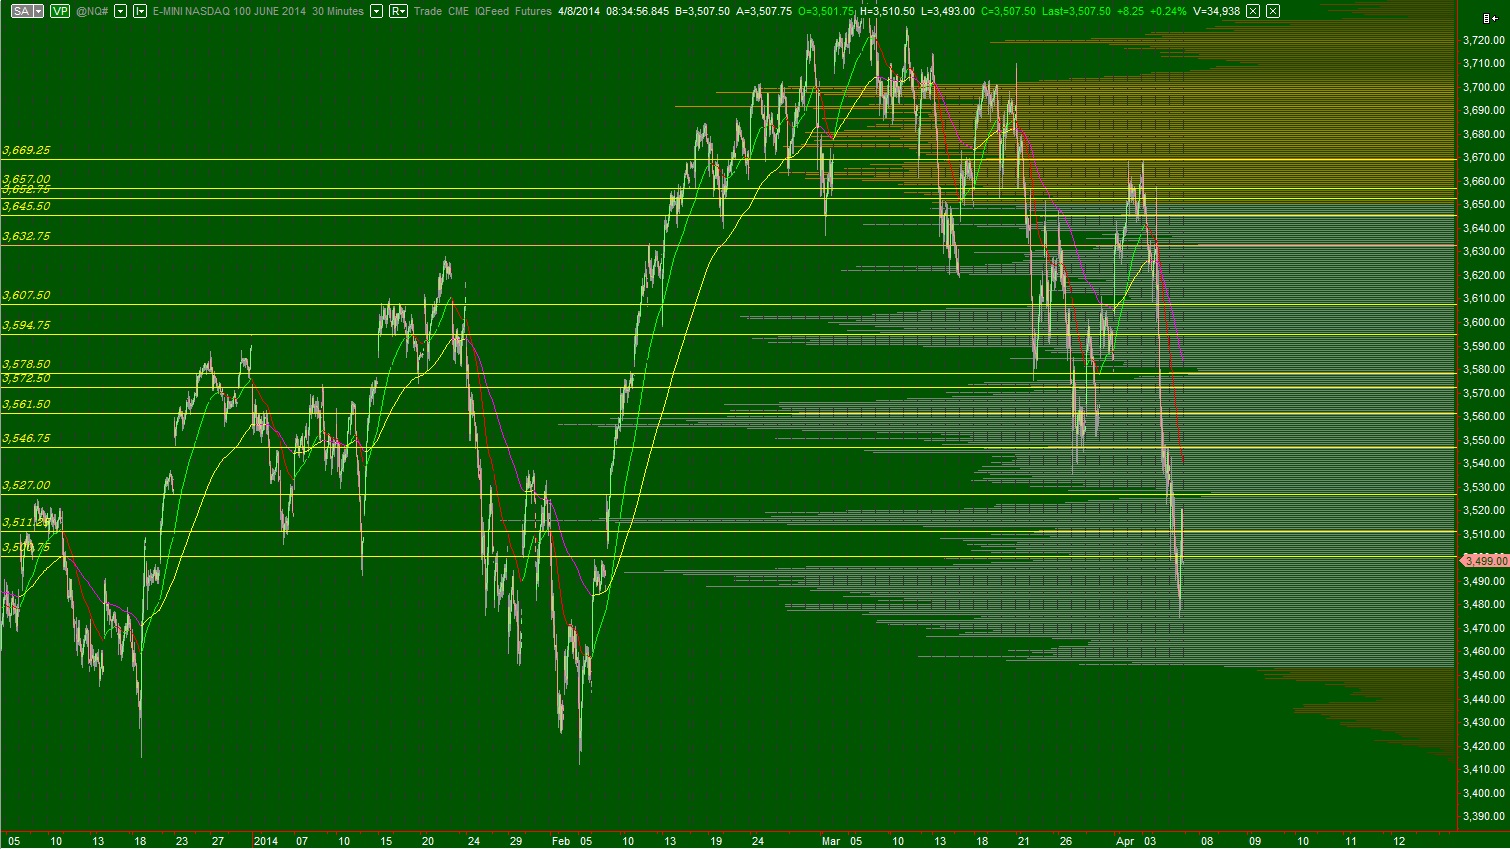
The intermediate timeframe is seller controlled.  Their control can be seen as a series of lower highs and lows.  Yesterday’s action was dynamic and powerful to the upside, but until we see a higher low printed, the sellers have the ability to assert control on this timeframe.  I have removed all the lines I normally keep on this chart so we can more clearly view the seller control.  There are some very interesting low volume nodes if you click and enlarge the chart, and these make great entry points because they often see “hot plate” type reactions:

NQ_VolumeProfile_intermediateTerm_04102014

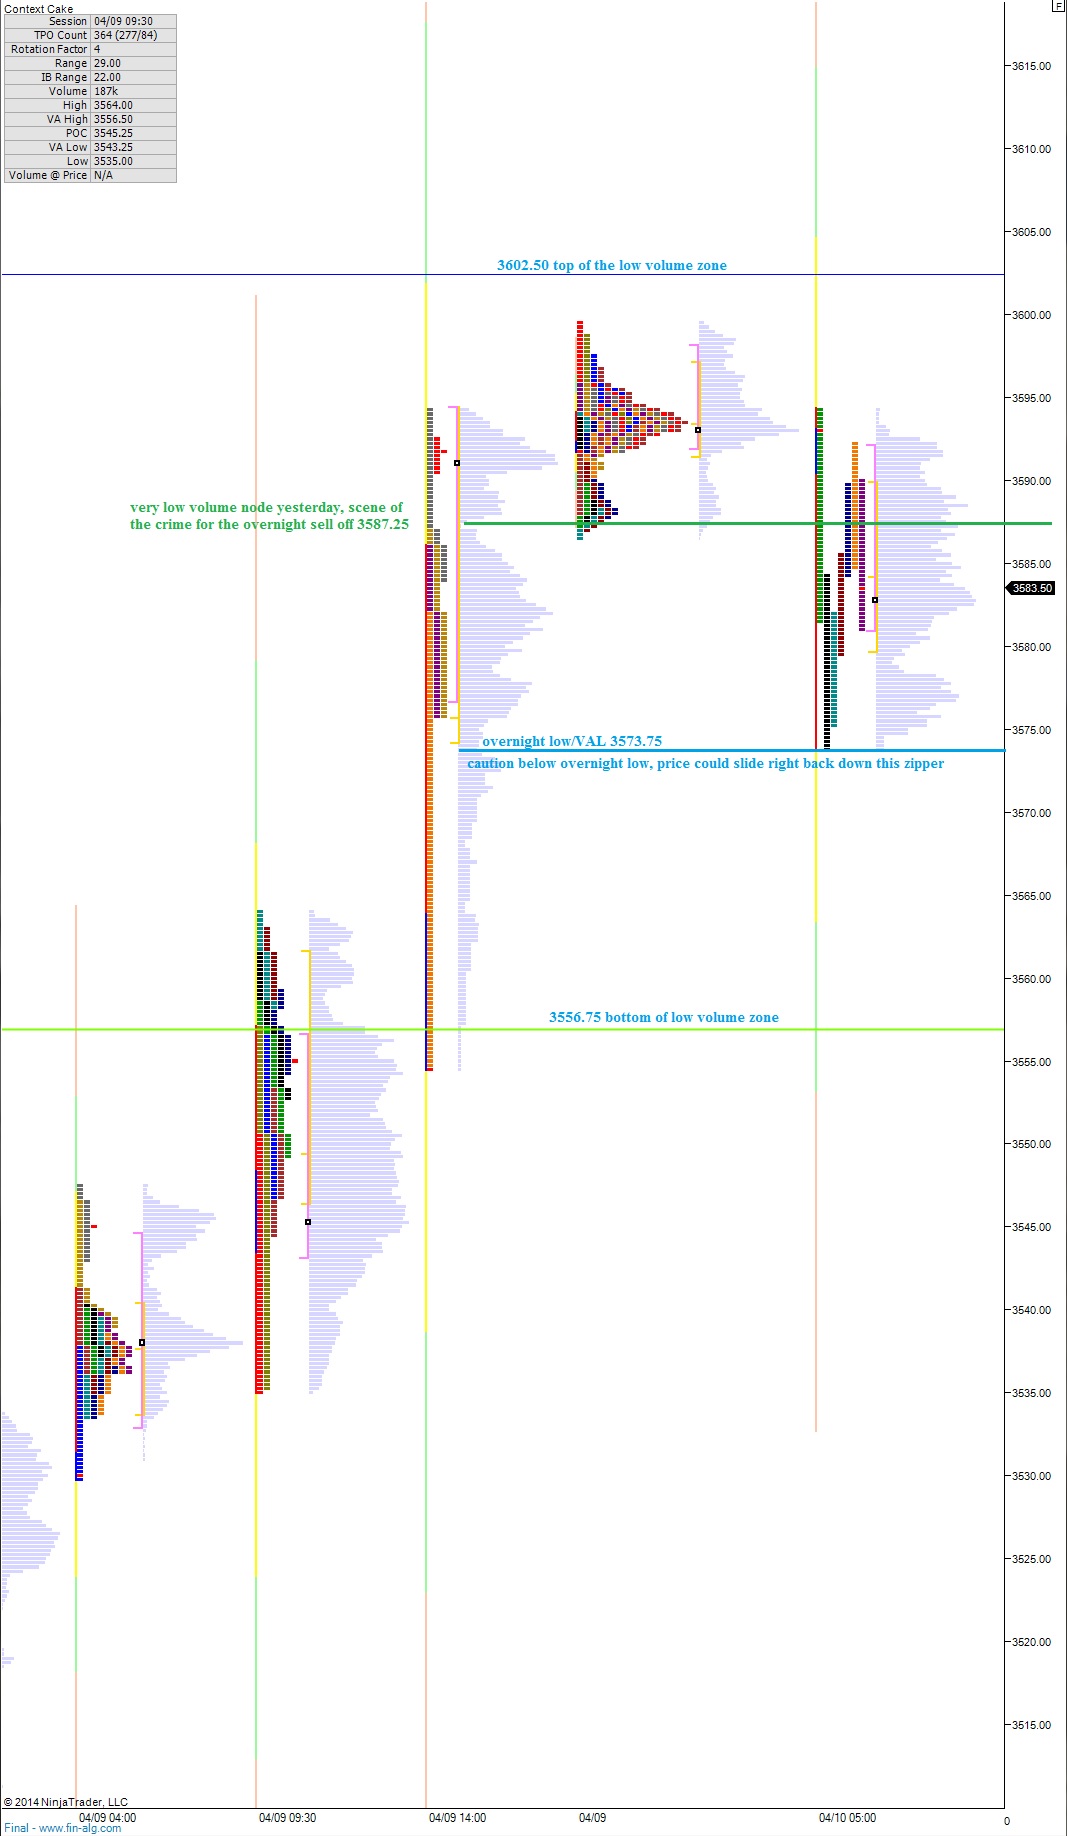
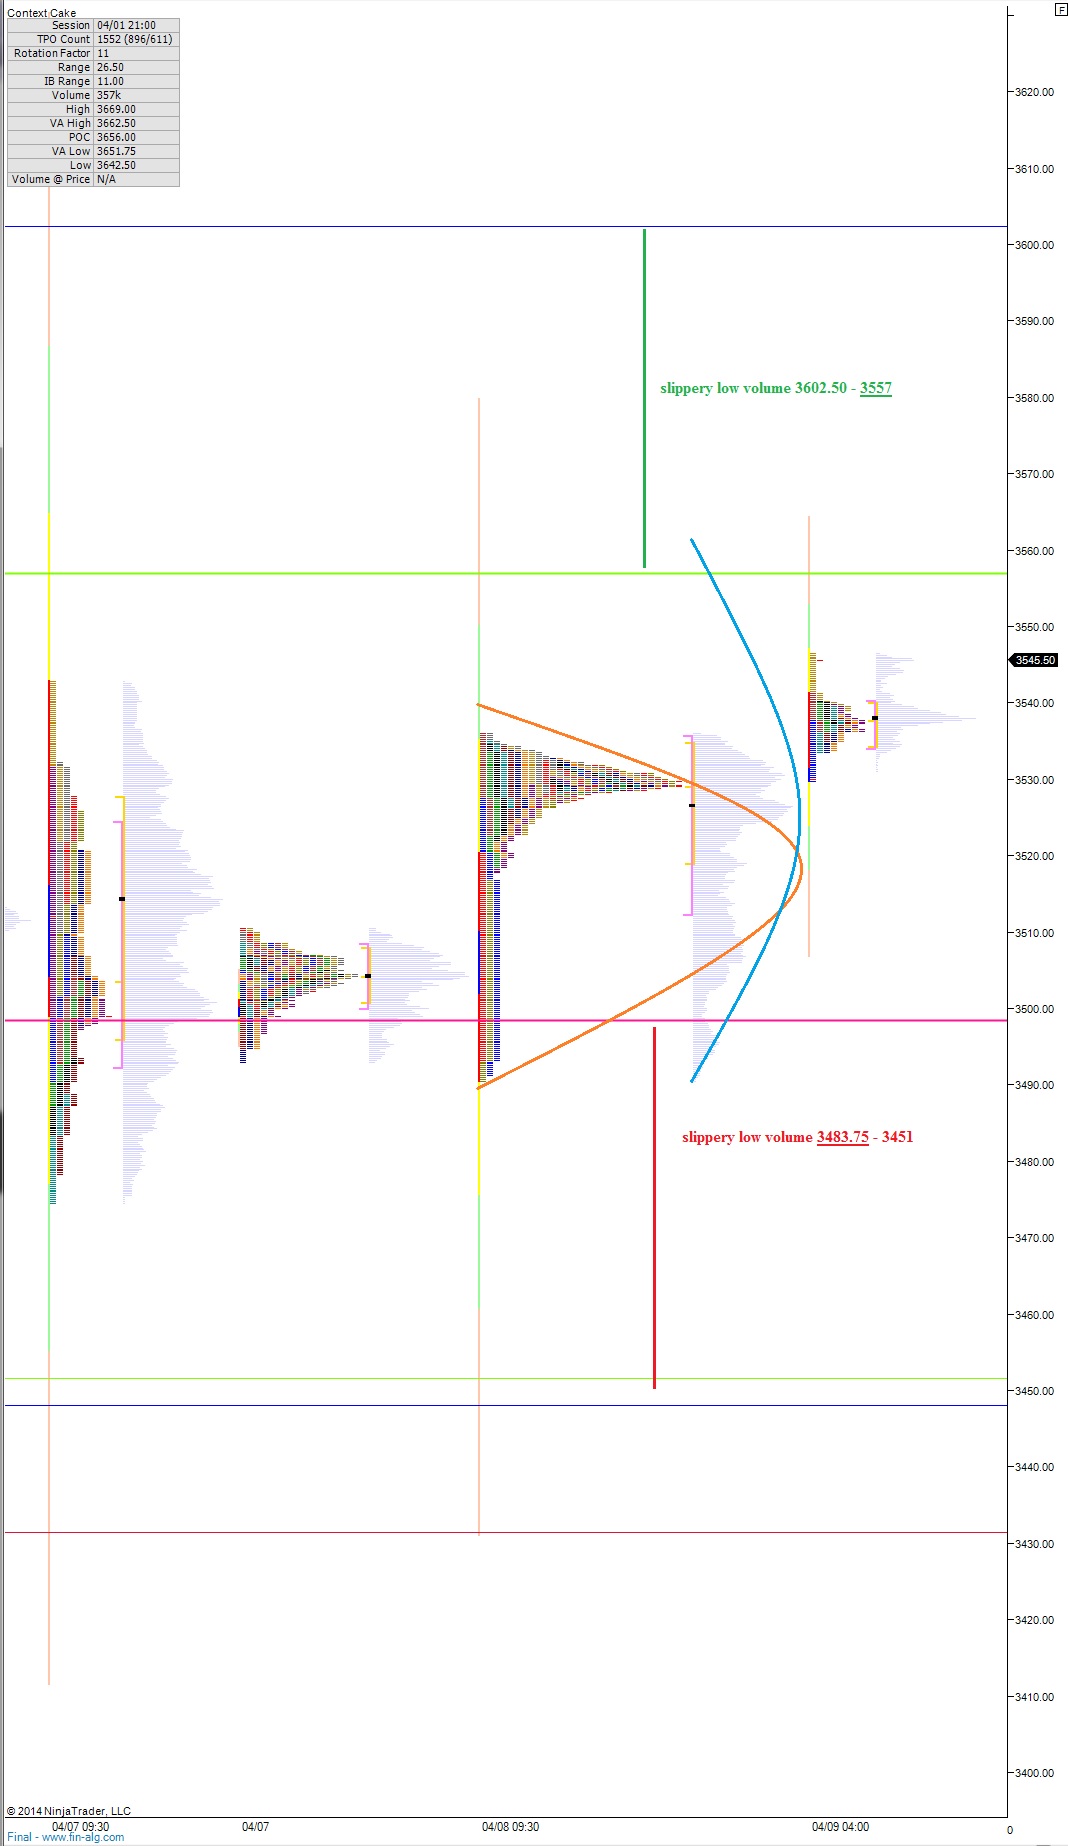
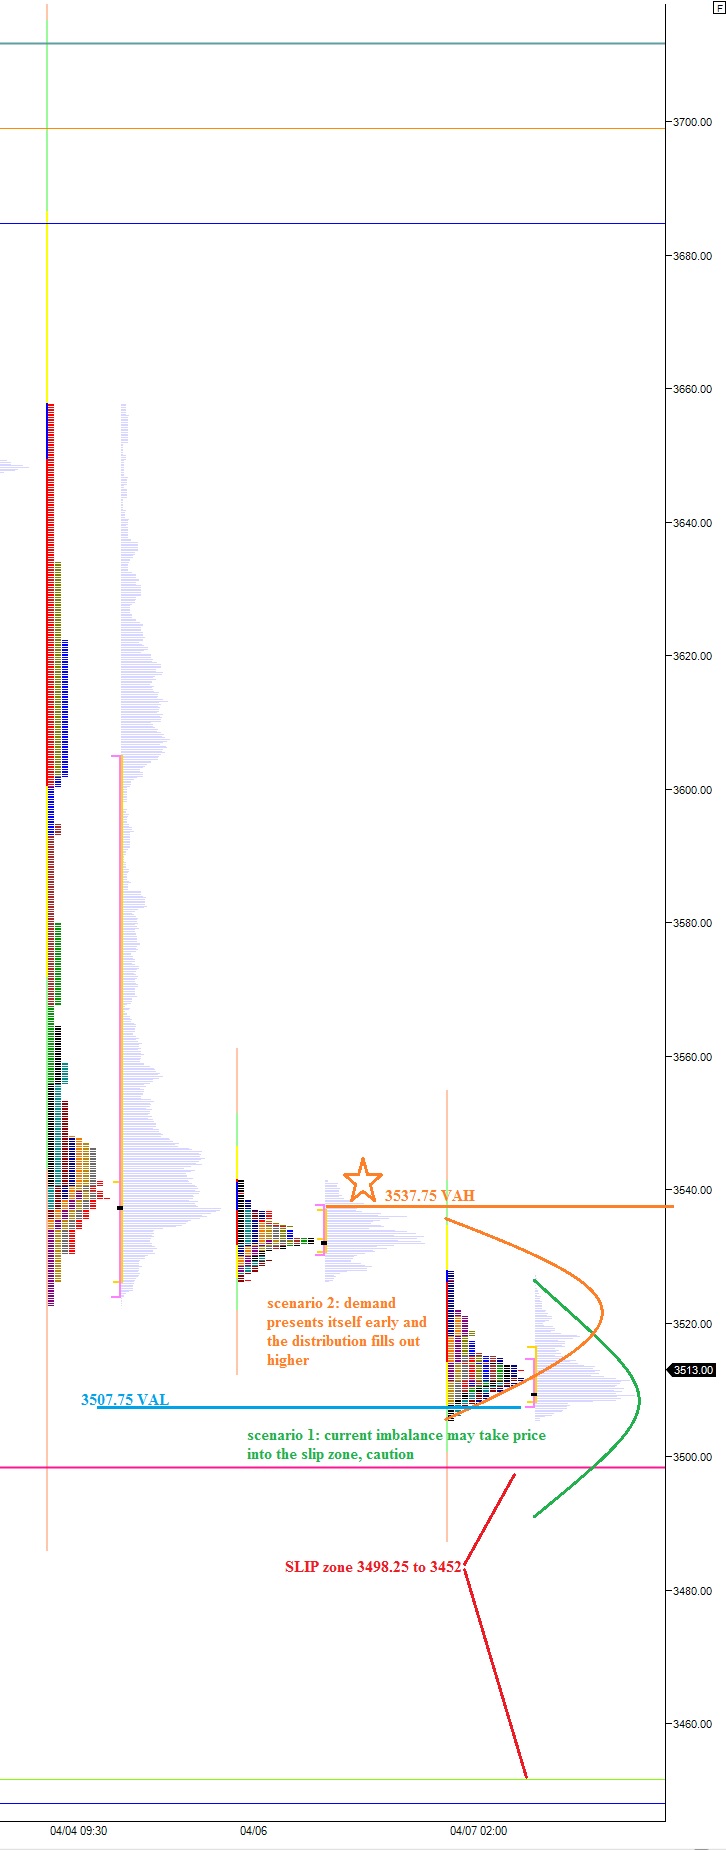
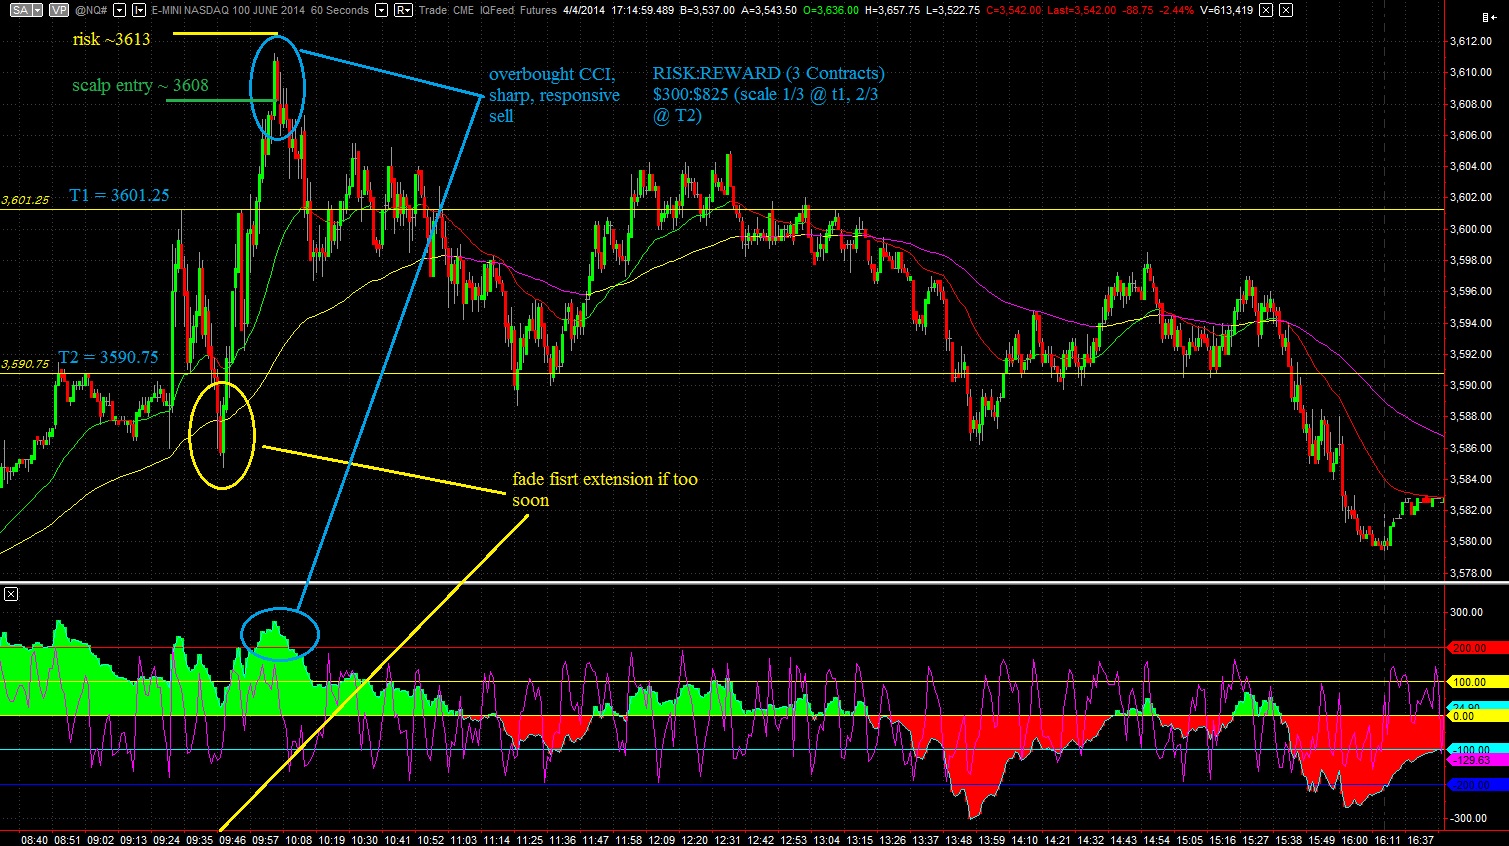
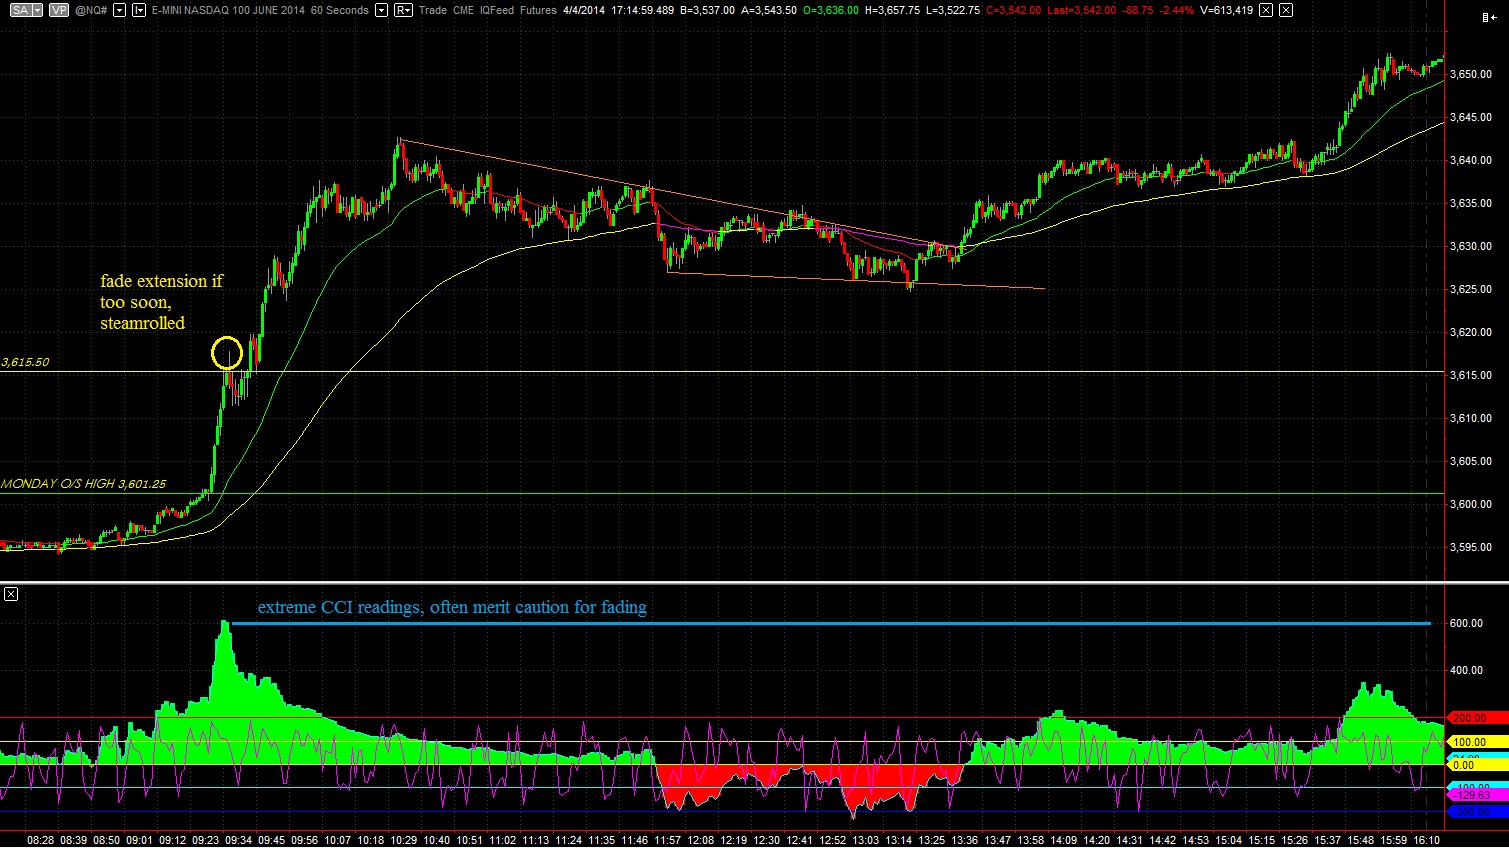
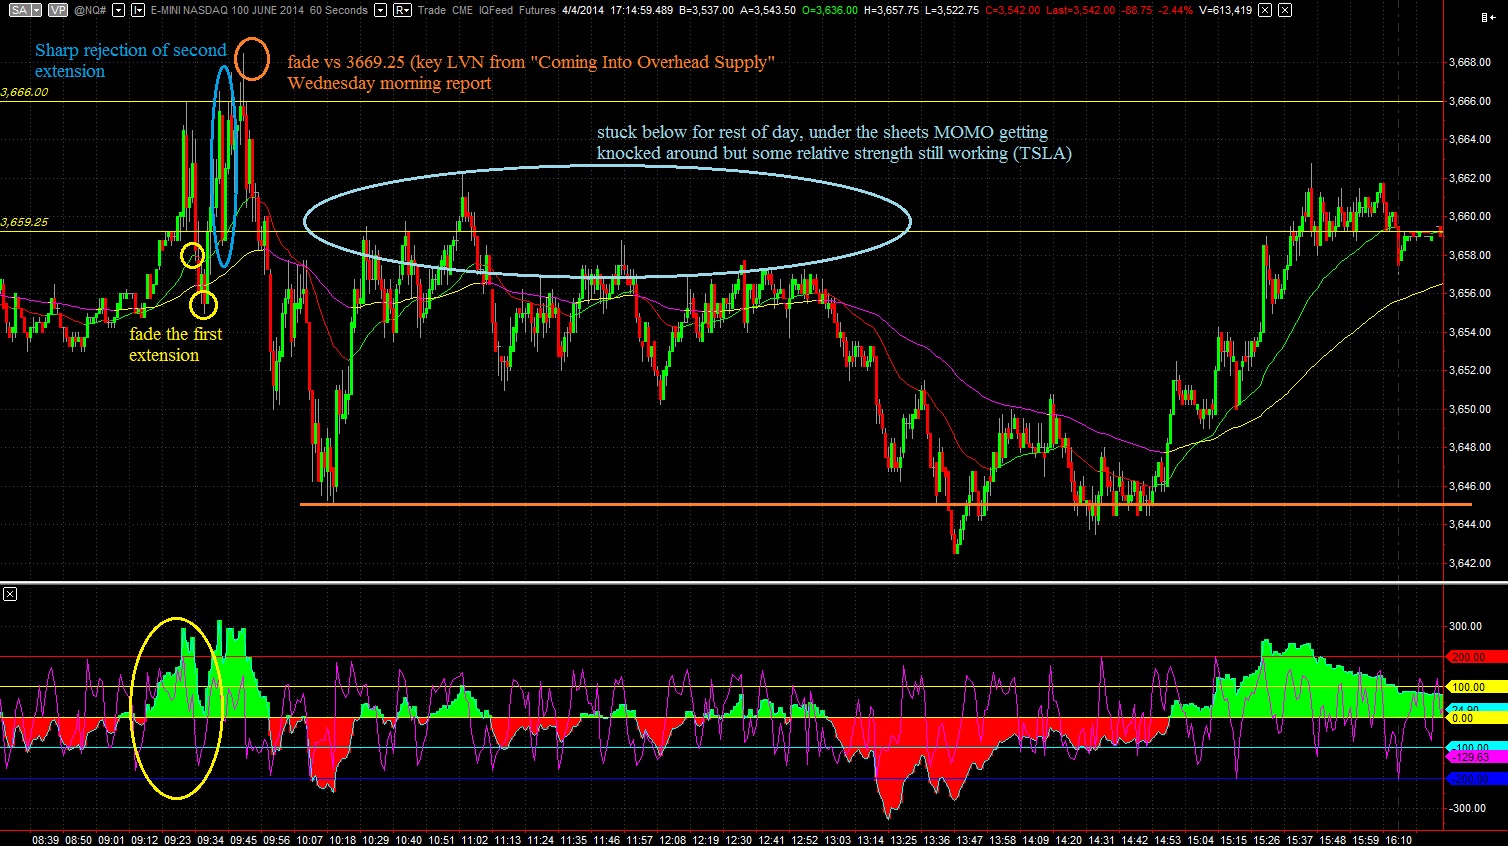
The short term auction is buyer controlled.  This can be seen as a migration of value higher as well as strong responsive buying tails on the recent profiles.  We are trading inside the price zone I highlighted yesterday as a low volume slip zone.  This zone is so important.  If buyers can finish trading up through it, and then gain acceptance via value up above 3602.25, this would translate well into gaining control of the intermediate term at best, putting the intermediate term auction into balance at the least.  I have highlighted this interesting zone on the following market profile chart as well as a few other observations:

NQ__MarketProfile_04102014

Comments »

To Live and Die in Momentum

Momentum stocks have beat me into a red YTD performance on the year.  They beat me good to teach me a lesson, much like the nuns of my youth.  Just as the nuns failed to beat their religion into me, nor can momentum stocks beat me into submission.  I keep coming back like a good little hellion.

When do they make money?  Is this time different?

Momentum stocks make money when they are trending with you.  Sometimes (like now) the trend on the daily chart loses its trend.  This is when a general upheaval is occurring.  Your faith is being tested and the devotees have not buckled yet.  Do you believe they have been put through real pain?  A real test like honest Job?  I think momentum names have gotten off easy so far…some of them.

That’s why I am only looking to buy the very best momentum.  I consider names like FB, TWTR, DDD, TSLA, YELP, AMBA and more the finest.  AMBA builds tiny state-of-the-art components for gopros and other low energy, high definition cameras.  These are great for drones and robots.  YELP tells me where to eat and gives me a microphone to blast out my hipster foodie advice.  DDD will print drones and robots and give us gadgetry for our homes.  TSLA wants to replace side view mirrors with cameras because it improves range on their ELECTRIC luxury cars.  Facebook is like a venture capital firm buying anything and everything amazing in California.

That’s all great, great stories and great prospects for the future.  LED lighting is more realistic and getting insane traction.

That’s great too but why are we really putting our money in the stock market?  To make money.

These stocks will make money on the way up.  Some of them will go to new all time highs fast.  Not all of them will, such is the game of stock picking.

These are my top momentum picks, right here right now.

#1 Twitter – I am blown away by the pessimism for this one.  They are practically ubiquitous in a few short years.

#2 and #3: FB, FSLR

Top positioning pick is still LED lighting.  I think there are so many misconceptions and misunderstandings of who is winning the business in this space.  CREE, RVLT, AIXG, PHG, and OESX in that order.  LEDS is pure jetsam, just trade it when you see fit.

A cocktail of the above will propel my account to new highs.  We might as well have some fun while we’re at it.

http://youtu.be/_m3B060jo_o

Comments »

Swing Trade Plan for $DDD

I started buying 3D tech this morning with a 1/3 entry.  This equates to roughly 3.5% of my risk portfolio.  My goal is to continue having price come against me so I can build to at least 2/3 in size.  If however we turn higher here, I will be obligated to take my first target and wait for a new opportunity to enter.

This trade is me getting back to my swing trading roots in my favorite industry, technology.  If I side with any political party it is the futurists.  I am intrigued by the people behind companies who are technology ambassadors to the world.  They are disruptive and have more potential then established cash cows.

3D is almost 50% off the high water mark we printed late last year.  This is an overreaction and a welcomed one by me, because I have been left out from owning this company for a very long time.

Without further adieu, here is my wish list plan for accumulating 3D technology.  Hopefully it craters after earnings, which I will be holding through:

DDD04102014

Comments »

Cut Through The FOMC Noise With Two NASDAQ Price Zones

If you do not have time to read the entire context report, skip to the last paragraph/chart for the Two NASDAQ price zones you need to navigate the FOMC reaction-to-the-reaction-to-the-reaction.

Buyers showed up overnight and as the USA warms up we have a slightly green NASDAQ market.  One of the features of this multi-week selling has been mornings which start strong only to be faded and eventually wind up with price closing near the low of the session.  However, just when you think you have the markets number it will throw you a slider.

Let’s have a closer look at the long term auction and why I suspect a bounce is near.  Also, let’s look at what will begin to worry me and cause me to really tighten my book up.  See below:

Weekly Chart (long term auction):

NASDAQ_WEEKLY_04092014


DAILY CHART (long term auction):

 NASDAQ_DAILY_04092014

Intermediate term we are still seller controlled but stretched.  This increases the likelihood of a big move in either direction, either a continuing to stretch the boundaries of the market to the downside or a snapback move.  With FOMC minutes out this afternoon, the likelihood is even greater.  You can see price has reverted back to my 33ema and paused.  The market is very likely waiting for FOMC minutes before deciding the next move.  More importantly to us is how the market reacts to the price reaction we see this afternoon.  This is not to say the first move is wrong or fake, but instead that long term participants are likely to be moved by the action and if they are we need to observe their order flow.  I have highlighted some key intermediate term levels on the following volume profile composite:

NQ_VolumeProfile_intermediateTerm_04092014

Finally the most delicious and powerful timeframe of all, THE SHORT TERM auction.  These profiles are set up more exciting then I have seen in a great while.  We have very low volume slippery zones on both sides of price right here, right now.  The short term is in balance with buyers trying to take the early initiative to break the balance.  On my market profile chart you will see a thick pink and a lovely chartreuse green line.  These two levels are the edges of where very low volume starts.  A breech of either (or both) is very likely to see an acceleration of price in that direction.  Which side of this environment we end up on will ultimately dictate the control on both the short and intermediate term.  In the meantime, it produces a massive trading opportunity to “go with” a move that penetrates either zone, intraday.  See below:

NQ__MarketProfile_04092014

Comments »

Doubling Down: Doing The Dirty

Everyone has a different style of trading.  These methods are forged by our own mental aptitudes and the experiences we accumulate in the marketplace.  Most of the time I want to own momentum stocks not because they are momentum stocks, but because they are the companies who have operations that actually interest me.  The challenge is managing the type of price action you can expect from the likes of Twitter or Facebook or Cree.

How about Chinese websites?  It seems like a good idea to have a few of the most popular sites from ASIA around, but good luck stomaching the daily movements.  This compelling story stock is a wild beast and riding it requires patience and strategy.

I put tons of time and research and machine hours into taking better market entries—entries which skew statistics in my favor.  That does not rule out order flow going against my entry.  One type of trade I take is to enter an oversold stock I like with a partial long.  Sometimes I take half positions, other times a third.  But I do so with a plan.  Therefore, I will lay out my plan, in the naked, for how I intend to play SINA, a stock as violent as they come.  Behold:

DAILY CHART:

SINA_daily

WEEKLY CHART:

SINA_weekly

The best trades take time and often fly in the face of recent market activity.  The above road map is how I will catch a momentum rabbit by its tail.  I’ll be keeping tabs on this one more gregariously than my recent trades.  More quality, less quantity positions, yes yes?

I never made my point, the point this post title alludes to.  If you are going to double down on a position, or average in, you better have a plan and stick to it when you are in the heat.  Hell that’s life in a nutshell so get out there and execute.  Plan and execute, plan and execute.


Comments »

Big Picture Shift

Index futures are flat to slightly down overnight as the market begins finding buyers and forming a balance.  As the USA warms up we are set to open inside of yesterday’s value.  This is a lower risk/reward opening position, however we are still in an overall riskier environment.

I continue to focus on my market profile which is a footprint of the short term auction.  The NASDAQ is coming into balance on a ledge.  If go back to the auction that occurred in early February last time we traded at these levels, then you can see a series of single print TPOs.  These signal two things: first there was very strong demand at these prices last time they traded.  Second, the thin volume is slippery and price can slide right down it.  Often times a legitimate volume pocket holds as support on the first test.  It is each subsequent test that weakens its defenses until finally a swift move zips right down it.  I have highlighted this level on my market profile chart.  It looks to be holding this time around:

NQ__MarketProfile_04082014
A short covering rally starts to make sense with FOMC minutes out on Wednesday.  A short seller who has made a profit from this recent move down may seek to lock in some of that profit ahead of a Fed meeting because as traders we have been conditioned to expect market movement during these times.  The intermediate term is very stretched too, which means the snapback becomes more likely as time progresses.  Have a look at the zoomed out intermediate term.  Note we also cleared an open gap dating back to February 6th.  Remember, gaps always fill, but timing is key.  Can you imagine waiting through all of February and March for this gap fill?  You would be insolvent.

NQ_VolumeProfile_intermediateTerm_04082014

The long term auction is starting to look balanced.  It has been buyer controlled for a very long time and today is the first day I am changing my perception of the long term auction.  It is in balance.  My expectation now is for the long term auction to go range bound.  That means it is time to start trading futures again.

In summary, balance on the short term, seller controlled and stretched on the intermediate term, and the long term auction is coming into balance.  I am cautiously looking to build longs here for a snap-back higher as the long term auction settles into bracketed, balanced, range trade.

Comments »

Wanted: a New Broker

Several traders are laying their YTD performance out thus I want to let it be known I am down 9.5% as of today.  It could be better, it could even be green, but I have deviated from my plan a few times.  A few other times a bit of complacency led to excessive bloodshed.

This market is much less forgiving then the last 18 months or so, therefore when you deviate from your plan you get punished.  It’s that simple.  Moving on, I continue making mistakes.

I should not have sold out of ZNGA today.  The reasoning for selling ZNGA was the NASDAQ getting down into the slip zone I highlighted this morning.  I suppose a snapback rally could erupt overnight in the NASDAQ, but I do not like to lean on the lows when we are in these slip zones (single TPO prints).  Price tends to slide right through them.  Whether or not this derails ZNGA is another question because the chart actually held up really well—even on some heavy volume.

I wanted to buy Z this morning but missed my fill.  I few minutes later the option I was stalking had doubled in price.  By the end of the day the same price was 40% lower.  Talk about ultraviolent…

The LED trade, which hasn’t worked in 3 quarters, still isn’t working.  But, it’s not going into a death spiral, yet.  RVLT is still my largest position and they dropped a hot new product recently with the 100% plastic fluorescent tube light retrofit.  The heat sinks, which are normally aluminum or other expensive and heavy metals, are made from a plastic.  Huge news, I love it.  Perhaps it will breathe some life into the dead money stock.

I made AMBA and TWTR large today.  That was before we entered the slip zone.  I thought we had found buyers ahead of the zone.  We did, just not enough of them.

The discovery process continues.  This is how auctions work.

Finally, if anyone has a brokerage they trade futures through who is simply fantastic, please let me know because I am in the process of leaving Zenfire.  They no longer work with my Multicharts interface and my algorithms are raging beasts in this wide-ranged market.  It’s time to take them live.  Any brokerage feedback is appreciated. I swear allegiance to none.

Comments »

Finding The Origin of Demand

Index futures are down overnight as the selling which quickly began mid-last week spilled into the globex session.  The entire move was quite exhausting as the USA comes online we are seeing some early buying interest.

My main focus today is on the short term auction.  Price has come down to a very interesting level on my market profile.  We are reaching a level where demand was once very high for equities.  I can tell this by the dynamic footprint which was left behind as a long and thin single print of TPOs.  As we come into it from above, the risk is slipping down the4 viscous slope where demand once existed.  The contrary move would be for us to not breach the upper reference point just before the slip zone.  I have highlighted where this slip zone begins and ends on the following market profile chart.  Should we not breach this level, I may be a buyer early on:

NQ__MarketProfile_04072014

The intermediate term is seller controlled after briefly coming into balance.  The market was able to make a higher low, higher high briefly before the big liquidation snap Thursday and Friday.  For a moment we came into balance but when price travelled into overhead supply the market became overwhelmed with sell flow which was abundant compared to demand which was nearly non-existent for the two days.  Since then we have made a lower low putting sellers in control.  I suspect a revision trade will take hold at some point this week and return price to my EMAs.  I have highlighted a few key price levels on the following volume profile composite.  We are set to open nearest to 3511.25:

NQ_VolumeProfile_intermediateTerm_04072014

The long term auction is certainly in question.  One could perhaps make the case for buyer control based on the February low being below here.  I am not quite as clear on the long term.  I will call it buyer controlled with a 50% chance of balance taking hold.

Comments »

Opening Swing: The Doppelgänger

These last few weeks have been as risky as any I have ever seen for momentum trading.  The NASDAQ has been suggesting this environment via large ranges, big overnight gaps, and harsh periods of selling.  Through all the difficult market conditions for stocks, you can still see a clear auction taking place in the futures.  The reason for this the natural forces of a marketplace.  I strongly recommend anyone who speculates establish a firm grasp of auction theory before applying their own layers of technical analysis, risk management, statistical arbitrage, or any other strategy you prefer.

The opening swing is an important piece of the auction.  It sets the initial range which buyers and sellers can use as reference points for their buying or selling campaign.  I have a rule that says I cannot take any trades until at least one of the opening swing levels has been established.  It does not take long, but it gives you the first bit of fresh intraday data to measure your trade against.

Thursday morning we printed an opening swing inside of an opening swing from earlier in the week.  I saw this same occurrence last week here http://ibankcoin.com/raul3/files/2014/03/NQ_OS_03262014.jpg

I affectionately refer to this tight buildup of pressure as The Doppelgänger for reasons outside trading.  I was in literally the strangest meeting of my entire life when this all went down Thursday.  I returned to my desk and found my book tossed into a massive inferno.  But there was really no word more capable of describing the condition.  Therefore you may see me reference The Doppelgänger going forward.  And it will be interesting to see if it continues to play out because it represented a huge opportunity the two times we have seen it. Riding the trend that explodes away from it offered 3 trades with tons of meat.

Without further adieu, here are this week’s opening swings and my observations of the opportunities they create as well as the risks associated with said opportunities:

MONDAY:

NQ_OS_03312014

TUESDAY:

NQ_OS_04012014

WEDNESDAY:

NQ_OS_04022014

THURSDAY:

NQ_OS_04032014

FRIDAY:

NQ_OS_04042014


Comments »

April, Fools

I did one thing well today and that was to trade off my TSLA YOLO runner just in the nick of time.  I was pretty astonished to later check back and find the final piece I had sold for over nine bucks was trading for pennies.  That is the double edged sword of weekly options friends.  You best protect your neck.

Everything else melted on my and I am down back to -8% after being UNCH for a moment this week.  That is how ultra violently my book swings, a concocted portfolio not suited for the faint of heart.  I am younger then you, remember, I can stomach such madness and then go play Frisbee and pet my dogs, the only other life-beings I am responsible for.  To hell with the cats, they can sit in the rain.

Believe it or not, I really liked the NASDAQ this morning.  I was buying the blood.  I even had a nice trade going in the QQQ options.  I scaled 2/3 off for 25% profit, price quickly returned to my entry and then went lower, I reloaded, the pop never came, I bounced.  It was very methodical and it helps indicate to me a selling drive was truly taking hold and liquidation was imminent.

I sold off my LULU and GOGO once this became clear.

It should be noted my bastard helper algo Elroi never once considered going long today.  Instead he had his best day on record.  Have a look:

ELROI_AprilFools

Finally, anyone interested in intraday trading or the early effects seen in-and-around the opening swing NEED NOT miss this weekend’s edition.  I will be introducing a new powerful contextual condition I affectionately refer to as The Doppelgänger.  See for your own eyes the condition that precluded this great NASDAQ selloff.

If you’re bloody and beaten like me this week, then find something else in life that you are making progress in and hit it hard to clear this stock business off the mind.  I’m off for a swim.

Comments »