iBankCoin
I turn dials and fiddle with knobs to hone in on harmonic rotations
Joined Oct 26, 2011
4,121 Blog Posts

Pressing Boundaries

We started out last Thursday with a 50 point gap down.  The move was partially attributed to questions of insolvency at Espirito Santo, one of Europe’s largest banks which is located in Portugal.  This morning we wake to see Euro-Zone stimulus announced by “Super” Mario Draghi, one trillion.  Central banks continue to be the primary driver of market prices, and we are waking up to nearly 20 points of upside in the Nasdaq futures.

Price stalled out overnight after taking out prior swing high by one tick.  The 1-tick is sometimes the preclusion to a failed auction.  However swing highs and lows are rarely made outside of the cash session.

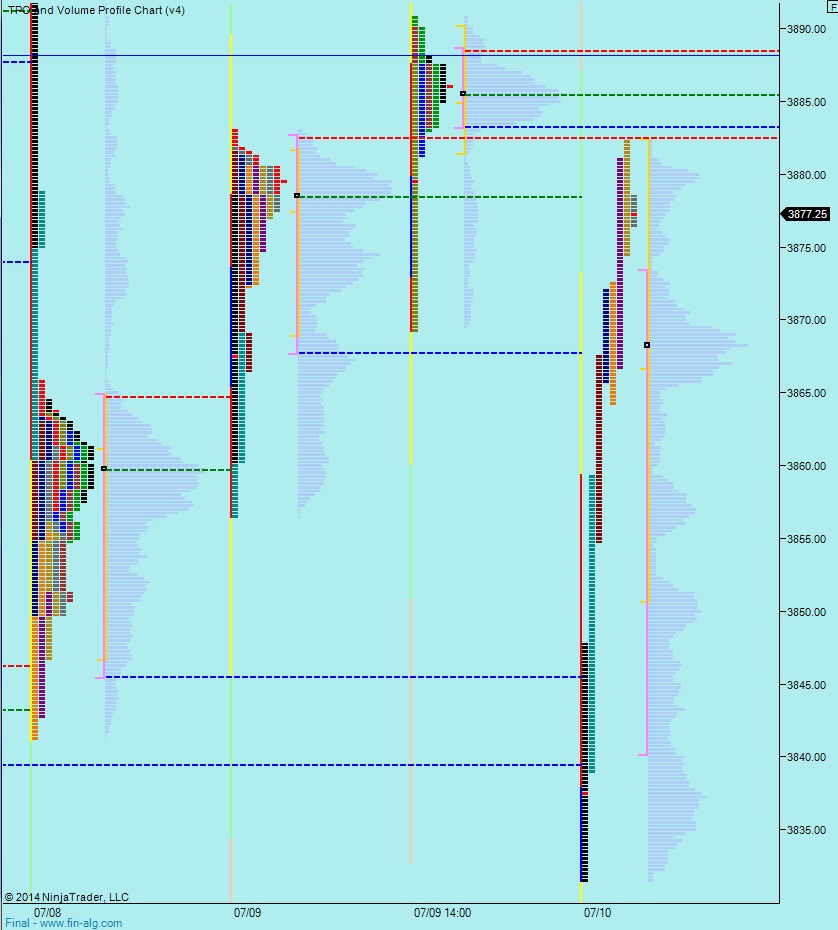
The monthly volume profile chart shows us forming a high quality distribution up here at the highs.  This suggests market acceptance of these prices and is a positive as we go forward.  Whether we go higher today from here or retrace a bit first, seeing this type of distribution form tells us a sharp rejection of these prices has not occurred:

07142014_Monthly_NQ

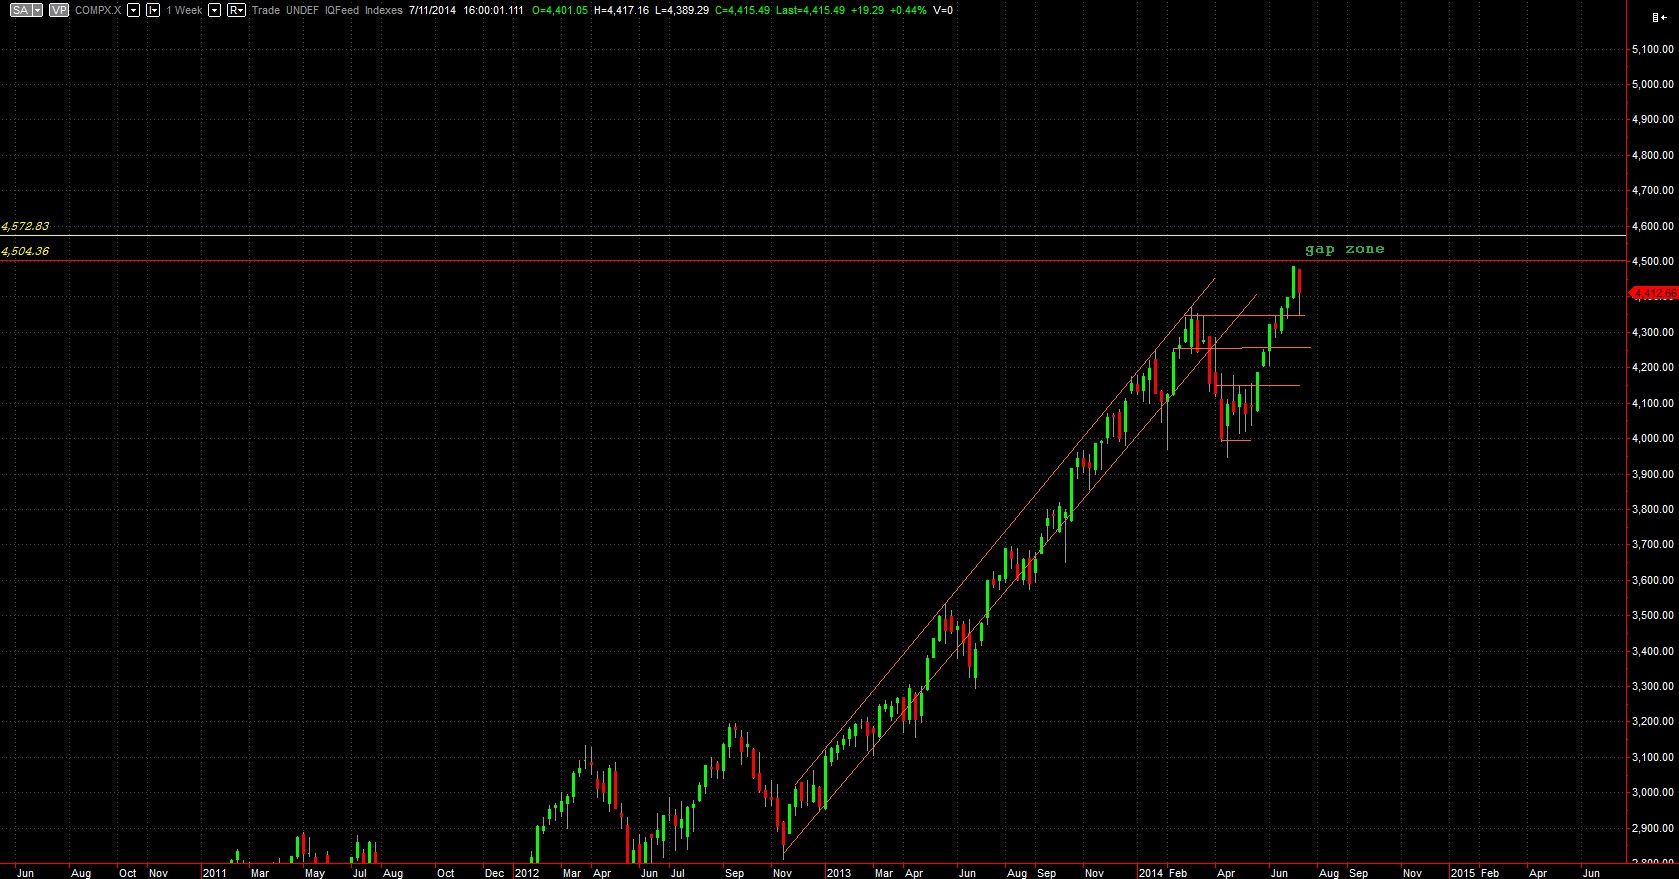
On a weekly chart of the Nasdaq, we can see a responsive bid coming in last week (seen as a long tail on the red candle).  There was an uptick in volatility yet buyers continue asserting a control on the long term, see below:

07142014_Weekly_NQ
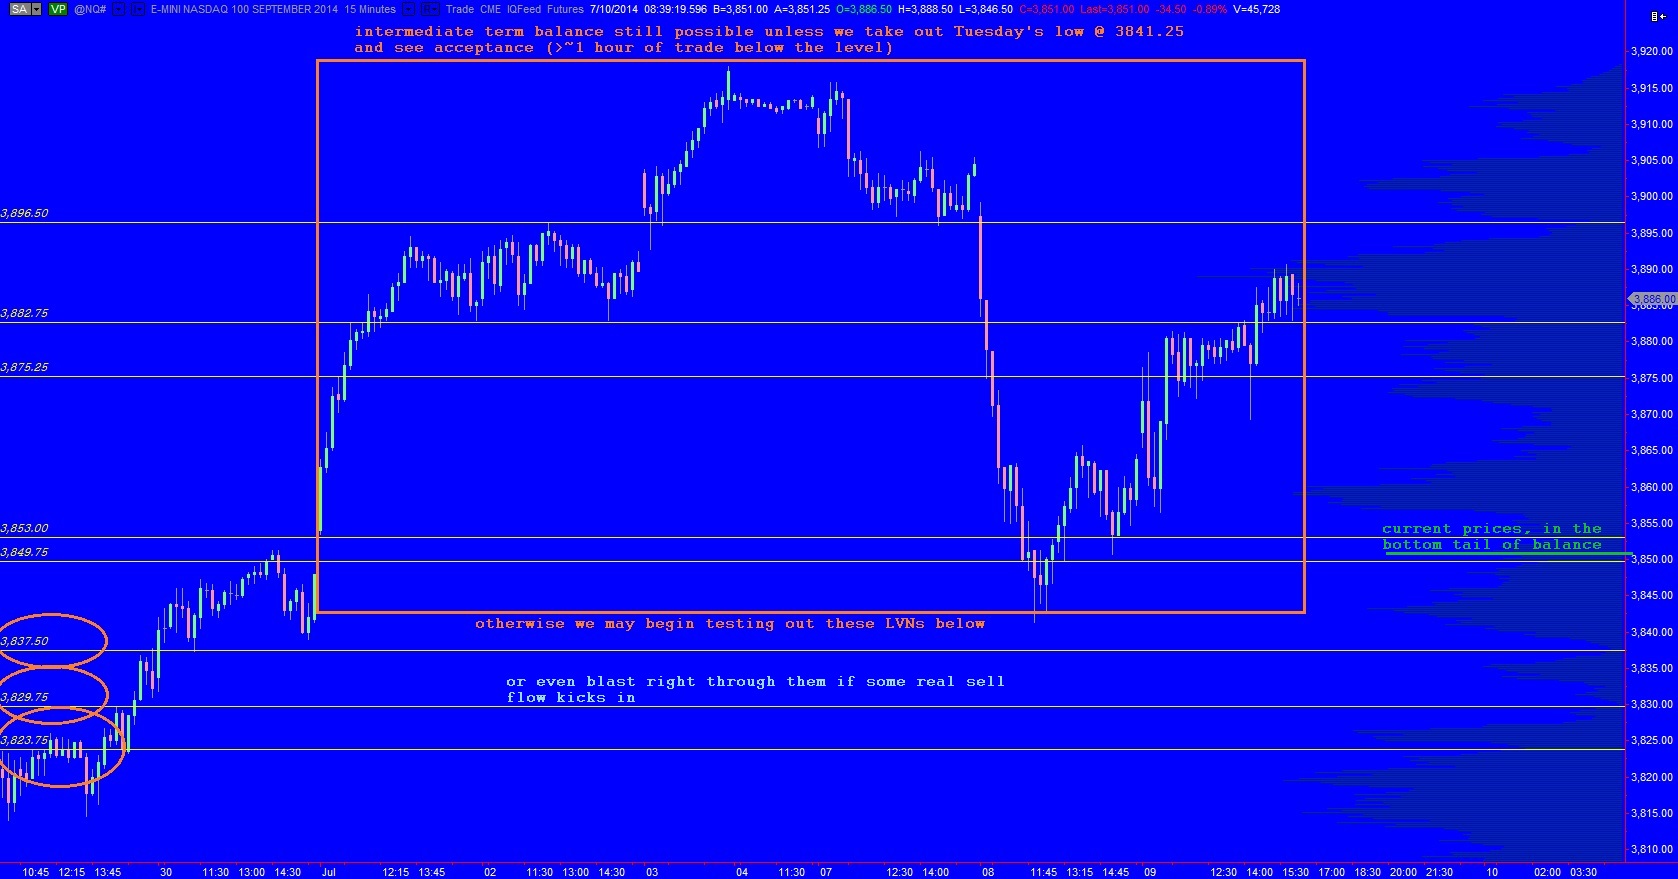
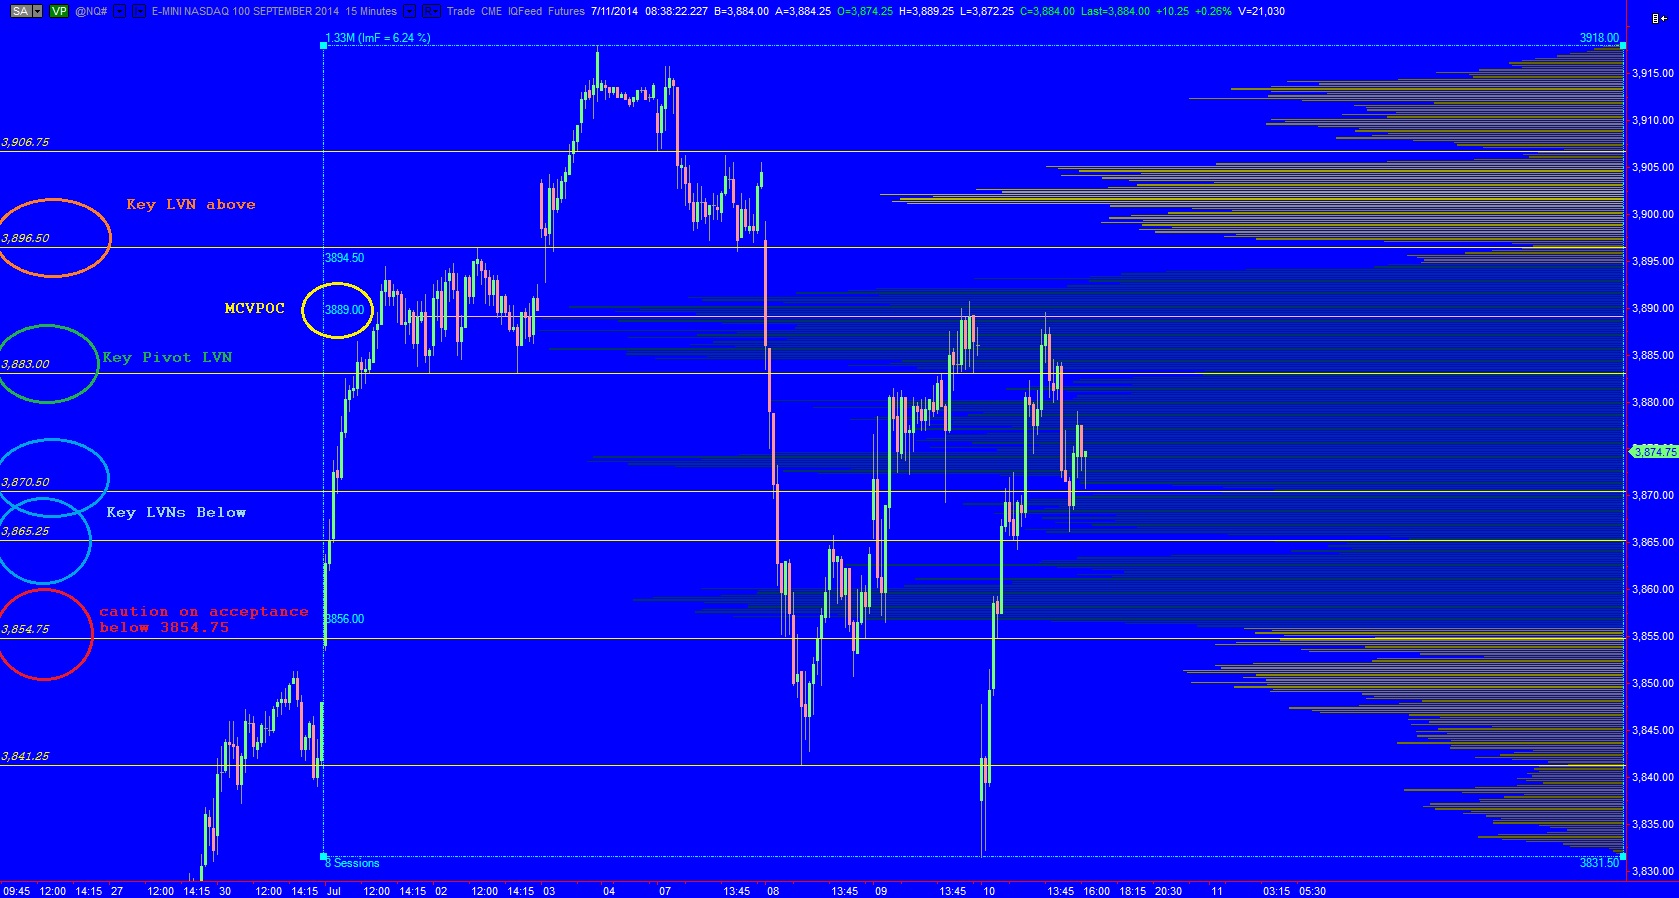
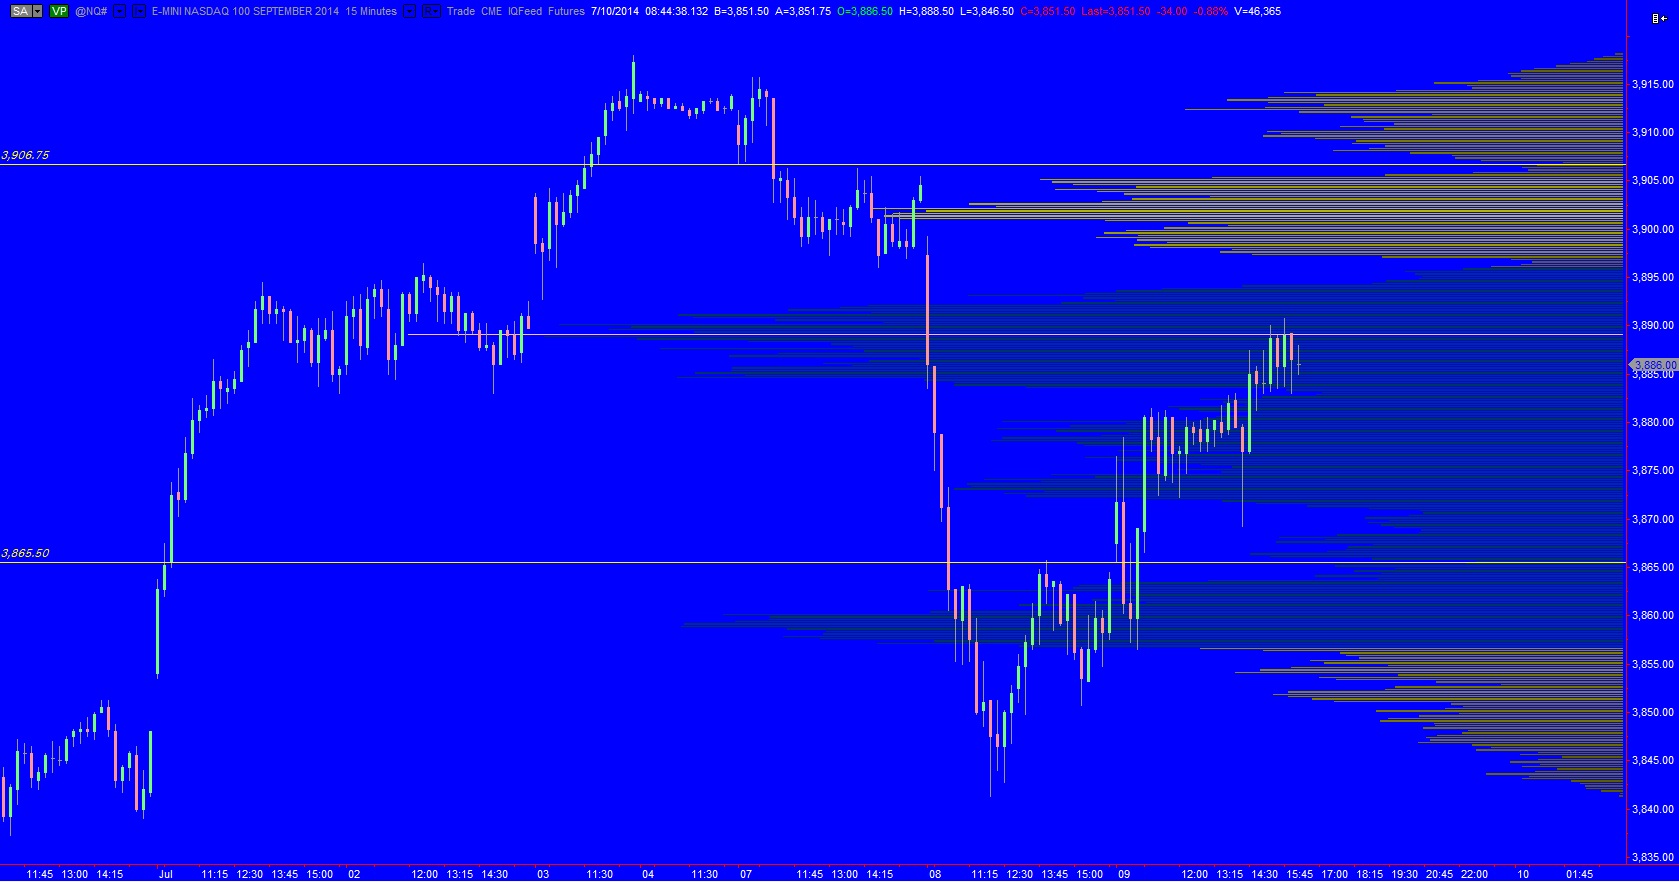
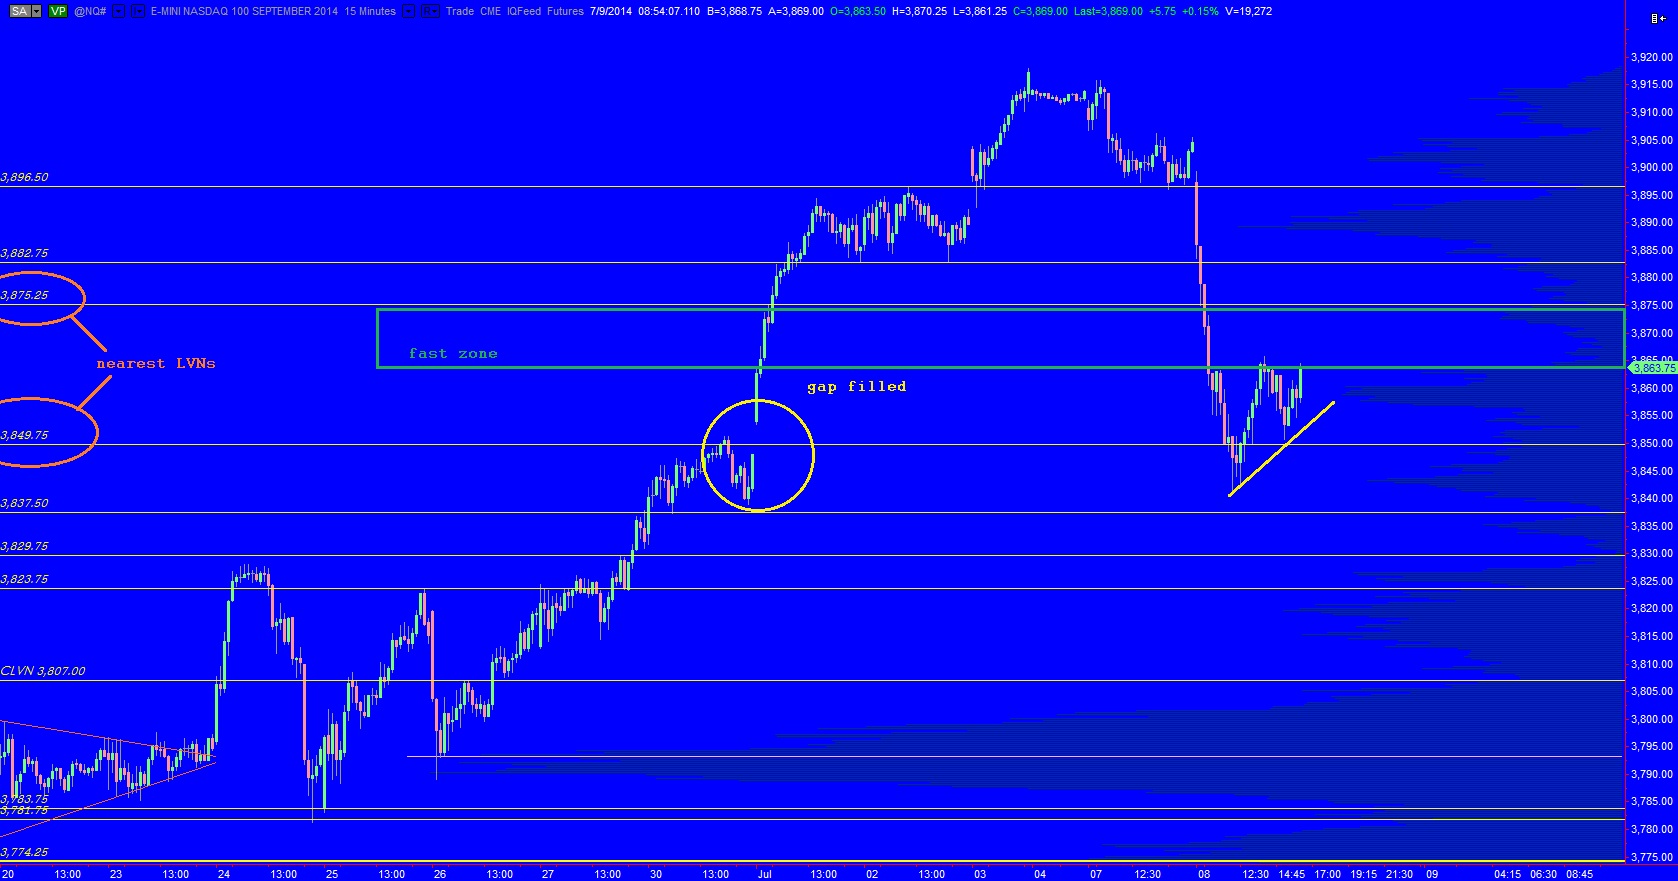
The auction can be seen best on the intermediate term.  The last nine sessions have done a wonderful, albeit fast, job of establishing a low bid and then beginning the process of auctioning higher in search of an upper boundary.  The net action has produced balance for the month of July.  We are coming into today’s session much like last Thrusday, only with the gap pressing us up against the high of intermediate term balance.  We do not have quality markers above for assessing whether we are leaving intermediate term balance.  Instead I will look for sustained trade above our current swing high at 3918 and a measured move higher without sharp responsive selling.  I have highlighted the measured move targets below, as well as the nearest low volume nodes for assessing any selling back into the intermediate term range:

07142014_IntTerm_NQ

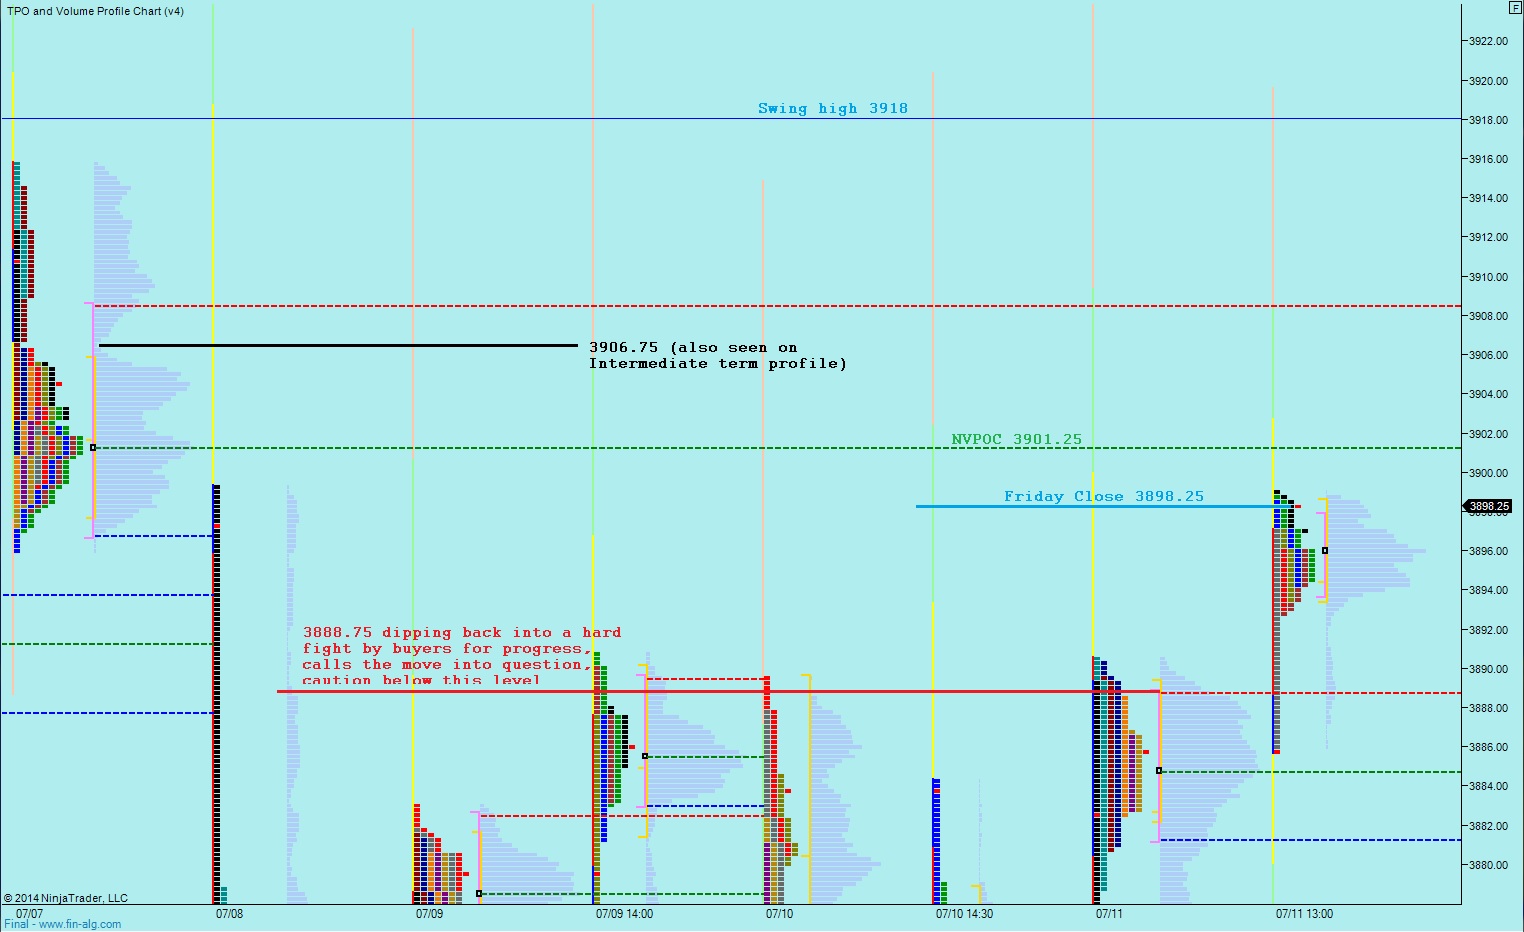
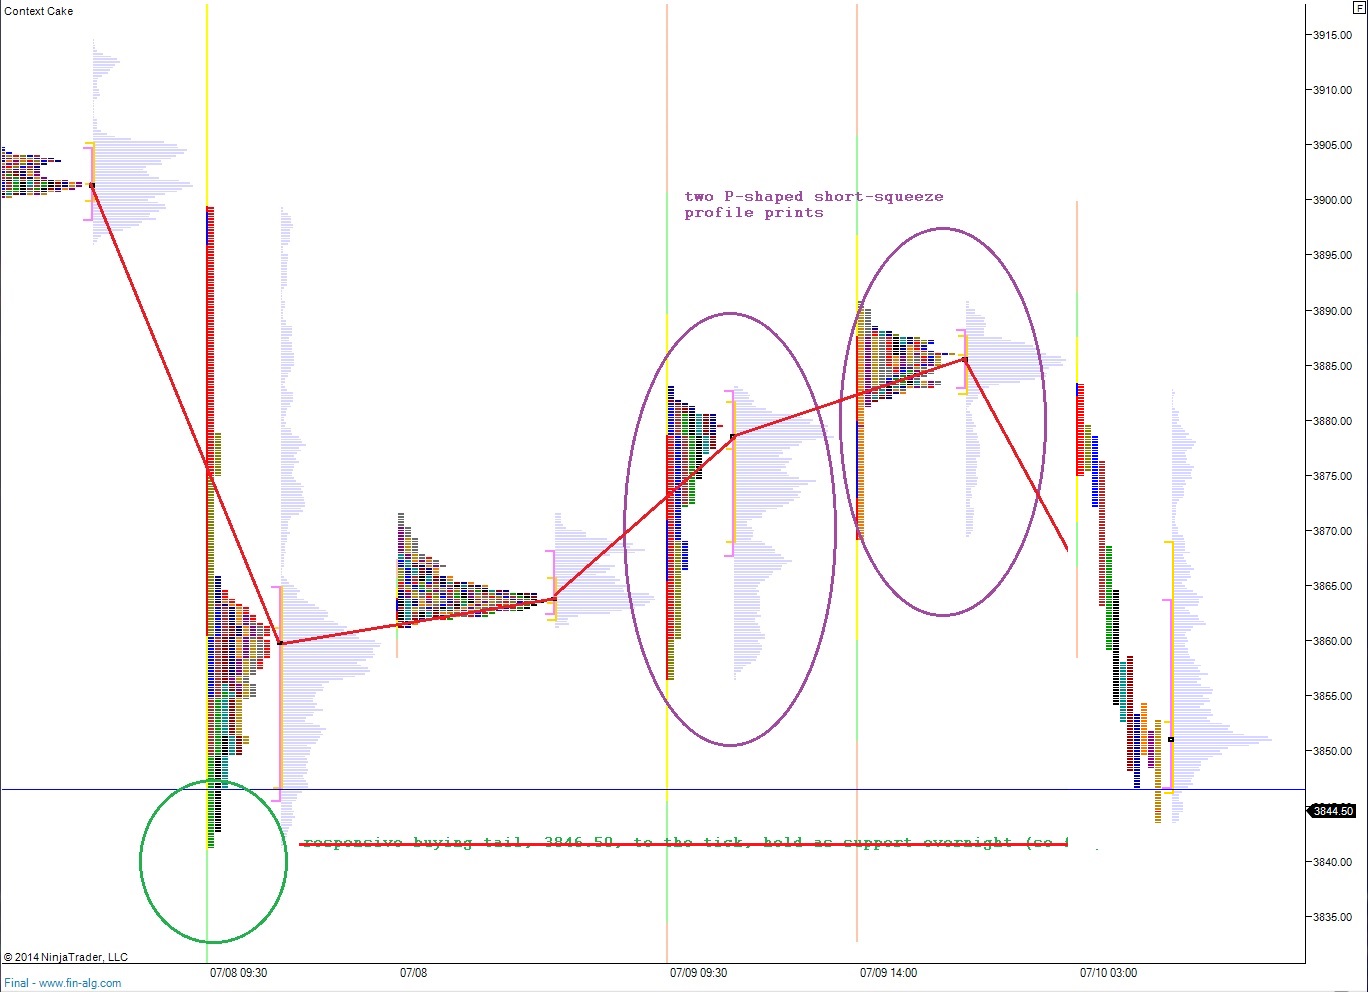
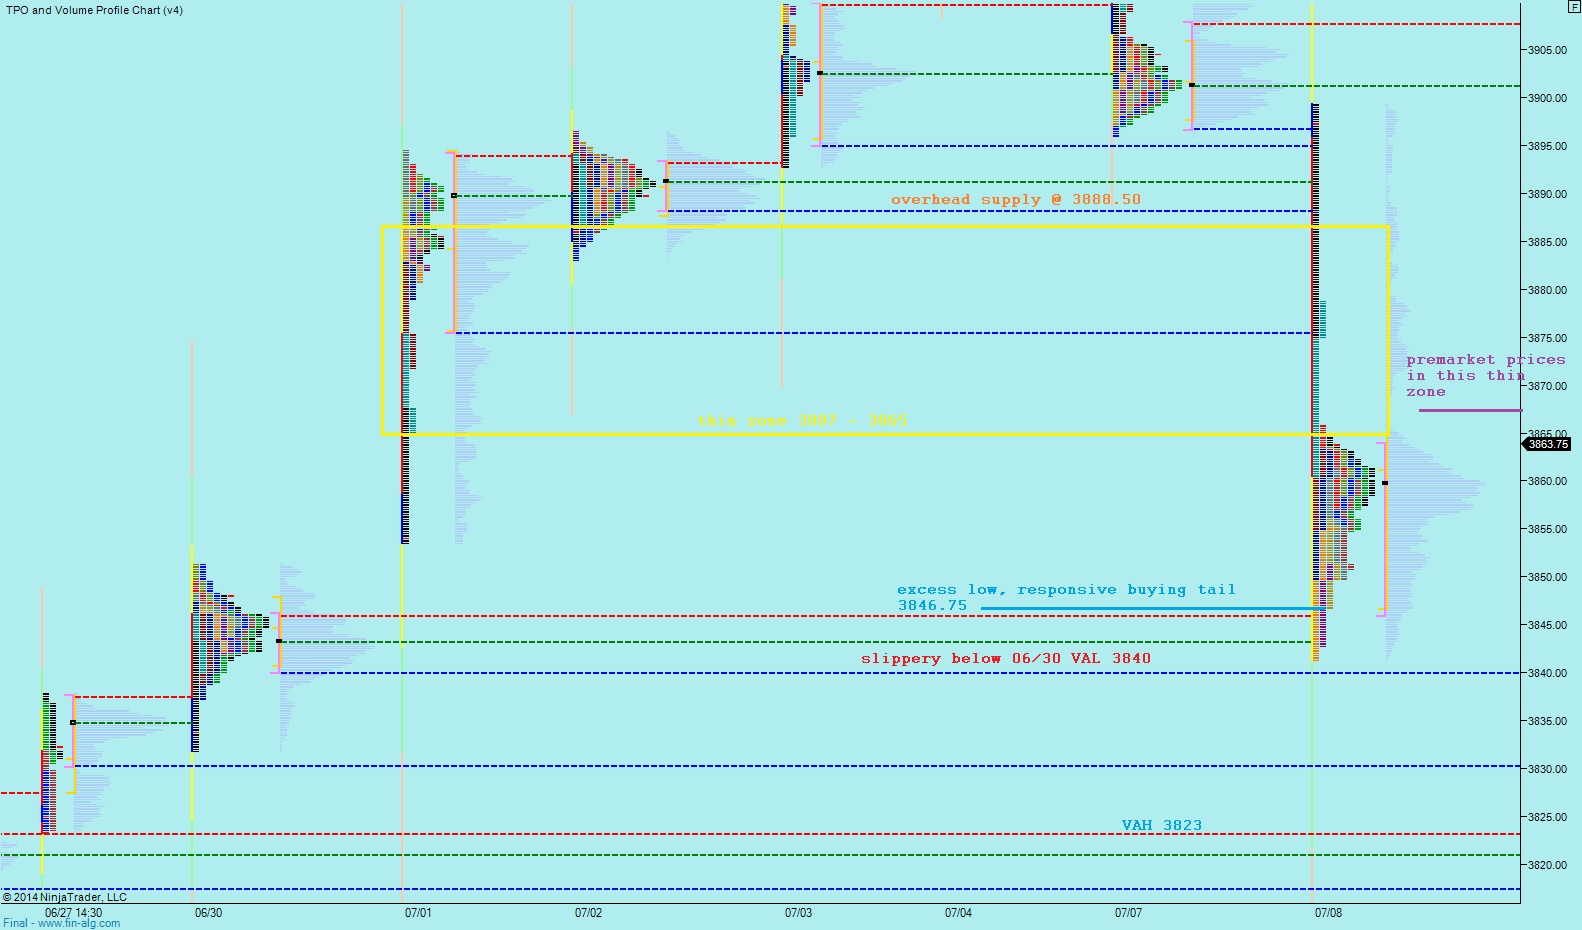
Finally, here is a snapshot of the market profile heading into the week.  I have noted the price levels of interest as well as a few other observations below:

07142014_marketprofile_NQ

Comments »

What Is Market Profile?

A few times a year I see a spike in intrigue regarding market profile.  Being one of the few bloggers who consistently produces real time market profile analysis I enjoy the discussion influx.  What I enjoy even more is “when” the spike occurs—usually when uncertainly perks up in the marketplace.  This week was no exception.  When the rug was pulled out from under the indexes the tool flexed its muscles.

Market profile is like a very powerful weapon.  Imagine you were in a battle and possessed a device or tool which could completely devastate the opposition.  The key is knowing when and where to deploy the weapon and to assess the carnage (or lack thereof).  Misused and it only creates confusion in the field.

Market profile is not a timing tool.  It is not predictive in nature.  What market profile provides is context and potential opportunity.  The charts are graphical representations that allow us to clearly see the market as an auction and assess who might be participating in the auction, what they are trying to do, and how good of a job they are doing in their efforts.

Think about other ways you can obtain context.  If you like, think of yourself as a General tasked with capturing a territory, what information would you want to have?

The size of the opposition, their location, their behavior in past encounters

Intelligence from the people who are on the ground, insiders and spies

Weaponry, drones

Maps or satellite imagery of the land

Market profile satisfies most of these contextual pieces.  The size and location of “supply” above can be seen as a high volume node, long thin stretches on a TPO show participants reacting to an attack or initiating an advance.  Thin volume zones which never received a proper battle may serve as an easy land grab or might be barren for a reason, like they are fortified with conviction.

Intel comes from the traders, the pros.  Intel comes from the iBankCoin brain trust.

Lets end this discussion with an excerpt from last Thursday morning, when we woke up to a 50 point gap down in the Nasdaq:

“Thus far the responsive buying tail from last Tuesday has held as support.  Whether or not it holds through today will be an early clue as to whether we sustain intermediate term balance or move into a seller controlled environment.”

This was key intel for early in the session, something to lean on before panicking out of your longs.  Here was the map:

07102014_IntTerm_NQ


Comments »

Discovering Balance

Nasdaq futures are up a touch after ceding some of their gains as we approach cash open.  There were no major economic releases this morning aside from Canadian unemployment data with the main items on the US docket being Fed’s Charles Plosser speaking at 11:15am and Charles Evans at 2pm.  We also receive the Treasury Budget at 2pm.

The intermediate term held onto balance, barely, with the big responsive buying gap fill trade yesterday.  I have highlighted the very significant price levels to monitor as we progress through today and perhaps early next week, the levels that will give insight into who is jockeying for control of the balance:

07112014_IntTerm_NQ

I have walked through the market profile on the following chart to give a sense of what the market has done this week:

07112014_marketprofile_NQ_whathasthemarketdone

What the market is trying to do is find balance on the short term after being jostled out of balance by the big selling early in the week.  The question is where we balance and how it fits into the longer timeframes.  The balancing process is going well.

I have highlighted the key short term levels on the same market profile chart without the descriptions being in the way:

07112014_marketprofile_NQ

Comments »

Trade Statistics Session

Below you will find a brief summary of my trading statistics since we started the month.  Key data that jumps out of me are as follows:

  • Plan compliant trading carries an 86.2% win rate
  • Non compliant trades lost a net total of 183 ticks or $915.00 trading a 1 lot
  • Winning trades last twice as long as losing trades (let your winners run)
  • Almost half of my trades are whimsical, impulse, unplanned trades. WTF?
  • Eliminating half of my impulse trades only improves the win rate to 62.4% aka not good enough
  • There are 4-6 quality trades available per trading day

I failed to complete stage 1 of my trading plan during this set of trades.  The goal is simple, a 70% win rate over a set of 50 trades.  To do so requires supreme patience and complete avoidance of unplanned trades via impulse management.  I have just two trading pictures.  Technically 4, two shorts and two longs symmetrical in nature.  If you have been paying attention to my full disclosure trade entries then you know my pictures too.  The challenge is to consistently seek only my two quality pictures and avoid the other trades.

Finally, this is 1 lot trading and the next of all my trades is an egregious -1 tick loss.  Commissions equal about $280.00 bucks.  This is a cheap but necessary education if you ask me, a core building block before advancing to more size and employing trade management tactics to achieve consistent profitability.  The key is to actually learn because what I am currently wasting is the greatest resource of all—time.

STATS:

071002014_stats

VIDEO:

Comments »

Happy Feet

I need to limit my trading to my most sure trades.  I may sound redundant today, seeing as I said this yesterday, but this needs to happen ASAP, tomorrow.

I am feeling it, these juicy Nasdaq days are becoming very comfortable and my confidence is increasing.  I can see consistent profitability because it is so close.  I am not finding new hurtles, it is the same hurtle over-and-over, impulse entry into unplanned trades.

The key trades, the ones that matter, seen as letter-A and -B grades on the below chart are going really well.  My confidence in these trades is so great that I venture into the dark world of unplanned trades.  In the dark world of unplanned trades I sabotage my own success.

These unplanned trades I take, they’re actually decent opportunities but I do not have deep enough pockets or the confidence to trade them.  Look at some of my losers—right idea but lacking the confidence of my tried-and-true.  I need to keep my emotions in check, especially on these big days where confidence might cause mistakes (like it did today).

One hurtle before I can increase to a two lot.  And a two lot trader is a dangerous trader because on these big days my entries yield much more than my first scale.

07102014_performancereport

In my stock book I salvaged some premium off yesterday’s TSLA YOLO and bought some MVIS. Otherwise sitting put until something material changes.

Comments »

The Four Questions

What has the market done?

Big gap lower overnight on fundamental news.  Open auction outside of range finds strong conviction responsive buying.  Nasdaq futures opened at a perceived discount to value.

What is it trying to do?

The market is now attempting to discover what the value of the contract is.  We are out of balance and thus we attempting to define key responsive sellers after a drive higher.  We are starting to see counter rotations lower since the close of the European session, especially before the low volume node at 3883.

How good of a job is it doing?

We are doing a good job bidding higher, the volume is average and the rotations are enticing the other time frame to participate.

What is more likely to happen from here?

From here we are likely to begin coming into balance.  The range on the NQ is already 50 points wide.  The short term trend is up making the possibility of a complete gap fill to 3886 distinct, especially if we trade through this LVN at 3883.  Otherwise we retrace back to today’s current  VPOC at 3868.25 and balance out into the close.

CHARTS:

07102014_IntTerm_NQ_7day_afternoon

07102014_marketprofile_NQ_afternoon

Comments »

Pro Gap Territory

Nasdaq futures are sharply lower overnight on a session of nearly uncontested selling.  Whether or not the affect, there were some troubling numbers from Japan overnight on the economic front.  Year-over-year machine orders were expected to come in at 10.1% but the actual change was -14.3%.  The action really accelerated around the release of UK Trade Balance data which came in worse than expected.  US Jobless Claims data just came in slightly better than expected and we are continuing to see sell flow.

Hindsight is always 20-20, but looking at the profile prints from yesterday (splitting the session at the FOMC minutes) we can see two distinct P-shaped profiles.  These suggest a short term phenomenon was occurring, a phenomenon called the short squeeze.  We have seen these prints mean very little for the short term recently, when they occur in the context of a longer term uptrend, but in the wake of Tuesday’s liquidation they were a clue that the sell trend might continue.  Thus far the responsive buying tail from last Tuesday has held as support.  Whether or not it holds through today will be an early clue as to whether we sustain intermediate term balance or move into a seller controlled environment.  The first chart below is a 24-hour market profile, the second is an intermediate term volume composite, and the third is another intermediate term volume composite drawn over the past 7 days to show the possibility for intermediate term balance:

07102014_marketprofile_NQ_24hr

07102014_IntTerm_NQ

07102014_IntTerm_NQ_7day

I have noted the short term market profile levels I will be observing early in the day on the following market profile chart:

07102014_marketprofile_NQ

Comments »

Improvement Needed but Better

The /NQ is oozing with opportunity this week.  Big ranges and lots of intraday rotations mean plenty of ways for quality trade pictures to present themselves.  The issue for yours truly is sticking to only trading the most “sure” or quality trading pictures.  It comes down to impulse management, structure, and patience.

My trades were in the green today, but my performance is still below my desired win rate.  I see two opportunities where I can increase the win rate.  The first is being extremely selective when qualifying a trade and the second is recognizing when trade is “local-to-local” chop and if caught in said chop then giving my position just a bit more room once it is wrong which could allow me to scratch the position instead of it being a loser (see trades 5 & 9).  This tape reading skill, knowing when the action is other timeframe (OTF) verses local-to-local is rarely taught by the “educators” mainly because it is difficult to present on a chart or with words.  It is an order flow/tape reading skill few properly understand.  Definitely worth giving some thought to, but definitely not a ticket to loosen risk management much.  Developing…

Here’s my full disclosure trade set:

07092014_performancereport

I joined @RC on the YGE long and bought a very small TSLA YOLO today, otherwise I stayed put.

Comments »

Fast Open, Slow Through Lunch, Fast Afternoon

The Nasdaq is up about 5 points ahead of the US cash open after a slow grind higher of an overnight session.  The major economic news overnight came from China who released CPI and PPI data both of which came in below expectations.  Here in the USA, we have crude oil and other energy data set for release at 10:30 and then a 2pm FOMC minutes release.

If we open where the market is currently priced, then we may seem some sharp moves off the open because we are in a very thin pocket of volume left behind during yesterday morning’s liquidation.  It will be interesting to see if responsive buyers show up to defend the overnight drift when the cash market opens.

Yesterday the process of establishing balance accelerated.  Price moved sharply lower to entice responsive buyers to participate in the market.  The elevated prices prior to the selling were deemed unfair short term and the balancing process began on the intermediate term.  All of the upward progress achieved at the start of the quarter was tested and the gap which started the month/quarter was filled.  Markets abhor a gap, thus seeing it back-and-fill is a net positive for the overall structure of the intermediate term.  The market was trying to test the conviction of last week’s buy flow, to see if a strong bid truly existed at these prices.   It did a good job, as you can see below responsive buying showed up.  Whether buyers defend again today or progress higher will help us understand if we are truly coming into balance intermediate term or whether more selling is needed.  I have marked the relevant price levels below:

07092014_IntTerm_NQ

Short term we can see the sharp rejection of higher prices.  We opened near the bottom of Monday’s range and rejected and reversed lower.  After that it was off to the races until we saw a strong enough reaction.  Sellers were able to extend the initial balance range for an hour and a half after the initial balance suggesting liquidation was occurring on a longer timeframe.  However we did see buyers coming in.  The market is doing a really good job finding participants which leads me to suspect we come into balance on the short term.  This hypothesis is contingent upon holding the VAL from June 30th because below there we have the possibility to slide.  I have highlighted this support and other observations on the following market profile chart:

07092014_marketprofile_NQ

Comments »

Heat, Taking It

The action heated up in the Nasdaq today and the day was ripe with opportunity to trade.  This is the type of environment I will eventually thrive in as a trader.  For now, until I can consistently recognize my correct trading picture and only enter when my correct trading picture presents itself, I will simply struggle.

Today was so forgiving intraday, and so full of opportunity that I was still profitable.  That is until I took two poor trades and was slapped about in the closing trade.  This is embarrassing to post, especially on a day like this, but here are my trades:

07082014_performancereport

If I cannot manage my impulsive order entry, then I cannot advance to the next stage of trading.  If I cannot advance to the next stage of trading, then I may find myself turning tricks behind the local Kroger.  In short, priority #1 is very disciplined trade recognition and execution to achieve a 70% win rate.  The profitability is irrelevant in the first stage.  It is merely a foundation for adding size and trade management.

My stocks took a hammer and I was down over 2.5% on the day even though I came into the session with over 50% cash.  Even the slow stuff took a hit, but the brunt of it was felt in Twitter.  Momentum is once again the target of fast selling.  Alcoa beat and ripped after hours, the Nasdaq found a bid, the Chinese are up to bat with PPI overnight, and we have FOMC minutes tomorrow afternoon.  It is about to be very interesting up in here.

Q3 FTW

Comments »