Index futures are trading up a bit premarket, CPI data just came out in line with expectations and brought in a bit of selling, however we still have almost an hour before the market opens. Traders may have their eyes set on Wednesday, the day we are scheduled to hear from the primary market movers—the USA Federal Reserve. They will be releasing the minutes from their July meeting at 2pm on Tuesday. Before we open for trade Wednesday we will be receiving the Fed minutes from the Bank of England. With earnings season winding down, these type of economic events will be what prompts movement in the markets.
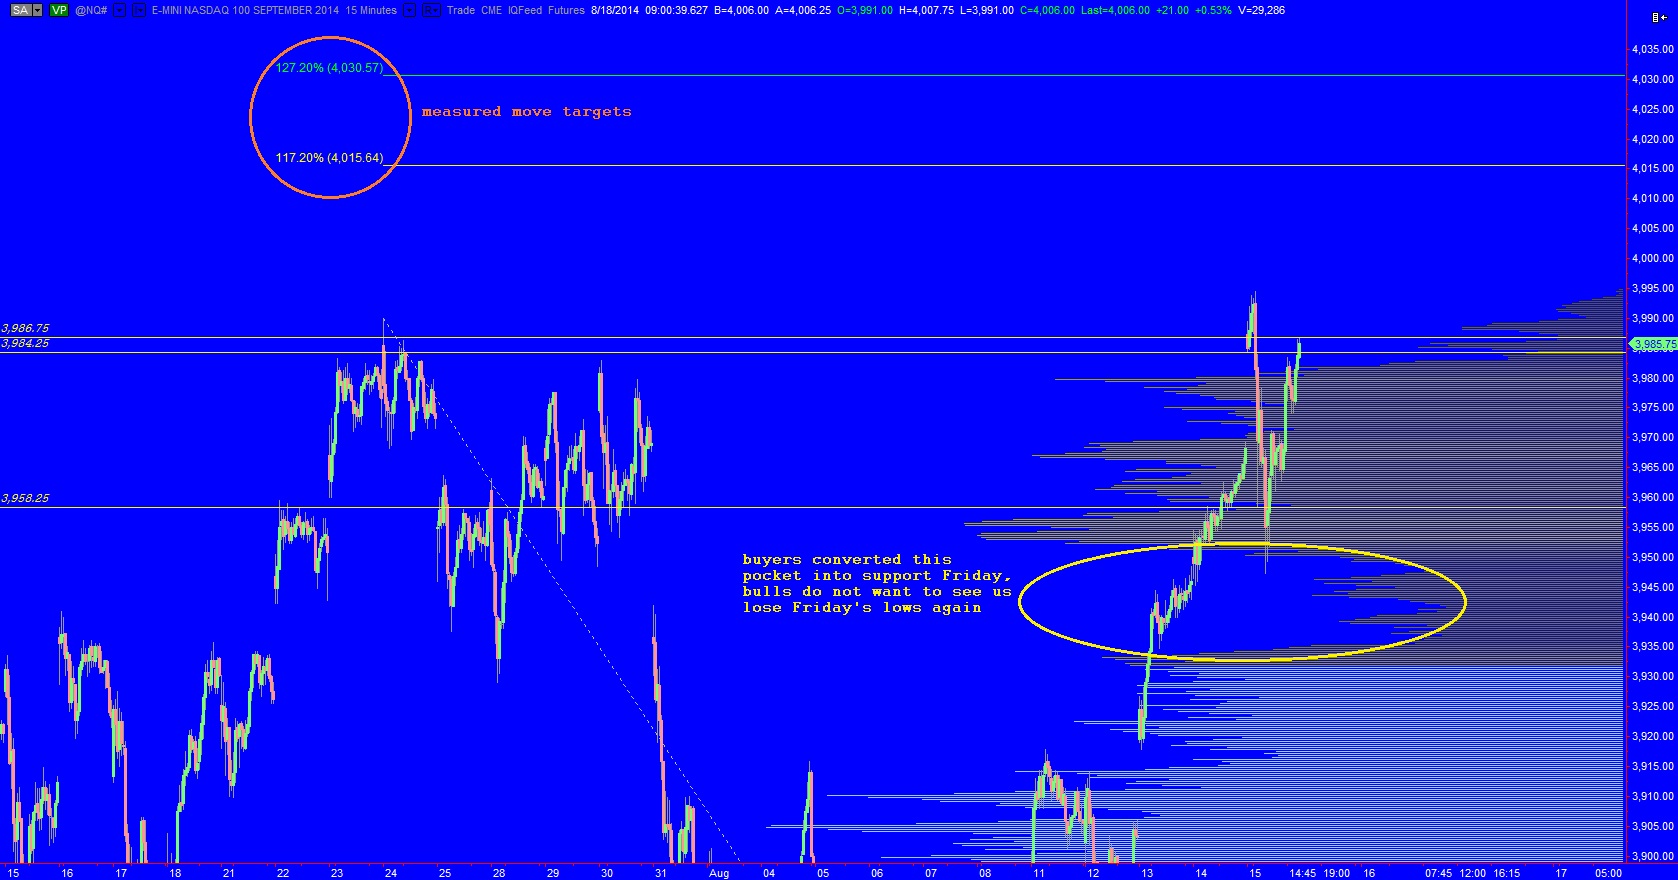
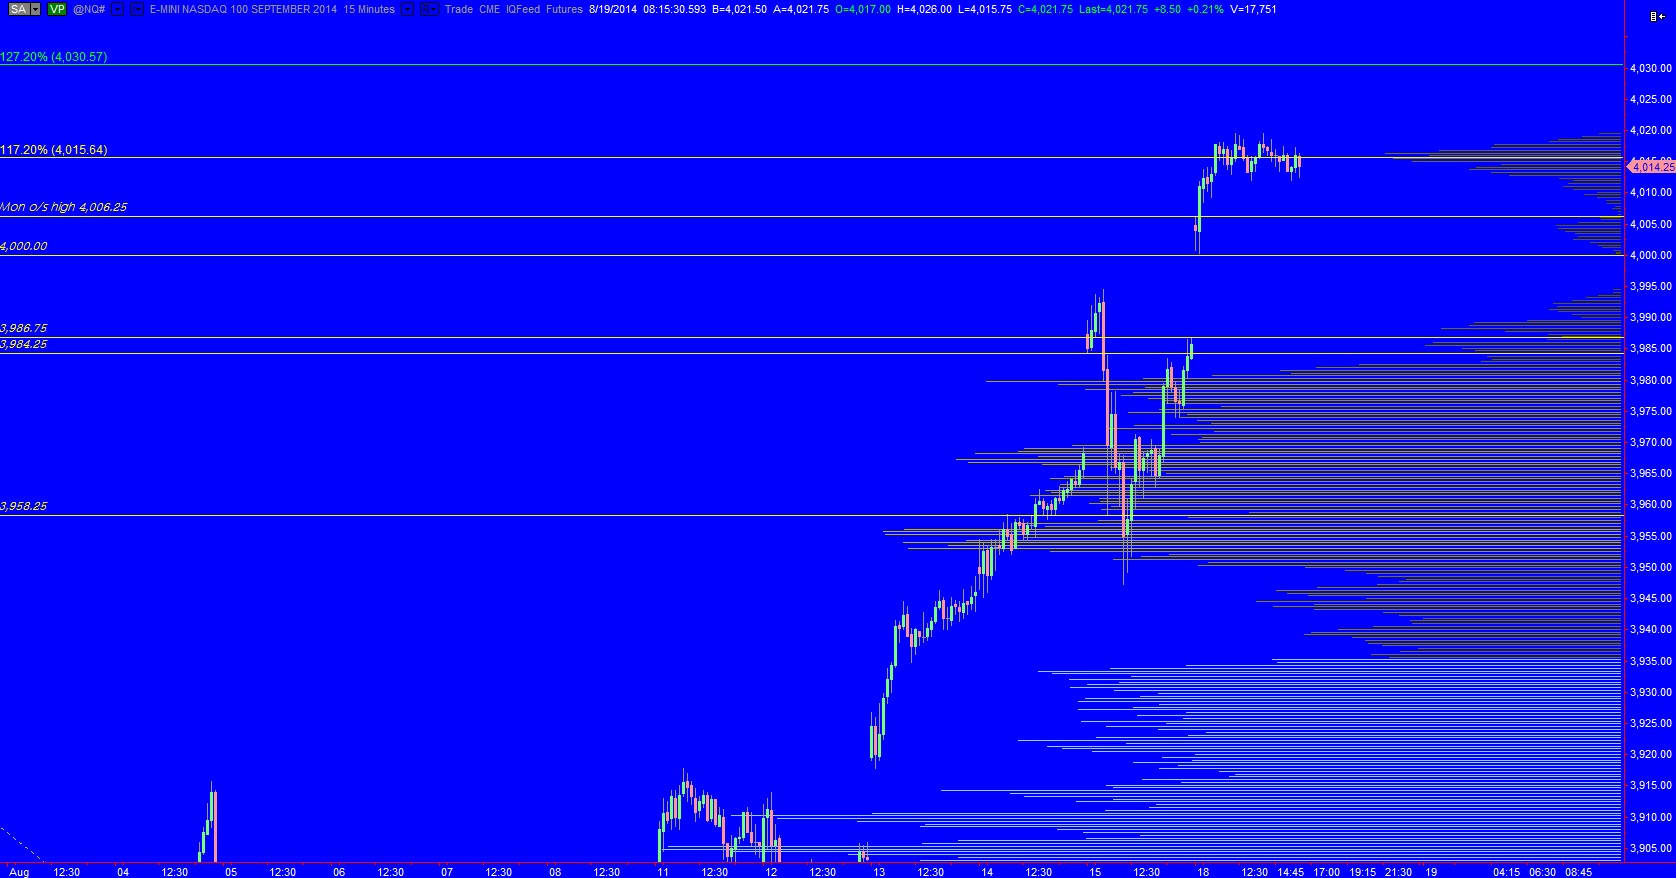
The intermediate term volume profile has taken the shape of peaks and valleys one might expect when price discovery is underway, and that certainly appears to be the case. The market is searching for sellers as the auction rolls upward. The pace began to slow yesterday afternoon, however we did not find a selling response significant enough to be begin the process of balancing this timeframe. Instead we are buyer controlled. Price stalled at my first measured move target, however these prices are by no means science, they are merely Fibonacci extensions of our prior swing dated from 07/24 -to- 08/07. It does tell me yesterday was a stop run because essentially this price level is where intermediate term short sellers might put their stop loss orders in. If we exceed the second Fib level at 4030.50, and see acceptance, this market can go much, much, higher. I have noted these levels and other intermediate term prices below:
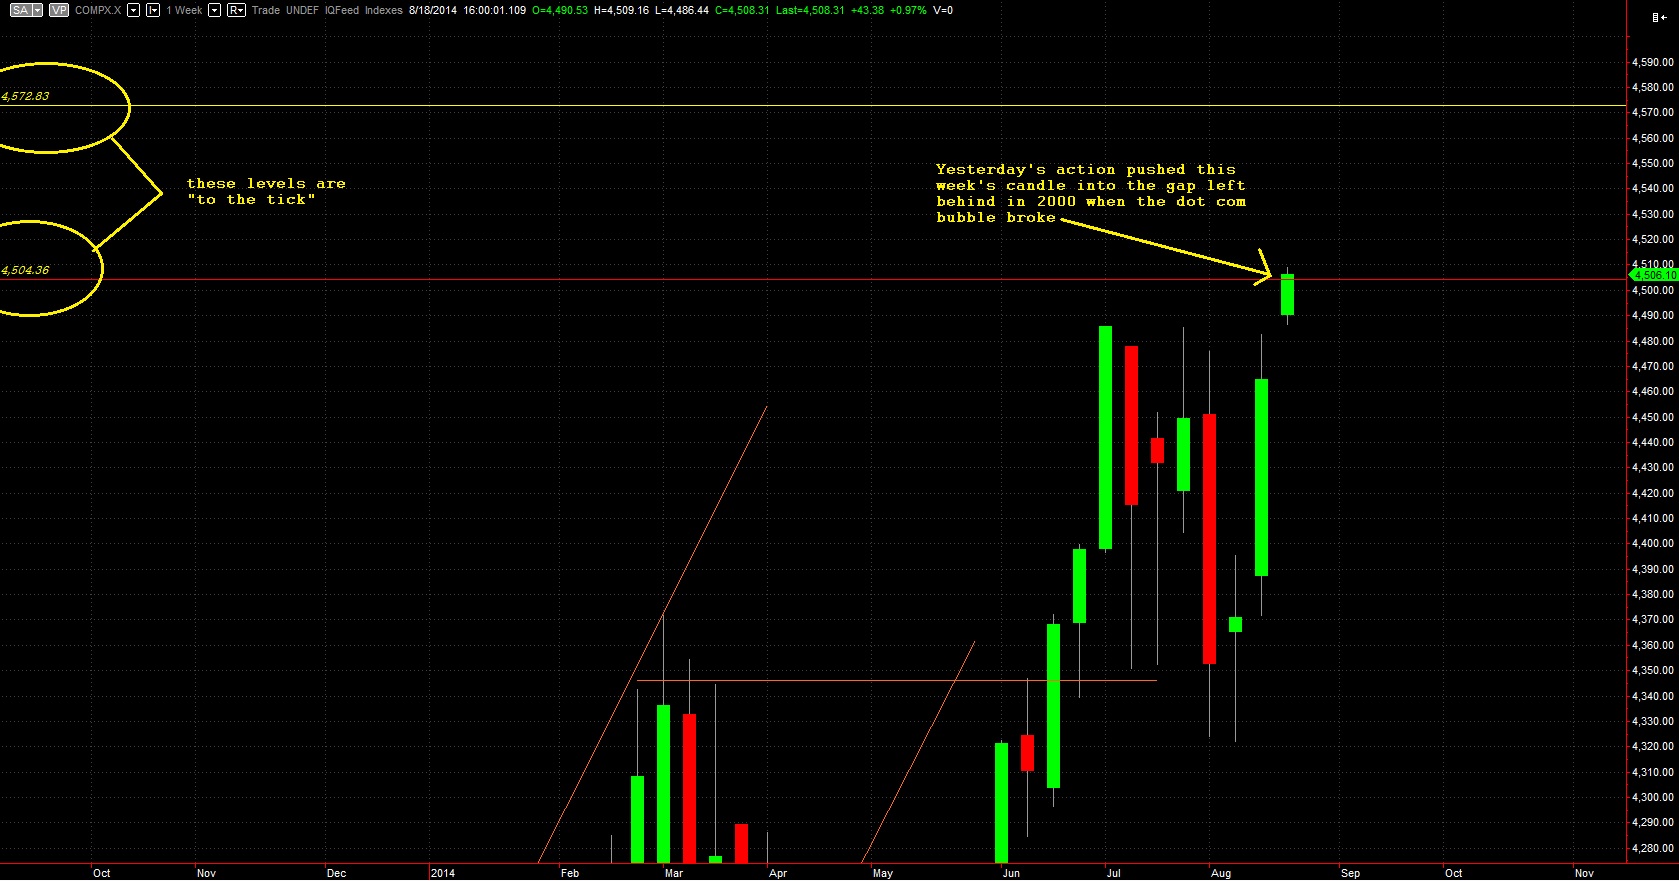
Supporting the idea of a heady rally is the very long term perspective seen on the weekly Nasdaq Composite where price breached the 14-year-old gap I have been discussing. The Nasdaq Composite is just an index, thus we do not have volume profile to observe, but the gap suggests similar behavior may occur. This gap has over a 60 point range to the upside, see below:
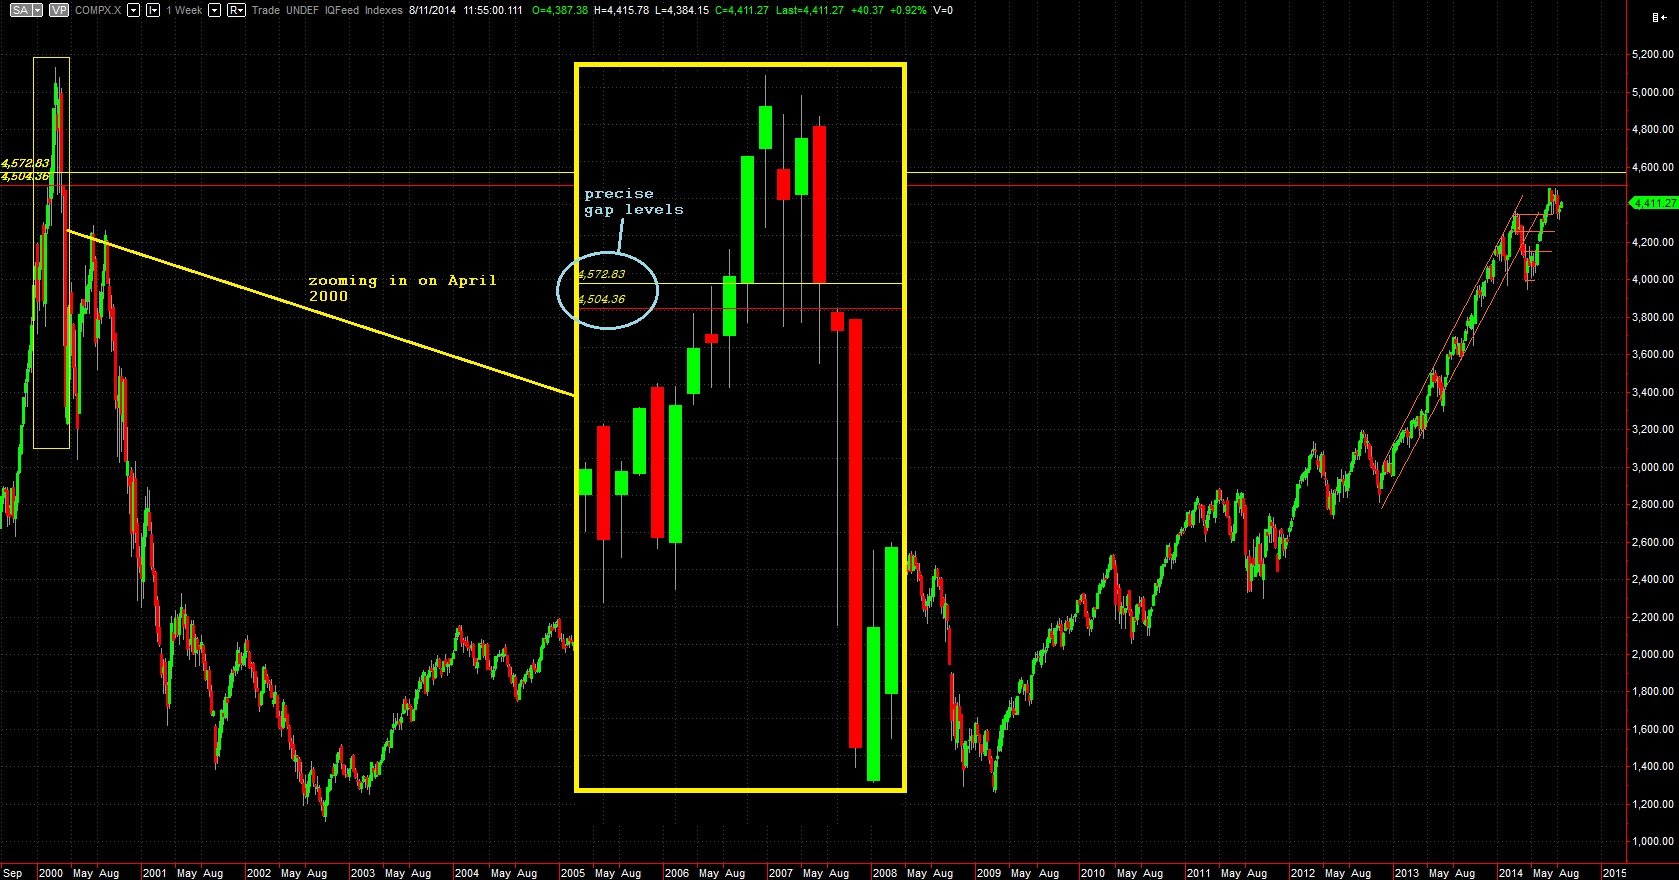
Here’s the snapshot I posted last week if you want to reference the gap:
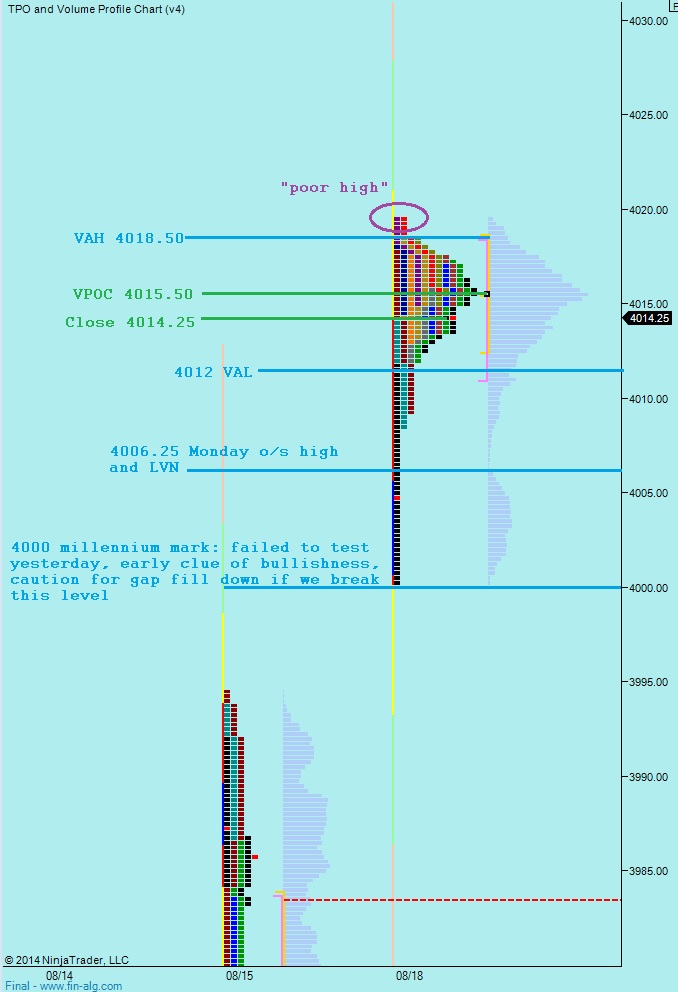
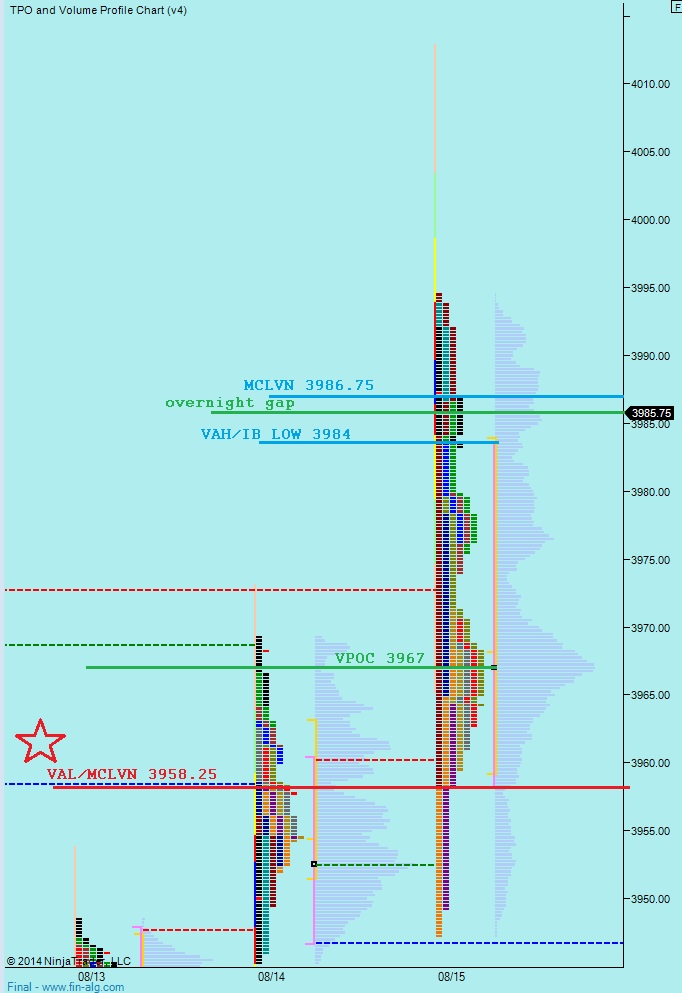
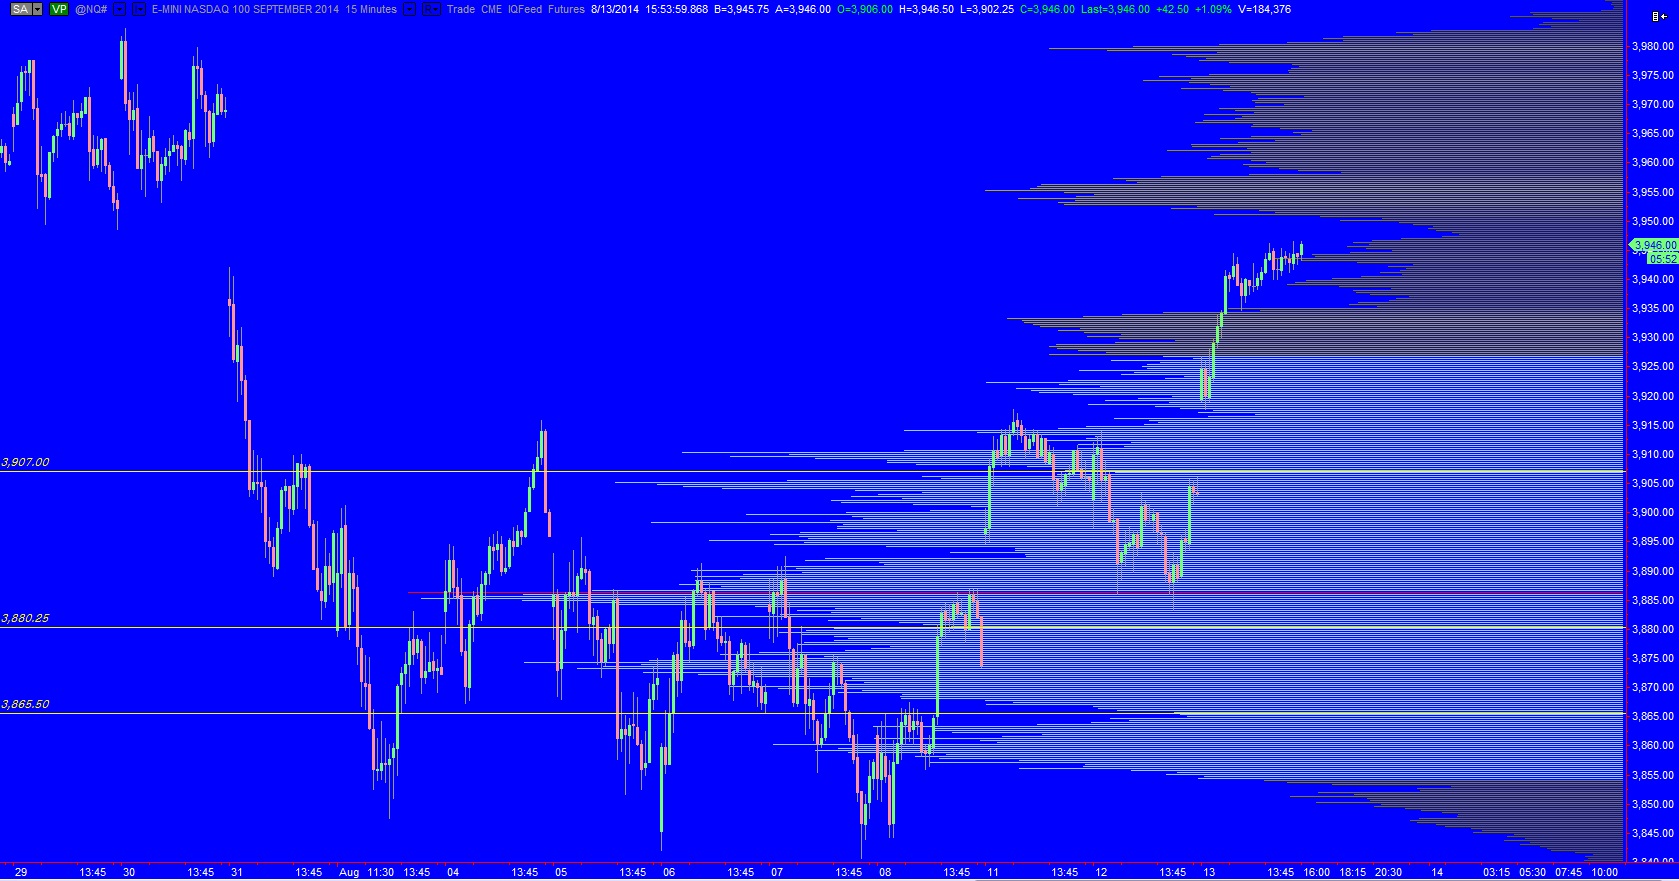
Yesterday we printed a P-shaped market profile which suggests a temporary phenomenon known as a “short squeeze” occurred. When this formation occurs after a two or three day snapback rally inside an intermediate term downtrend it can often mark the end of the rally, a final squeeze before returning to the bigger trend. However, in this case, where we are making new contract highs to start the week AND where we gapped higher, it does not carry the same implications. It does tell us a squeeze occurred early in the session. It does tell us fresh risk was initiated by buyers during the day, and it does tell us sellers did not enter the market in a meaningful way. I have highlighted the prices levels I will be monitoring, as well as a few other observations below: