iBankCoin
Home / Day Trade Probability

Day Trade Probability

Let’s Take A Look At How Futures Traded Monday, After The Pro Gap Up

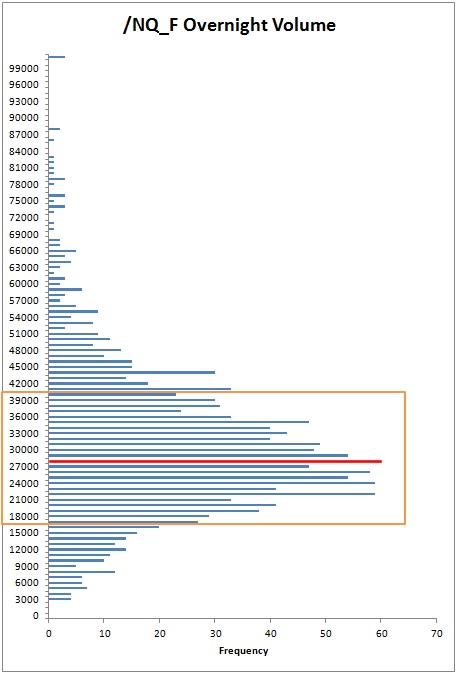
Pro gap is loosely defined, per my own statistics, as a gap greater than 40-60 points on the NASDAQ, roughly.  Greater than 60 points and we truly are dealing with something unique. Let’s discuss the forces behind a pro gap and the implications they carry into the trading day.

A gap usually occurs when information deemed material by investors and traders is discovered outside of open market hours (9:30am-4:15pm, New York Time).  When the market resumes trading, many participants (including institutional, the higher or ‘other’ time frame) are put in a position that may require them to adjust their exposure.

In Monday’s instance, the large move higher may have pressured short sellers to cover their positions, creating a natural demand force inside the market.  The move was deemed macro driven, tied to the first round of French Elections.

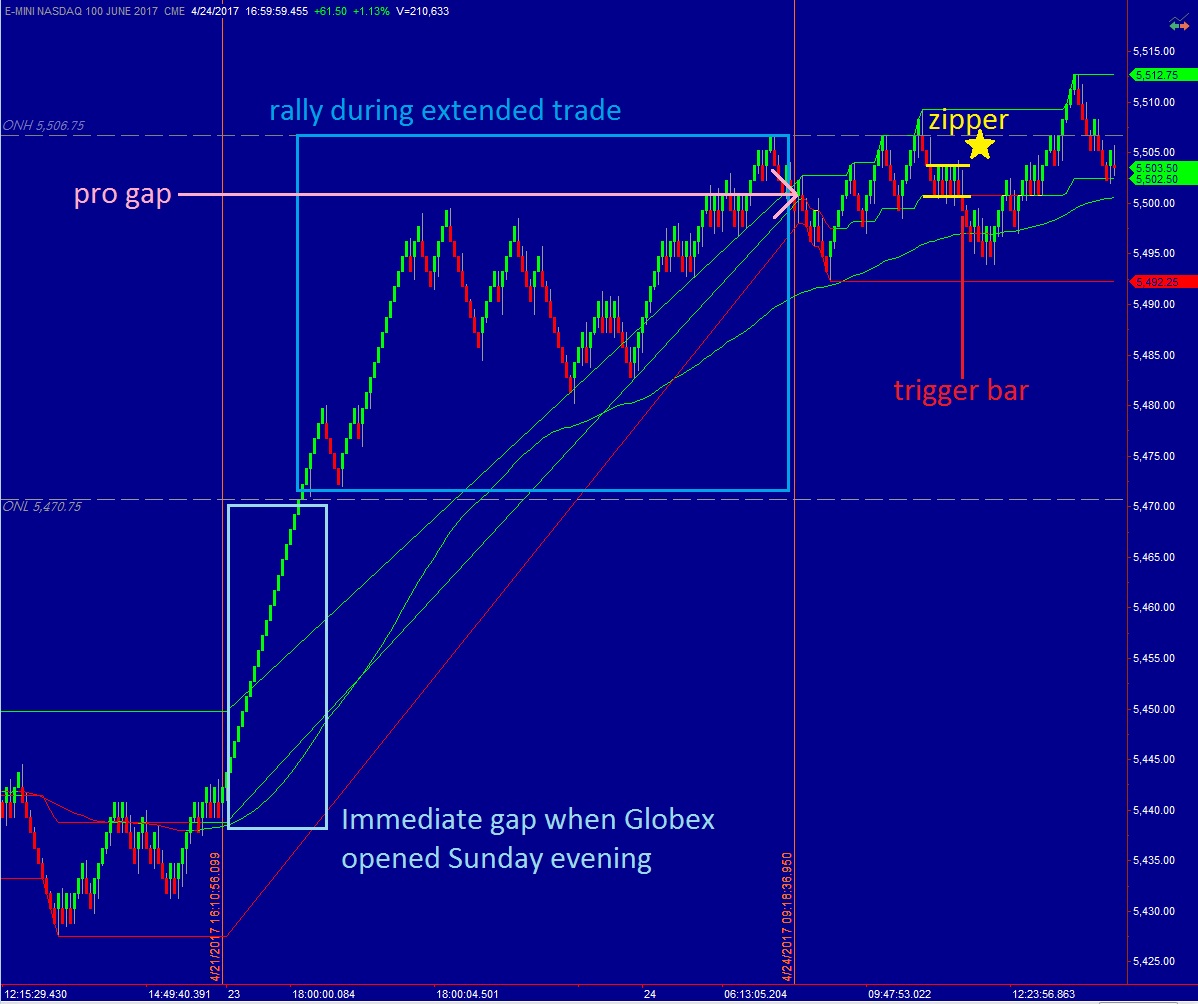
And buyers were the first ones to attempt a move after the opening swing, but by late morning, NQM17 (the front month futures contract) had fallen back around the opening prices.  This is when the day became interesting. The first trade of the week set up, a zipper, affectionately named by the image it resembles on my renko trigger chart. See below:

The trade was scratched at cost.  I managed to cover one unit at the exponential moving average then due to the day’s context scratch the remaining units instead of re-adding to the shorts and pressing for the range extension down.

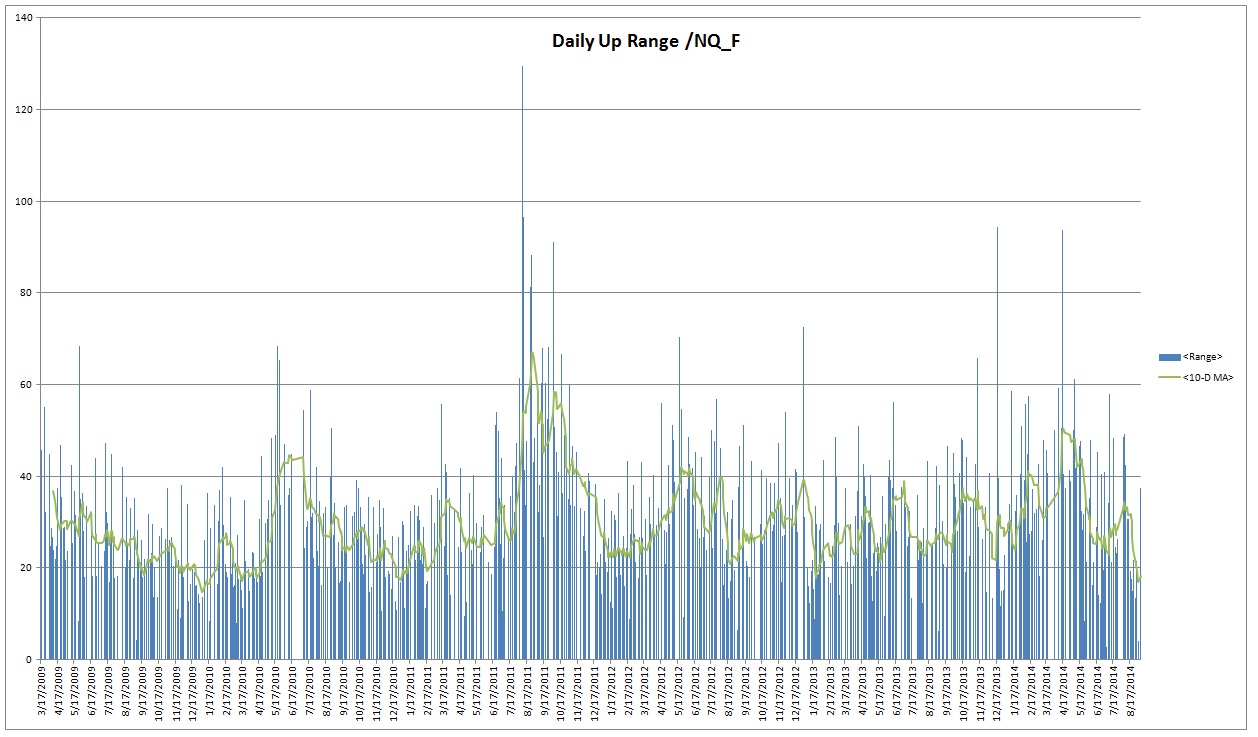
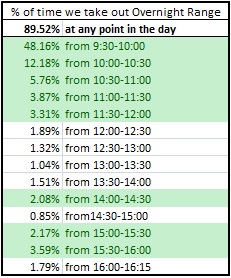
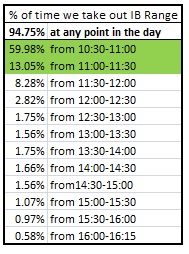
Range extension is a move beyond the first hour’s range.  Understanding range extension is only important because it unlocks a high probability edge for day trading.  You can run a study yourself (and you should for added conviction) where you calculate what percentage of the time the first hour’s range is exceeded.  It happens 94.3% of the time.

94.3% probability, does that sound like an edge to you?

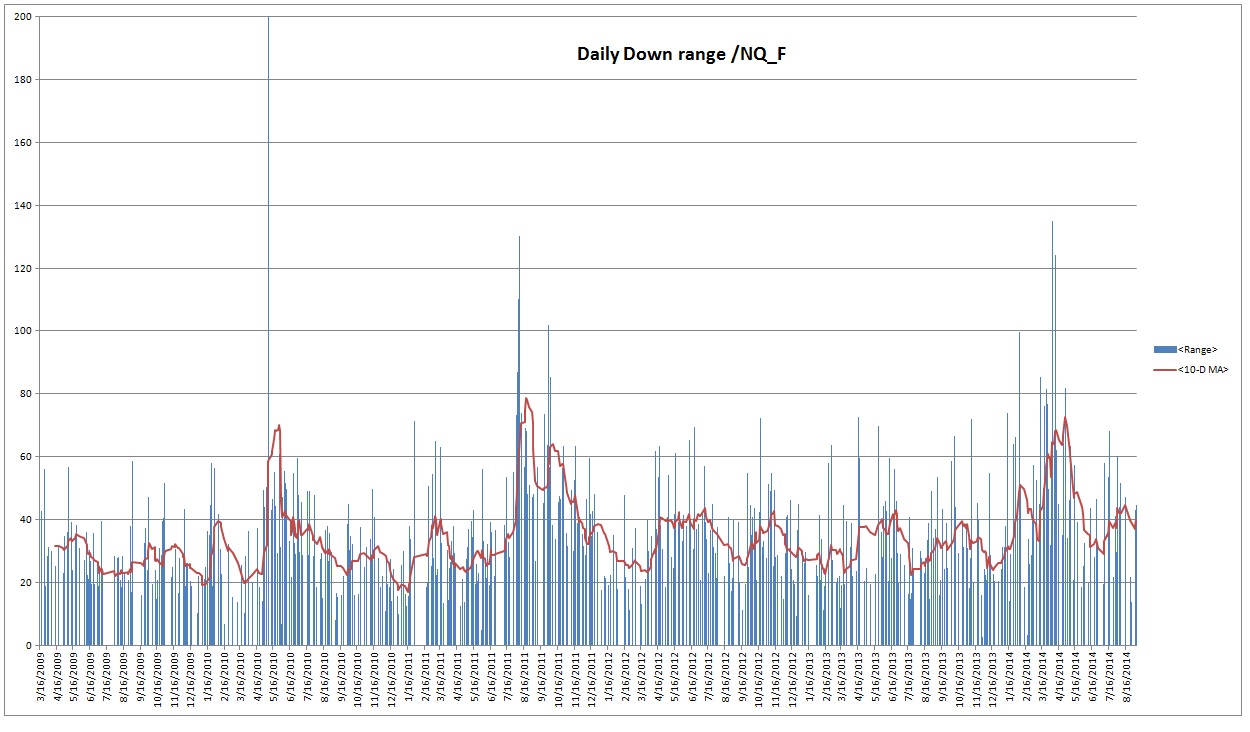
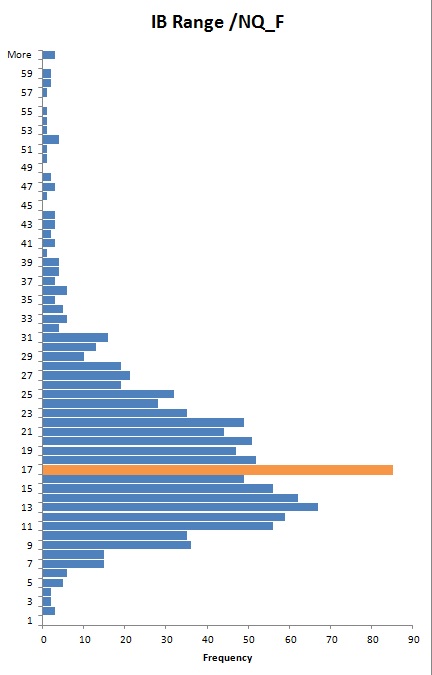
The trick of it is guessing which side of the range is going to break.  On a big gap day like today’s, the range extension could carry big order flow with it, and implications that could last days, even weeks into the future.  Historically, the high of the 1st hour’s range (aka initial balance) is taken out 66% of the time, while the low is breached 52% of the time.  The high breaks more often mainly due to the long term trajectory of the NASDAQ, which is up.

Below you will see Monday’s initial balance, which is clearly marked—observe:

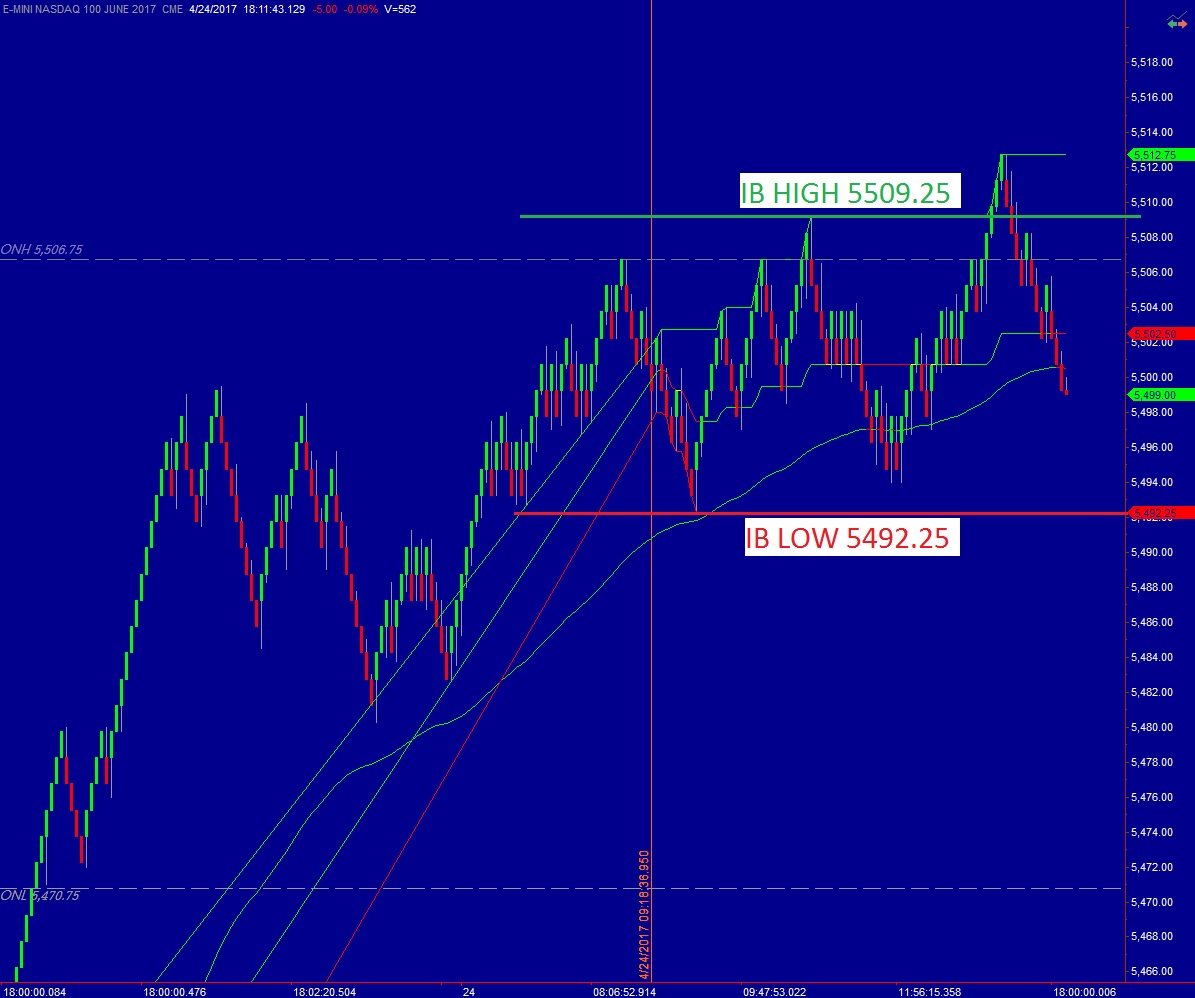
When sellers failed to take out IB low it became evident that the primary expectation from this morning’s trading report was still in play.  For added context, we had a clear pivot zone, the old zipper that triggered the late-morning short trade.

The final layer of context is a statistic that needs to be dug up (it is archived in the laboratory somewhere, SMH) which states that if a gap outside of the prior day’s range is not filled by 1pm, the market is likely to continue in the direction of the gap.

Mix all these little contextual quirks, expectations, trade set-ups, and high probability events and you have an excellent foundation for justifying taking longs—afternoon day trades.

Overall, the day had a wait-and-see feel to it, with buyers hardly initiating fresh risk beyond opening balance.  This suggests the institutions are waiting for more information before they become aggressive in either direction.

In short, it seems, for now, the market remains out of balance which means it is interesting.  Interesting, because of the potential opportunity it holds.


Comments »

Nasdaq 100 TICK Stats

Ahoy mates, I saved you the rigmarole of running standard deviation studies on the NASDAQ 100 TICK. Using high quality IQ Feed data, I ran a study on 1-minute bars to determine 1st-3rd standard deviation for the indicator.

I set audio alerts for the 2nd and 3rd thresholds using Multicharts. We’ll see if those last or end up in the junkyard with the other algo scraps.

Here’s how the data looks on my side:

Positive TICK 1st, 2nd, 3rd sigma: 36, 54, 70

Negative TICK 1st, 2nd, 3rd sigma: -37, -52, -68

NQTICK_02222015

Why does any of this matter? Have you ever looked at something and thought, “hmm, that’s different”? Would you want to know if something you’re seeing is in fact abnormal? I do. When I am in a trade I accept that my limbic system will be active and a big part of my job is being aware of the waves of emotion that sometimes get in the way of trading. One of my boulders to channeling that creative energy into objective trading is basing my observations and decisions on cold-dead numbers, logic.

Are they Holy Grail trading signals? No, but they do offer a peek inside the engine of our good friend /NQ_F.

Comments »

Sunday Morning Stat Mash

Today we are looking at the range statistics of the Nasdaq regular trading session.  Although Nasdaq futures trade around the clock on globex, our focus is primarily to trade the index when the equities underlying its value are also active.  Thus, this range analysis is conducted using the trading hours from 9:30-16:15 eastern time.  This data was pulled from the IQ feed servers and compiled using about five years of trade (3/16/2009 start date).

The data has been split into two categories, up days and down days.  This information is helpful when preparing your hypothesis on the day because you have a sense of what price levels are relevant and actionable, and which ones are beyond the average reach of the marketplace.

Some notable stats include:

  • Average down day range: 35 points
  • Average up day range: 29 points
  • 2014 Average down day range: 45.5 points
  • 2014 Average up day range: 32.5 points

Usually I will use a histogram to calculate a “normal” range, considering about 68% of occurrences as normal and anything else an outlier.  What appears to more relevant in this instance is to look at the data over time to see how ranges are trending.  I applied a 10-day moving average to the daily up and down ranges.  The average daily up range is at about a 5-year low at just under 20 points.  The average daily down range is just less than 40 points.  Thus recent trading has provided about double the daily range when trading lower than higher.  See below:

09062014_UP_rangestats 09062014_DOWN_rangestats

Comments »

Labor Day Morning Stat Session

During the week long market profile webinar we talked about ‘the story’ and how when we choose to focus on the market activity in the context of an auction we react in planned ways.  As the market moves we can constantly return to reading context by asking ourselves a few questions:

  • What has the market done?
  • What is it trying to do?
  • How good of a job is it doing?

These questions help us answer the final question which determines how we react, if at all—what is the market likely to do from here?

You truly need to see this in action, like seeing a big rotation and running through the questions real time, to see the effect it has on your mental vision.  You return to these questions, you use market profile as a tool for seeing the auction, and the process provides a logical decision making process.

Probabilities can be just as logical a basis for decision making.  They are statistics derived from past market behavior and it is reasonable to include them as part of a decision process.  For example, if the overnight low breaks 89.52 % of the time and you have entered a short position which is working in your favor and is within a few points of the overnight low, then pressing for at least a 1-tick break of the overnight low makes sense, especially if the session has matured a bit, increasing the probability of a break.  These little inches we fight for add up to miles when it comes time to calculate expectancy.

Relying on these foundations (logos, as the Greeks called it) for trading will yield better results and a more objective eye.  Imagine your statistic does not fulfill because that is the simple nature of the markets.  This resistance to the laws of large numbers will speak to the context too.

Enough emphasis on why statistics matter, yes?  Without further adieu, I have performed a study on five years of trade in the Nasdaq futures.  The raw data has been pulled from the IQ Feed servers via their symbol @NQ# which is the continuous contract.  Some key points:

  • Overnight high/low break occurred 89.52% of the time, with 73.28% of breaks occurring before noon
  • The normal volume on an overnight session is between 17-39k contracts
  • The normal range of an overnight session is between 16-46 points

09012014_ON_breakSTATS

09012014_ON_range_histogram

09012014_ON_volume_histogram

Comments »

Sunday Morning Stat Crunch

During the week long Market Profile webinar I hosted for the After Hours with Option Addict crew, I defined and discussed initial balance (IB) quite extensively.  This simple concept of noting the price range printed during the first hour of trade can be a huge help in determining market conditions early in the day.  The same can be said for the opening swing, only the opening swing interprets market activity even sooner, sometimes being established in less than 5 minutes.

One of the primary reasons for tracking the initial balance is its use in determining what sort of “day type” is occurring.  Another primary reason, the reason which is more actionable intraday, is that we rarely see a full day of trade without breaking either IB price extreme.  Therefore, if we manage to enter a trade inside of initial balance which is working in our favor, we can press that day trade and ride that winner a bit further.  Traders always emphasize the importance of letting your winners run because those few extra ticks you gain from a well managed trade can make a huge difference to your overall expectancy.

Nothing builds confidence in an idea like statistics and probabilities.  Therefore as an addendum to the weekly course, I have built out the relevant IB statistics for my product, the Nasdaq E-mini future contract.  I used five years of pure IQ Feed data to compile the following stats.  Some highlights:

  • We break initial balance 94.75% of the time
    • By 11:30 – 73.03% of the time
    • By 12:00 – 81.13% of the time
  • Normal IB range (69.87% frequency) is 11 – 24 points
  • Normal IB volume (66% frequency) is 40k – 75k contracts

And without further adieu, I present the data (looks familiar, yes?) in its entirety below.  Enjoy:

08242014_IB_breakSTATS

08242014_IB_range_histogram


08242014_IB_volume_histogram

Comments »