I wanted to provide you guys with a zoomed in picture of our current situation on the NASDAQ because I think you can learn something today.
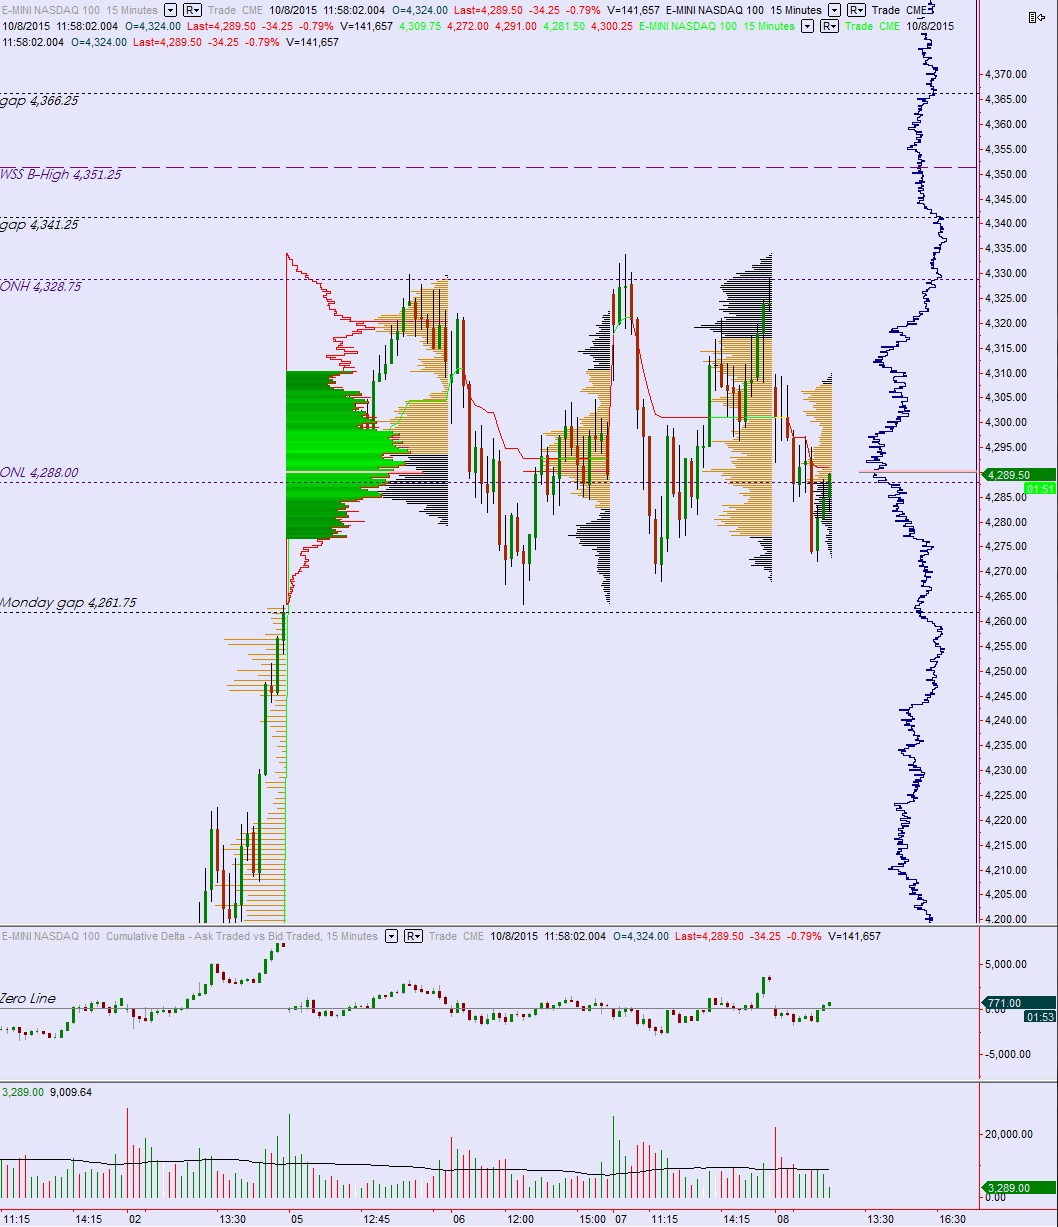
When we have several days of overlapping prices it suggests the market is accepting prices. And of course it likes these prices—this is also the major composite high volume node (CHVN). This is the skin colored bar on the volume profile on the far-right edge of my chart.
Take a look at the below chart. If you think that balance is going to crack ahead of the Fed Minuets you’re bananas. Play ping pong until proven wrong.
Also, bear in mind, even if we move lower short term, this type of acceptance sets the stage for a return to these prices. It’s like a big weak high. But, short term, when we go exploring away from this region it can result in a decent sized directional move as half the participants are proven wrong.
Such is the logic of balance-discovery-balance, of nature.
Marcus Aurelius said it best:
“Nature’s job: to shift things elsewhere, to transform them, to pick them up and move them here or there. Constant alteration. But not to worry: there’s nothing new here. Everything is familiar. Even the proportions are unchanged.”
…you would think this guy was looking at a volume profile chart when he wrote that. Real trippy, I know.


Hi Raul, really appreciate all the analysis and hard work you do. Quick questioning pertaining to your last post.
You mentioned that you see biotechs shorted by the retail crowd. How do you know/identify when it’s the retail crowd, and not the big boys? By no means am I questioning; I’m asking for learning purposes. Thanks for the knowledge.
Stocktwits sentiment meters and a general ear (eyes) on twitter, stocktwits, etc
Thanks Raul
what do you mean by “balance”?
accepted value by sellers and buyers, agreement on price, if only for a while, balance and discovery–this is all you need
OK. But how do you go about determining where this happens and over what period of time?