First off, I loved posting this savage entry earlier today–it was a wholesome gathering of words, imagery, and music for the Sunday audience. But I figured do a dry follow up to support the colorful case made. Below I list the supporting data, enjoy.
MODEL AND CONTEXTUAL CASE:
- The consistently wrong S&P model—fading my S&P model has been a winning trade 76.1% of the time (46 samples). The model is long S&P going into the week.
- Exodus Hybrid Oversold: Tuesday market close will mark day 10 of the cycle.
- Two out of the last three weeks saw the Utilities sector lead the way.
- Rose Colored Sunglasses—this short signal is 10-for-13 and signaled today. Here is every past instance, on the NASDAQ, with boxes drawn from Friday-to-Friday on the 5-day signal:

WHY BIOTECH?
- Last week, despite IBB (primary biotech ETF) being up 1.71%, there were 67 biotech stocks down -10% or more. There were nearly 150 biotech stocks down -10% or more the previous week.
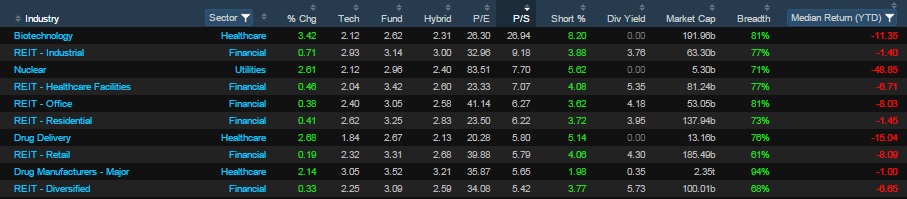
- The biotech industry has the highest price-to-sales ratio:
SOURCE: Exodus Market Intelligence
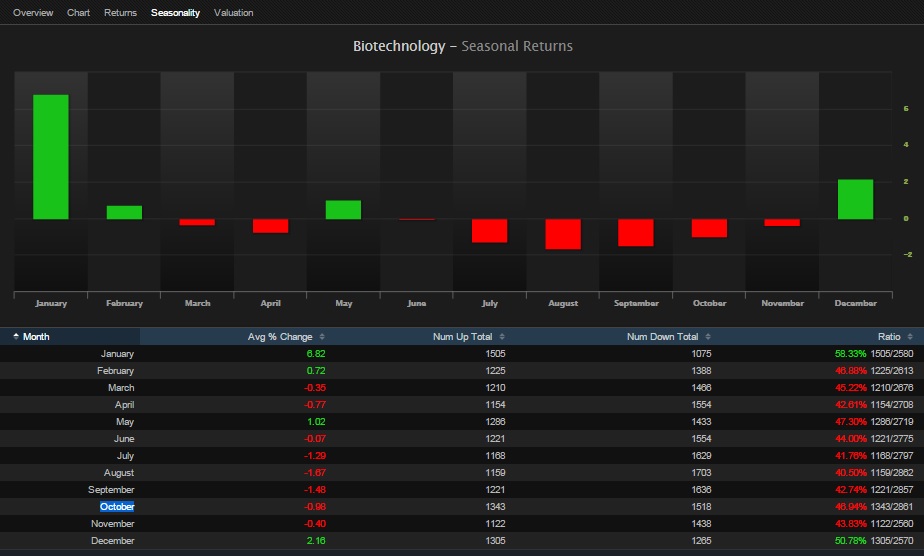
- We are in a seasonal safe haven for shorting biotech:
SOURCE: Exodus Market Intelligence
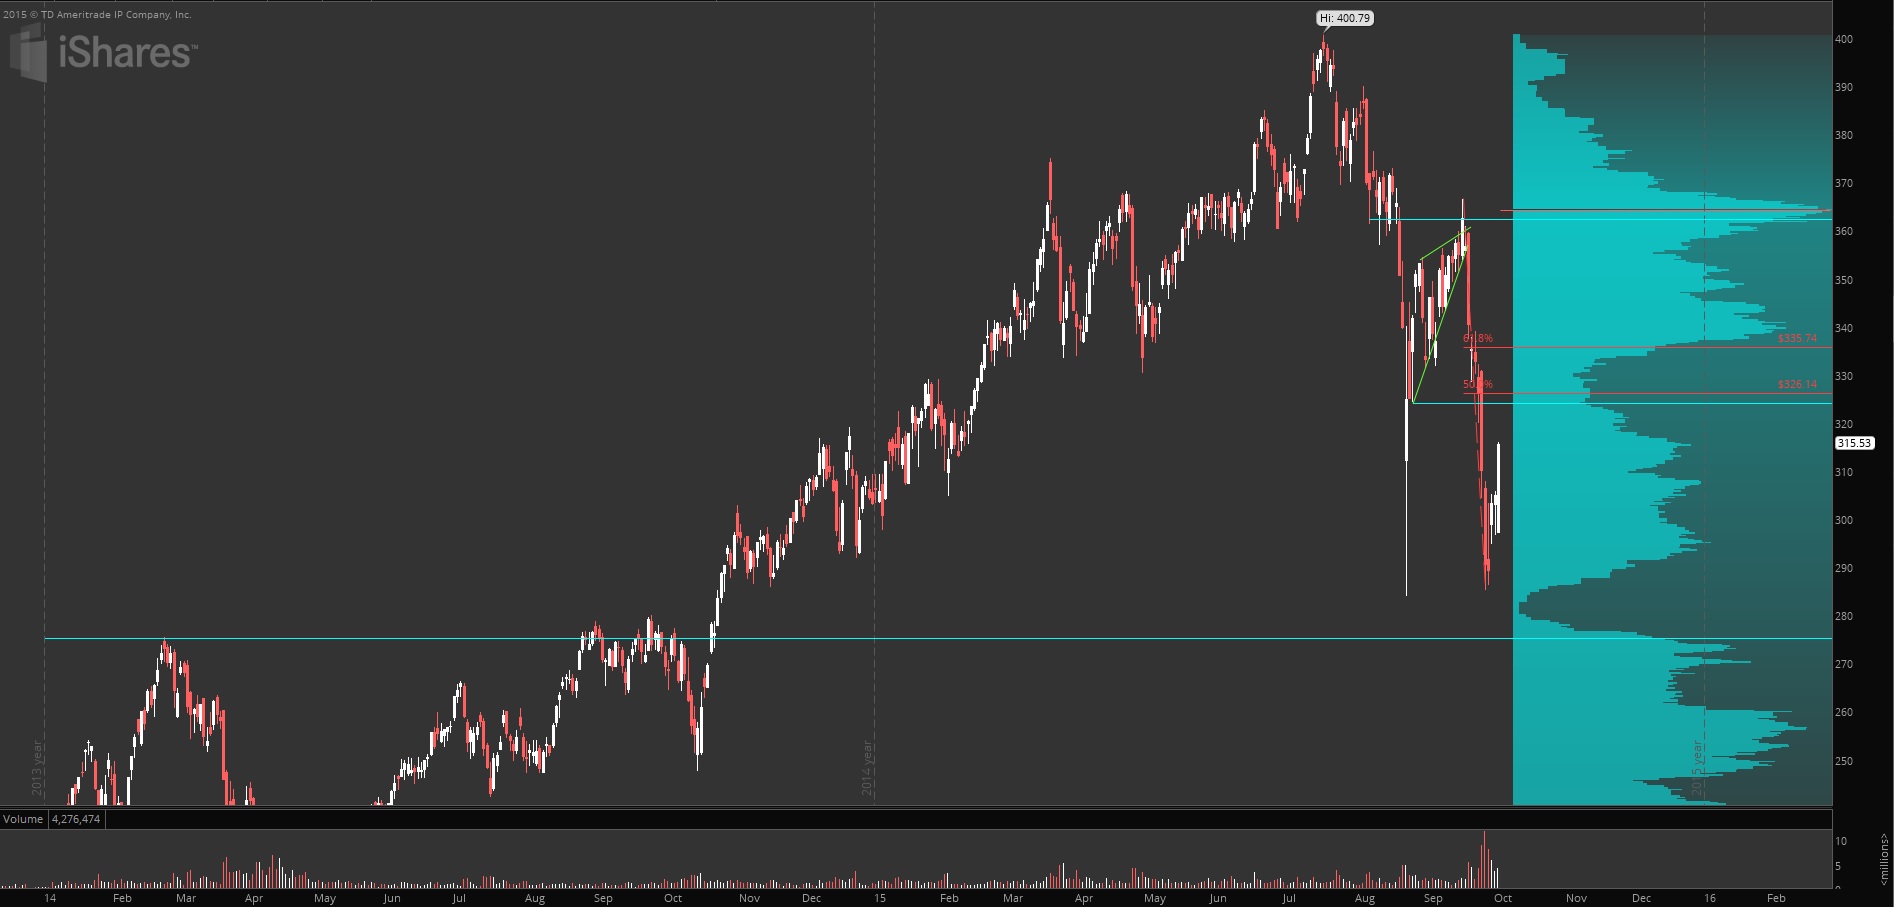
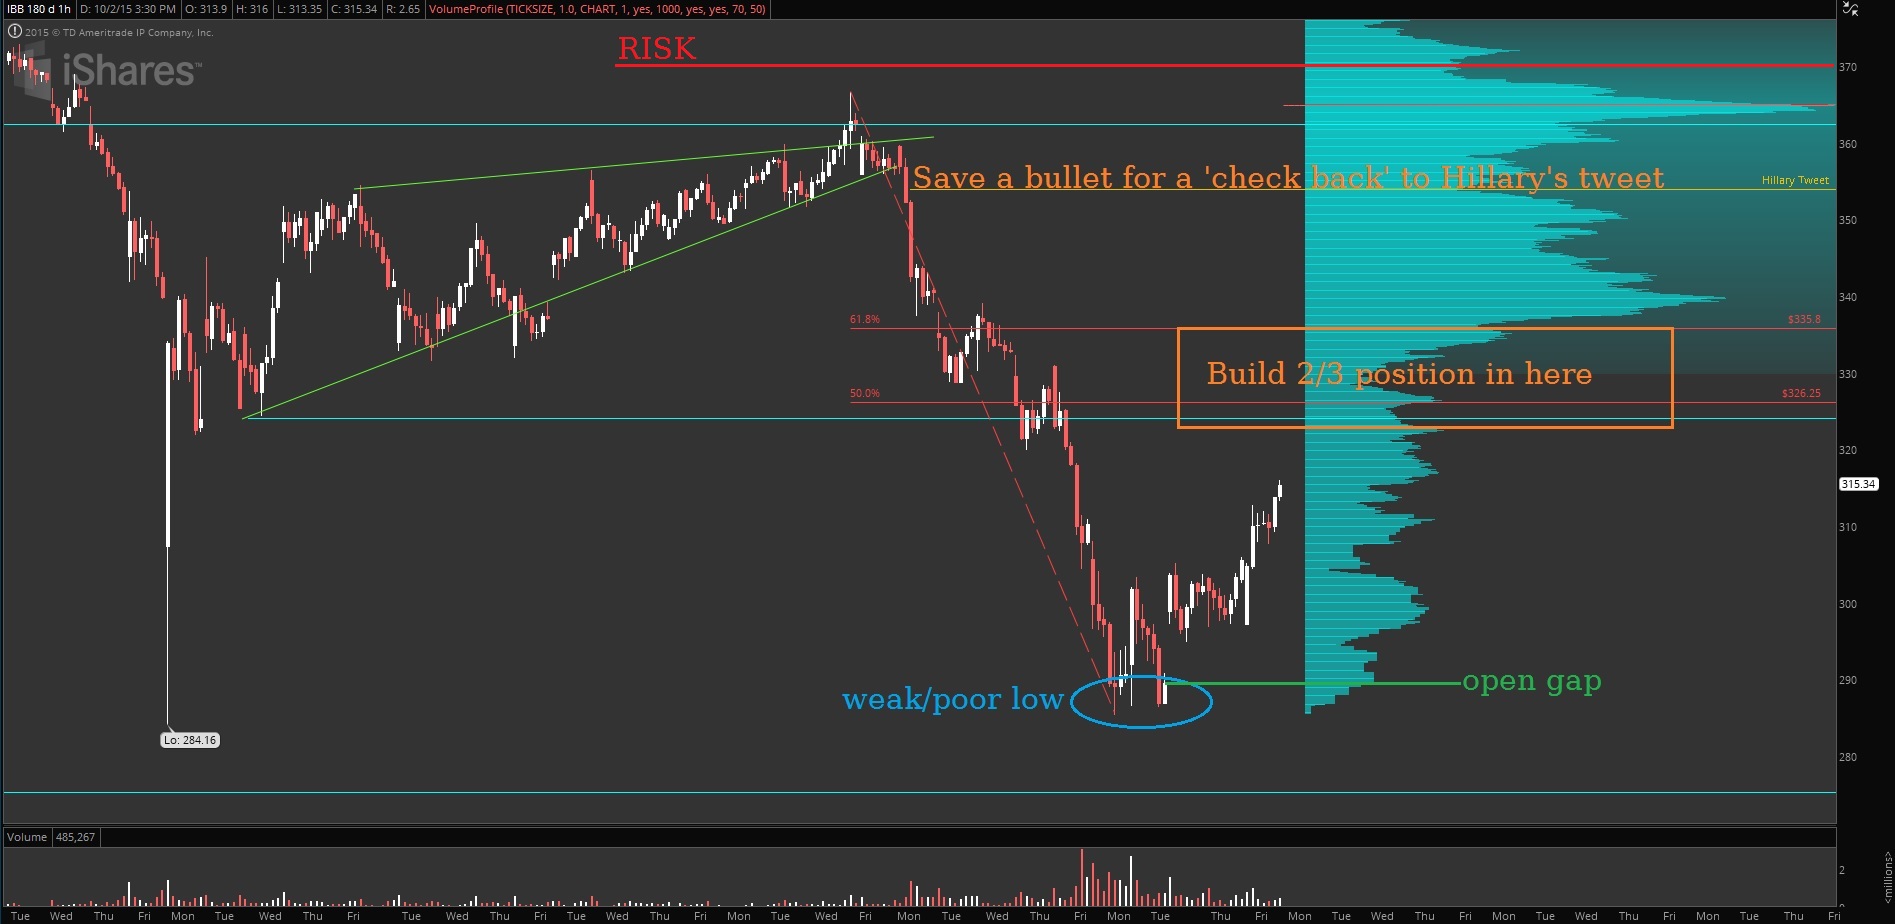
THE SETUP AND PLAN
- Two IBB charts, for risk management purposes. First the daily, then the hourly:
THE VEHICLE
BIS
If you enjoy the content at iBankCoin, please follow us on Twitter


He’s a never-ending pasta bowl of Exodus magic.
“You’re gonna love my nuts.”
so, a general market reversal with biotech as the fall guy?
si
Not sure if you noticed, but on Wednesday there was a crazy shift that day. I had twenty stocks down 4% or more, and had 130 up 4% or more….just on that day itself. That was the day after the first positive divergence that occurred on Tuesday.
Interesting, I did not. I’m overdue to overhaul some of my stats–I plan to incorporate a bunch of breadth data when I do. So far I’m just using it from an observational perspective.
GREAT ALL MY MAN!!!
FUCK!!! I mean CALL