Markets move in harmonics and fractals which produce events that are not necessarily repeated but without question have a certain rhyme. Back in September there was a singular event you could point out on the Nasdaq chart which precluded the multi week trade lower. Some call it a false move, others a stop run, but in auction theory we call it a failed auction.
The structure can be seen as taking out a prior high or low briefly, testing the waters beyond the reference point, before sharply reversing in the other direction. It will not always produce the same outcome, however I now have a rule in place that insists I back off until this structure resolves itself.
We happen to have a failed auction print in place on the Nasdaq futures as we come into this week’s trade. The swing high set during Monday’s trade was briefly breached on Wednesday only to quickly reverse lower. Both times the new swing high was achieved via a gap higher to new highs which was subsequently faded lower. The current structure is a bit different from the September event. Here are the bullet point differences:
- September’s event was separated by eight sessions of trade and nearly a week and a half of time and volume buildup. Last week’s was separated by two sessions within the same week.
- The Alibaba IPO was generating buzz the day the September failed auction took place
Returning our attention to the market, we start with a high timeframe and drill down closer and closer depending on our style of trade. If you swing trade exclusively you likely only need to drill to the daily chart and perhaps a 15-minute chart for trigger points.
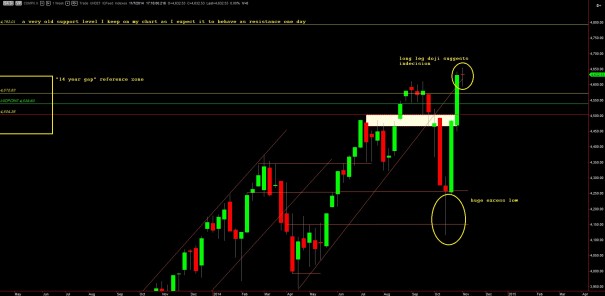
The weekly time frame shows wide indecision last week in a long term bullish market. We are trading above the “14 year gap” left behind during the year 2000 dot com correction. The following chart is of the actual Nasdaq composite:
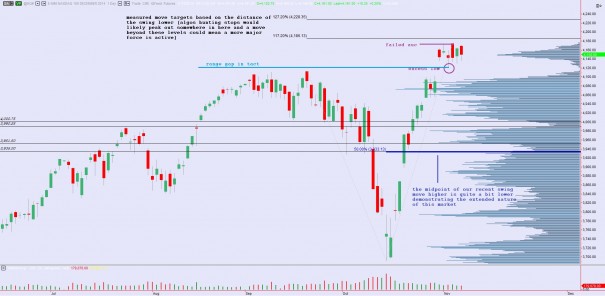
On a daily chart of the front month Nasdaq futures contract (December ’14) we can see prices are trading on an island atop the strong V-shape recovery we recently printed. An excess low printed and is shown as the long tail on Tuesday’s candle. The trend over the last 2-3 days is flat while the trend of the last 2-3 weeks is up. The gap up is still intact suggesting demand for equities remained present during all of last week’s trade. I have noted a few other observations on the following daily bar chart:
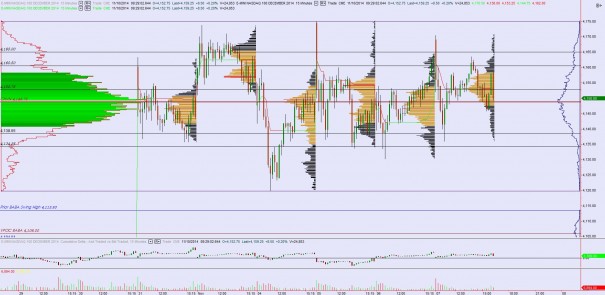
The first addition I make when drilling down to the 15-minute volume profile “mash up” chart is drawing a volume profile which encompasses the six sessions of overlapping trade. This will yield highly potent price levels where we are likely to see market behavior occur. It also shows the auction health and structure on this time frame. I have noted these price levels below:





primary expectancy in this environment is choppy, two-way trade until we resolve to explore away from the multi-day balance.
My book is long but with elevated cash levels and I hesitantly give sellers a slight edge into the week.
Overall I am more neutral then bearish into the week, even though a neutral stance won’t make me famous.
It was very nice meeting you, Raul.
you too good sir
Great meeting you both! great discussions! Once again thanks for going over the printed charts I had from your blog posts! Awesome!
Indeud, to all three of you. Fantastic event.
really glad you guys made it out