Nasdaq futures were very illiquid last night and with only slightly above average volume we managed to print over 40 points of range. It started yesterday evening when a wave of sell flow pushed the market lower. The timing of the selling loosely correlated with US President Obama approving the use of strategic air strike in Iraq. There were also so big moves occurring across the Forex complex including the Aussie dollar. Around 4:30am prices reversed course and quickly auctioned higher and the push managed to take prices up above yesterday’s midpoint. As we approach US trade we are set to gap a bit higher however prices are on the move, and where we are in a half hour could materially change.
One of the questions we constantly ask ourselves as speculators is, “who is participating in this tape?” There are day-timeframe and other short term participants or “locals”, intermediate term investors, and long term players, and believe it or not, longer term participants. Think of locals like car dealers—they only hold inventory for a very short time with the intention of facilitating trade between the long term seller (the auto manufacturer) and the long term buyer (the consumer). Locals do not have strong drive or commitment to prices, and do not drive directional moves. Intermediate term participants may extend prices a bit with their position entry because they have a longer term horizon and do not observe short term price levels. The long term participant will drive through many price levels, moved to act perhaps by a geopolitical event or macroeconomic theory. When they act, our job as smaller players is to stay out of their way or join their order flow.
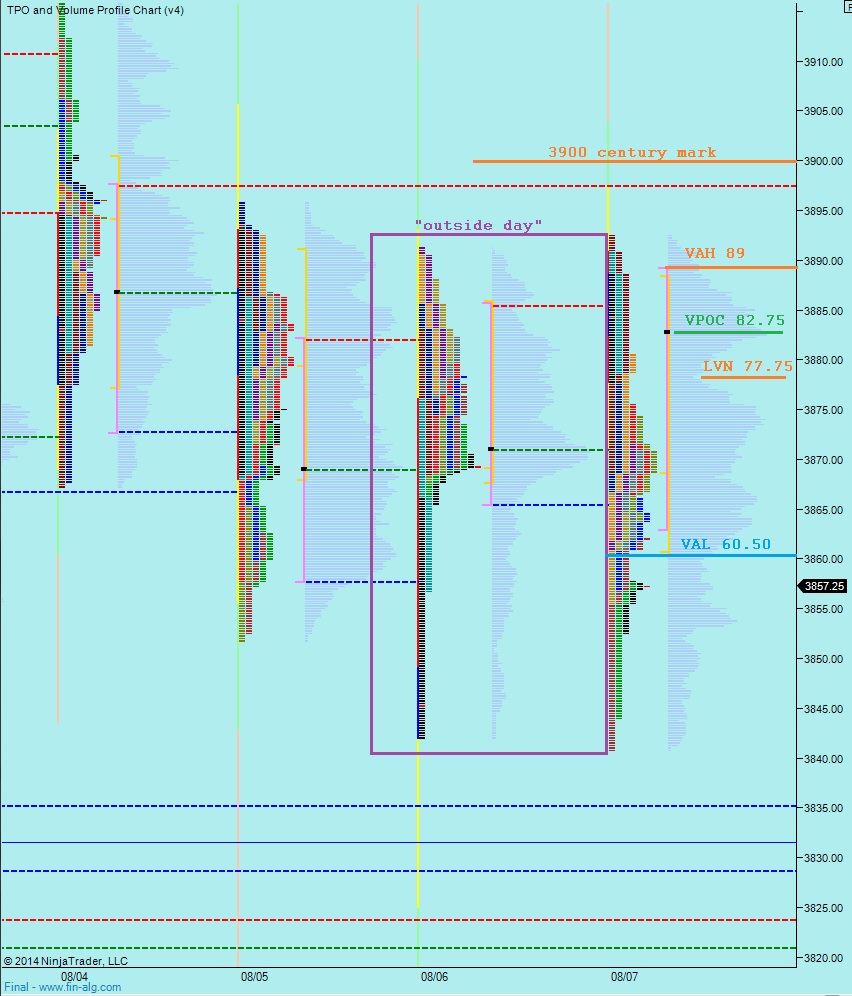
This is the essence of timeframe analysis. The challenge is keeping it all straight in the heat of the trading day which is why I create these morning reports. However there is always a possibility of a better looking glass or tool for observing the action. I have been building this new volume profile chart for a few weeks, have a look. You will notice three sets of volume profiles. The black outline is the long term composite, the red and blue on the far right is the past six days of trade (the stalemate between a big buyer and a big seller), and finally each daily volume profile. I have noted the key prices which likely determine the victor of this intermediate term battle, as well as other interesting short term levels:

I have noted short term observations and levels on the following market profile chart:
If you enjoy the content at iBankCoin, please follow us on Twitter


Primary hypo – sellers push early to test VAL at 3860.50 and likely close overnight gap to 3857.25 where we find responsive buyers who take out overnight high @ 3871 and target VPCO at 3882.50. If we accept these prices then a test of yesterday’s high at 3892.50 and possibly 3900
Hypo 2 – strong selling rejection out of yesterday’s value, VAL 3860.50, push down through y-close 3857.25 and into the buying tail below. Sustain trade below 3852 and set up a fresh flush down to 3830 where we find responsive buying back up into 3852.75
that chart is boss and you know it
3890, good call