The key to executing proper decision making during market hours is through observance of the overall context each morning. Some get their context from the newspaper and colleagues. I apply auction theory to the NASDAQ and check out what has my favorite traders’ attentions early on.
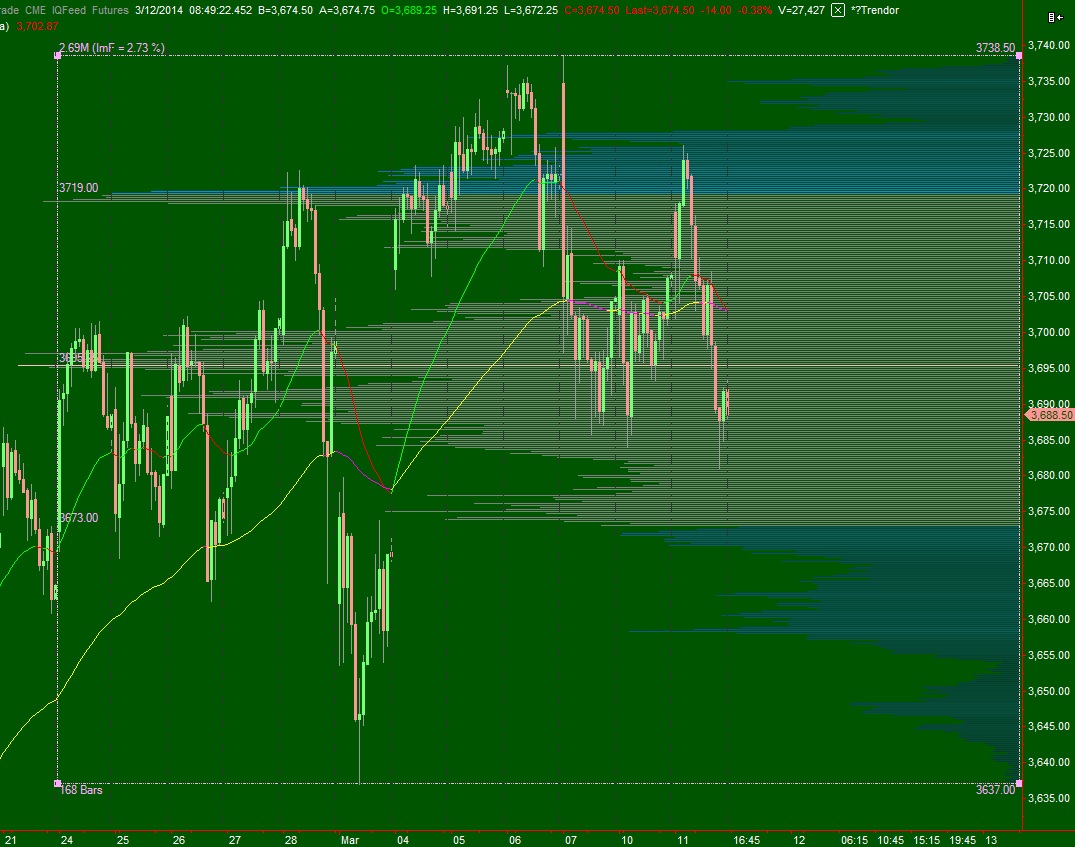
The long term auction is still in buyer control. This can be seen on the daily chart which continues to make a series of higher highs and lows. This most recent pullback, four days old, is yet to breach prior lows. It appears however the marketplace does want to back-and-fill the gap dating back to March 3rd. Seeing the futures lower in the AM hour, I suspect we may get a gap fill. If not, a bit of context would be revealed about the overall demand for equities. Also of notice is the weekly chart which printed an outside candle last week. This is a cautionary candle which can signal an inflection point especially if it sees follow through this week.
The intermediate term is in a balanced state dating back to February 24th. For some time, I thought this intermediate balance dated back to February 13th, but as the balance developed it became much more clear it started on February 24th. We blew through the intermediate term VPOC at 3695 yesterday afternoon, and with velocity like that you can expect a whip to test the lower end of intermediate term balance. I have highlighted this intermediate term balance on the following volume profile chart, from which you can draw your own relevant levels (like low volume nodes). I left it bare to make the visual of balance easier to see:
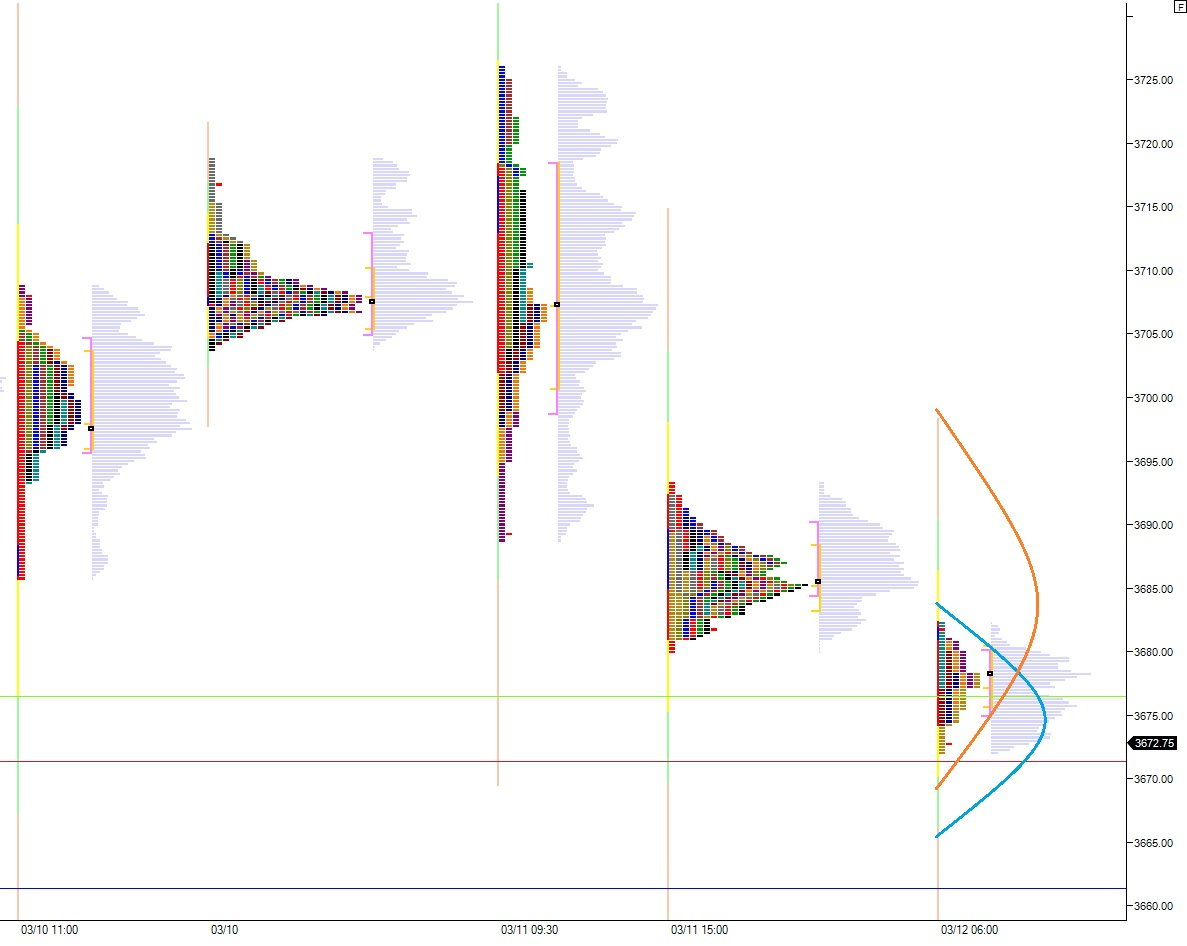
The short term auction is seller controlled. This can be seen by observing the value areas which are migrating lower so rapidly they do not overlap. Sellers like speed and volatility and they have it. I suspect we will begin to see the NASDAQ balance out a bit, especially above 3661.25. This is a naked VPOC dating back to March 3rd aka the day we left behind when we gapped higher. These long abandoned VPOCs tend to exhibit unique support abilities. If not, there is another volume cave below for sellers to push into (see intermediate term chart above). I have highlighted a few scenarios on the following market profile chart which would signal balancing:


Very nice analysis.
thank you Berserker
good day sir. thank you for the post.
you’re welcome, RVLT is a whore
Raulski, you trading the GOGO earnings this time around?
I have a small runner piece left