Today is day three of a week that has thus far produced a solid bit of follow through on the hammer reversal candle printed on the NASDAQ composite, see below:
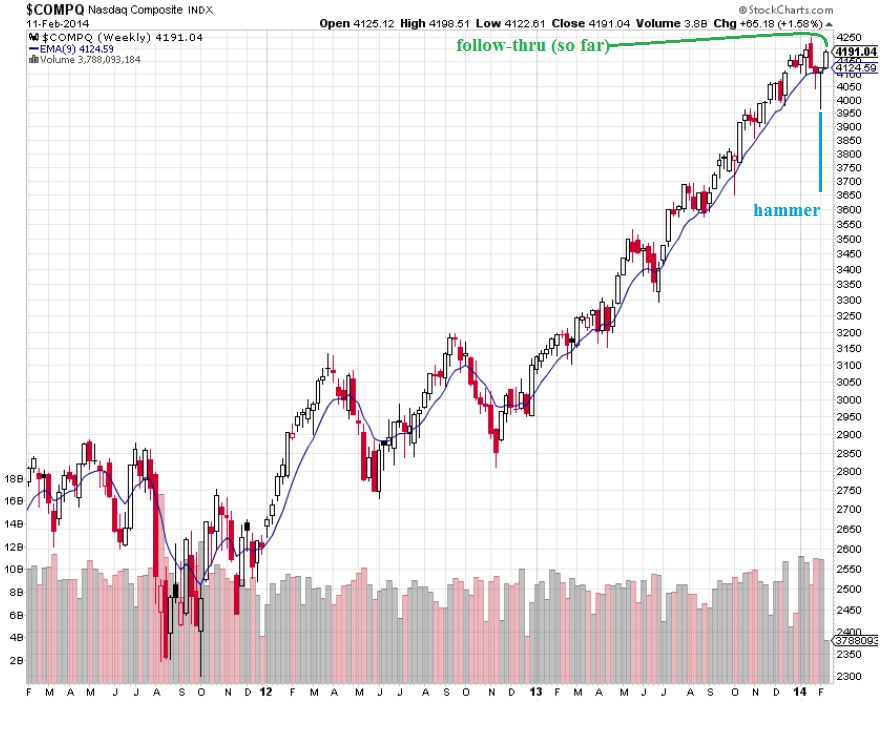
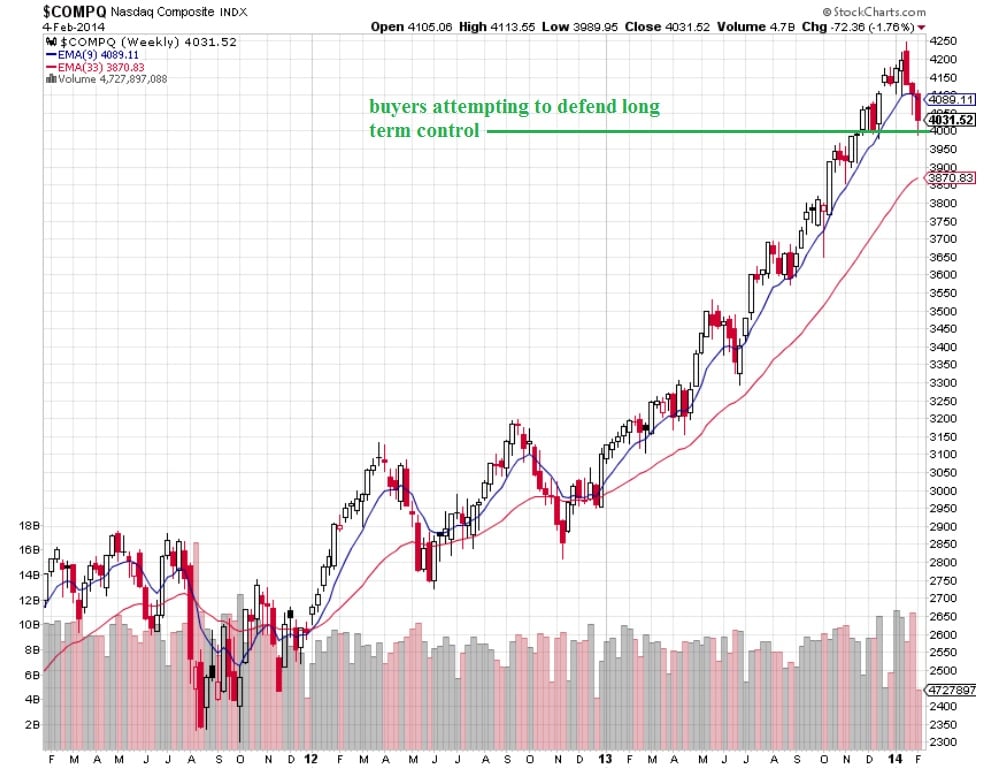
Remember, that only one week ago today, the long term control of the buyer had come into question, however we maintained that the buyer still held the control. One week ago today was the inflection point that tripped the rally:
Thus buyers remain in control of the long term auction after being put to the test last week. Once a market finds a floor, or a lowest bit, it begins the process of finding the ceiling. This is the discovery phase where price moves quickly in the opposite direction in search of excess that motivates selling. We can look for a large selling wick perhaps, or even a subtle rejection of higher priced value.
On the intermediate term, we have come into balance, however the point of control is at lower prices. Intermediate term balance dates back to January 24th. I would produce a wonderful chart of this intermediate term balance, but my primary charting platform is two days into a massive elroi optimization. Thus I must estimate intermediate term control VPOC to be around 3553.
Short term, buyers are in control. This can be seen via the migration of prices higher, aggressively. Value areas are not even overlapping yet. This is strong market activity. Before the sellers can regain control in the short term, they will first have to create some overlapping value.
I have sketched out a few scenarios for the day, as well as marked a few key price levels on the following 24-hour market profile chart:
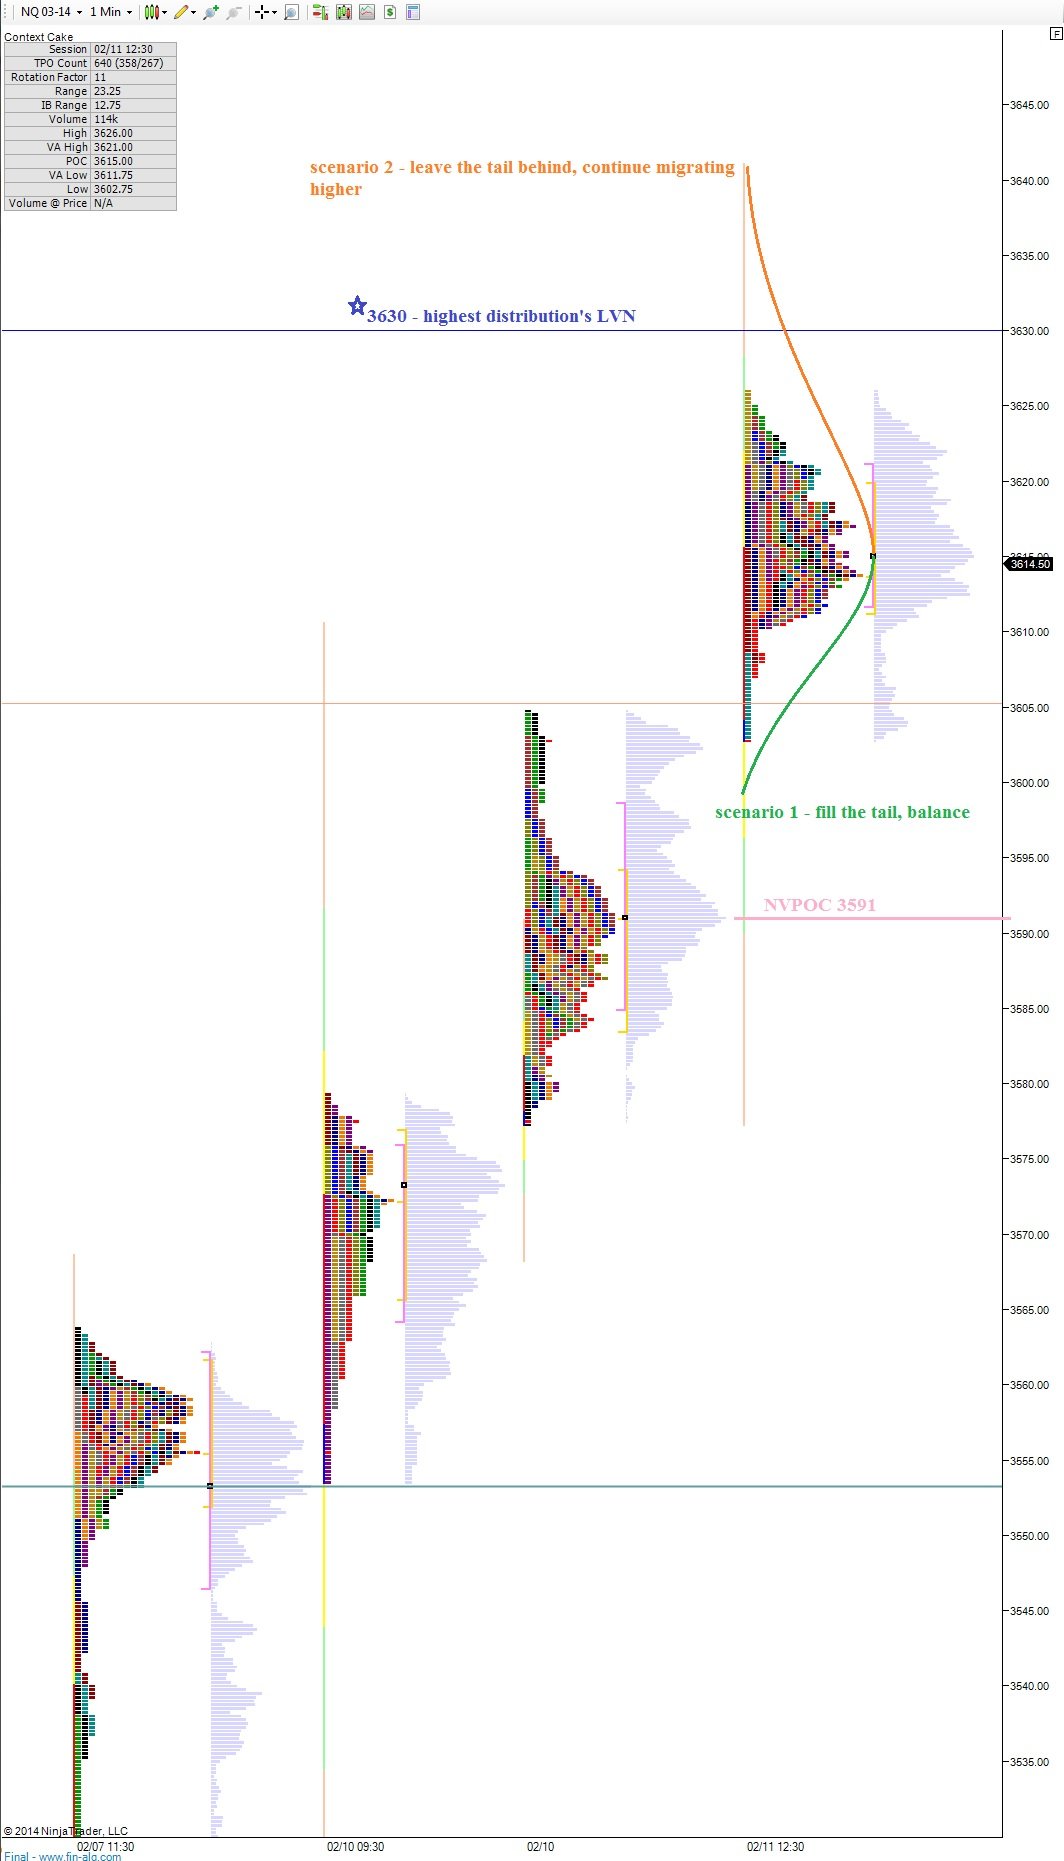


the plan is working so far.