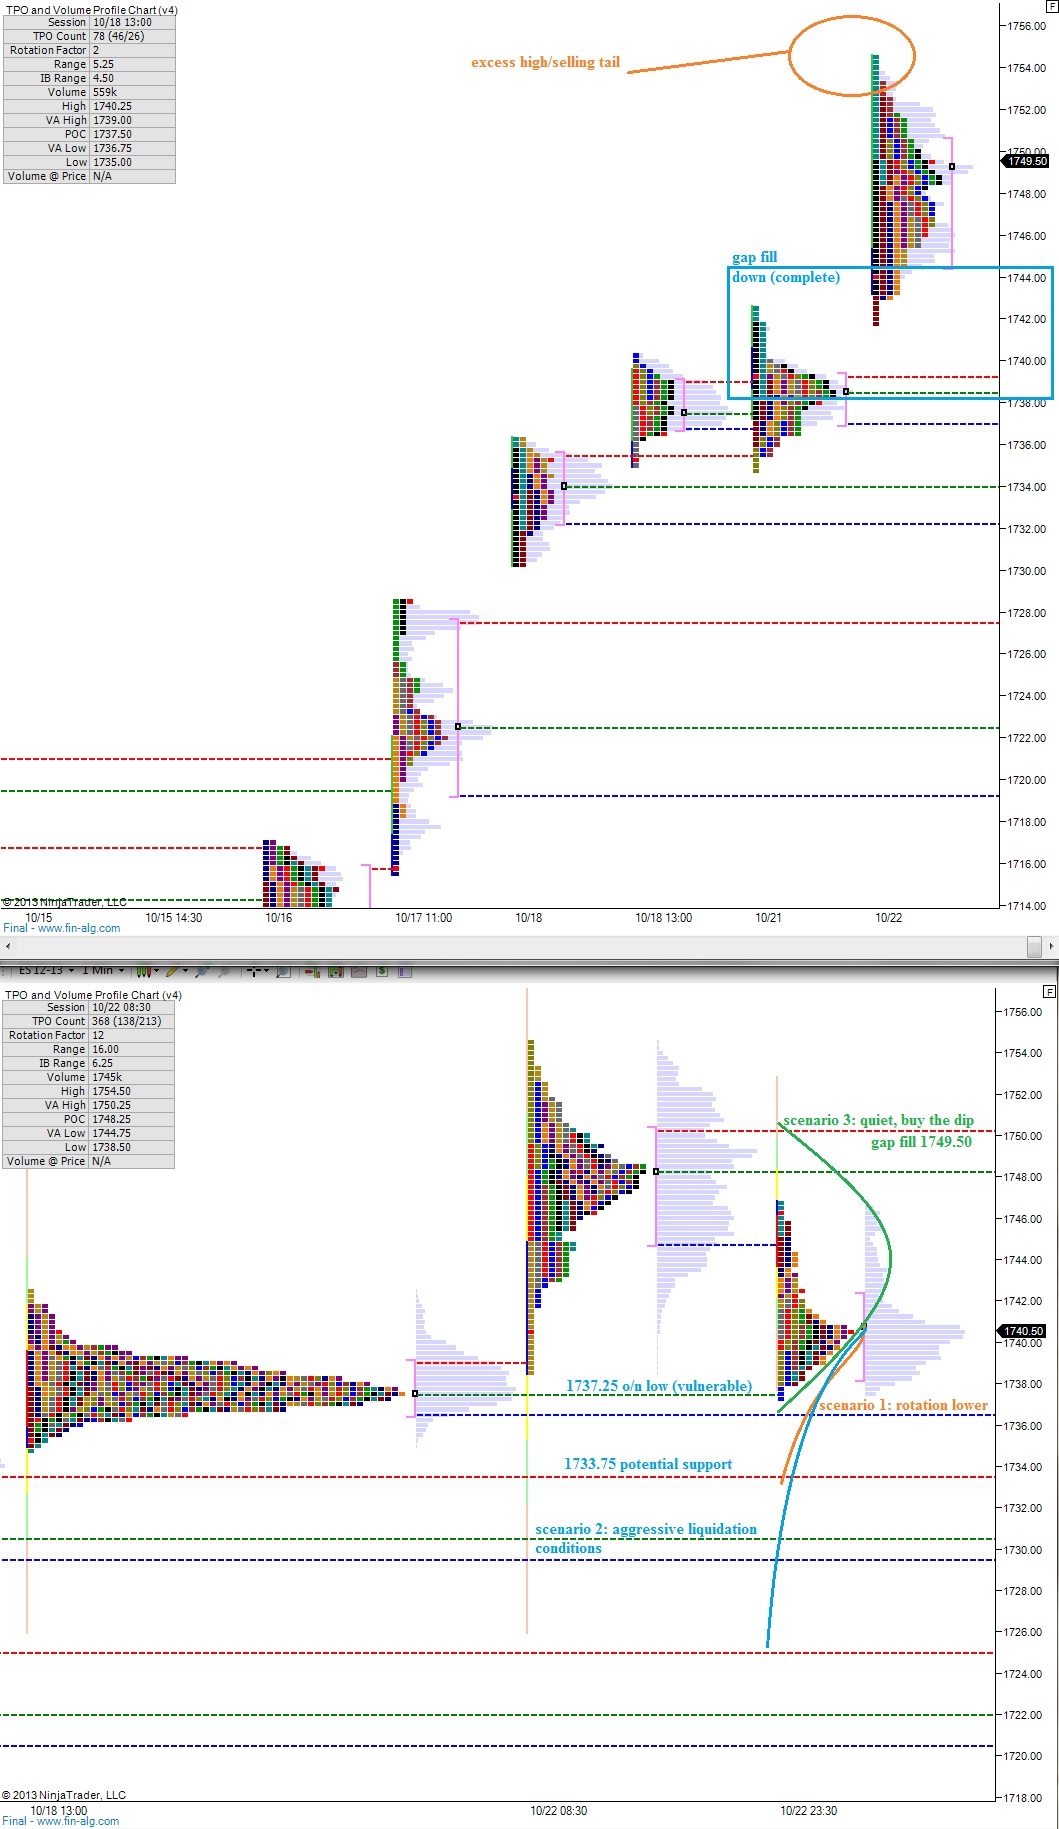
There were a few clues in the market profile print yesterday that could have clued you in to the potential for a down day to follow. The first was an excess high or selling tail printed at the top of the profile. This is represented by the single prints of TPO along the top of the profile. The prints show an aggressive seller reacting to prices deemed too rich.
The second clue was the gap that remained unfilled during our regular trading sessions. A gap-and-go type of trade rarely occurs at such elevated levels. Instead they tend to occur as a sudden burst of order flow breaks us from a long period of consolidation.
The gap down filled overnight and now we get to see if buyers are capable of filling this morning’s gap above to 1749.50. When we start getting into an environment where overnight moves increase in size, it makes sense to raise your guard and consider either hedging or elevating cash levels.
I have highlighted price levels of opportunity and also a few scenarios on the following market profile charts: