Seasonality is new to me, and like all new things in life, it brings out my childlike curiosity. This same curiosity, mind you, killed the cat. With that in mind, when I approach anything new that can impact my little purse (very homo) I like to get my hands dirty. All covered in nasty data. Okay this is getting weird. I like it.
I pulled some very basic seasonality statistics from The PPT into excel to get a sense of normality. Specifically, I analyzed the following:
Month To Date Returns – Average January Monthly Returns
The idea behind the above function was to get an idea of how far stocks have deviated from their average January returns to get a grasp of what is “normal” and what is not.

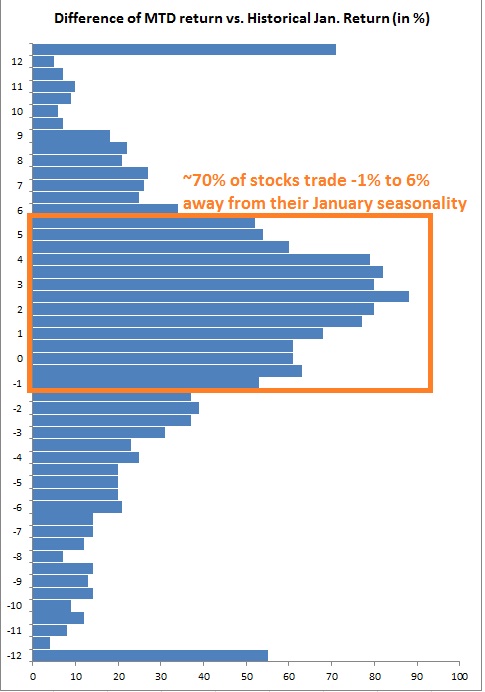
I define normal using histograms. Similar to the value areas I’ve been writing about in the mornings, I want to find where around 68% of the data falls. I consider any outliers as unique and perhaps warranting attention.
Using all PPT stocks that trade more than 500k shares on average, I built the following model:
You can see the model skewed to the high side, over the 0% line indicating an outperformance of January seasonality is happening in more stocks. Also you can see the range or value area where most performance deviations lie.
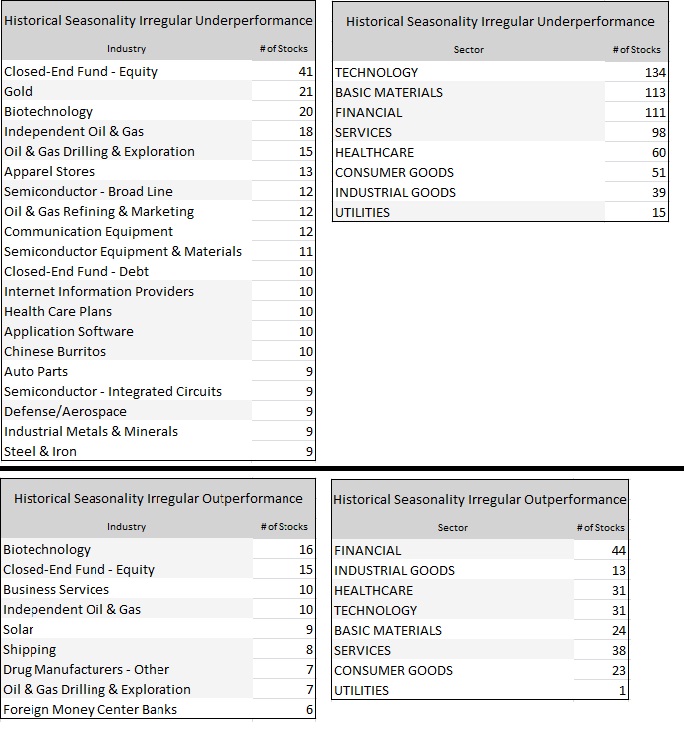
The top two tables tally the lower tail (below -1.5%) and bottom tables the upper tail (above 6%). I know, it’s backwards. You’re backwards. See below:
So what’s the play, the action? Well you can see biotech ranks high on both lists like a good lottery ticket. Fly told us this early this morning, so no insight gained there. Gold as an industry and a gaudy jewelry is failing big time in 2013, perhaps you game the mean-revision. Also note two oil industries making the underperformance list. Is our old nemesis the dollar to blame?
Turning our attention to the industries loaded with stocks outperforming the outperformers we see independent oil and gas. Just like the lottery action in biotech, the same is happening in this industry. HOWEVER, the difference is several fine folks in these halls know a thing or two about this industry. I must assure you I am not one of them. But if anyone (ehm, Fly) would like to suggest a top pick in this industry I’m all ears.
Solar made the list (obviously) and so did Business Services and Shipping. I don’t really have more to say. I’m just presenting the data to you. I would love to see some bravery and have some interpretation of the data in the comments below. Ga’head:
If you enjoy the content at iBankCoin, please follow us on Twitter


May be further categorize based on bull or bear market – or say january following a bear year or bull year. Some analysis on laggard status? This year Solars for example are great for January. Solars sucked for a long time so did rare earth stocks etc etc
Solar may have sucked for a long time but the industry averages over 2% in January seasonality. The odds are barely better than a coin toss, though.
And you’re suggesting a layer of context to determine if the relative performance is merely a temporary phenomenon like a short squeeze or long liquidation. I could see that adding value. Thanks
Nice stuff here. Love the histogram.