iBankCoin
Home / Uncategorized / A Tale Of Two Charts

A Tale Of Two Charts

The 3:30 Ramp Capital fund was created during the recovery of The Great Recession. As it has been recognized by financial institutions around the world, 3:30 Ramp Capital has been known to add a mysterious liquidity to the last 30 minutes of trading in the U.S. stock market. 3:30 Ramp Capital is disguised under the cover of High Frequency Traders and policies enacted by the Federal Reserve and Central Bankers around the world. 3:30 Ramp Capital AKA Ramp Capital, LLC AKA The Onion of Finance will always be bullish on stocks NO MATTER WHAT. #RampStamp
Joined Nov 23, 2015
71 Blog Posts

It was the best of times, it was the worst of times, it was the age of wisdom, it was the age of bullishness.  -Charles Dickens

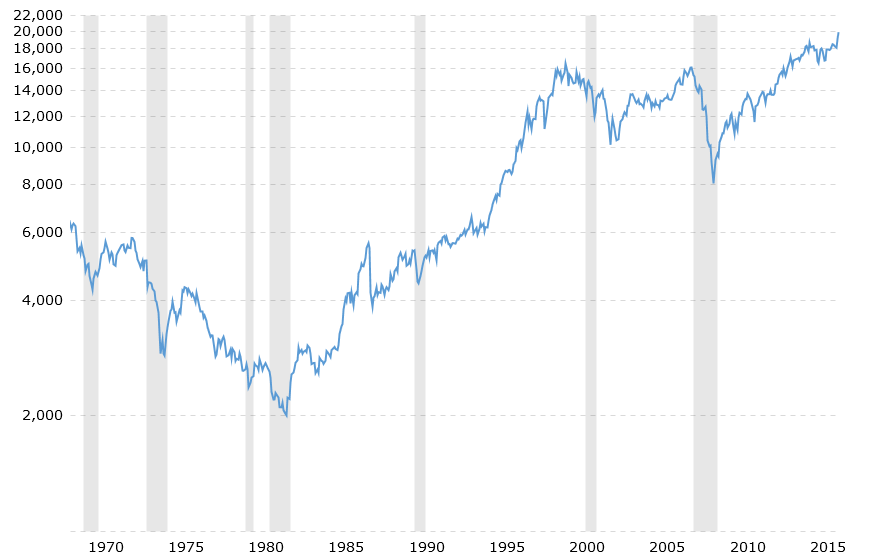
The two charts below show the US Fed Funds Rate and the Dow Jones Industrial Average from 1970-2016.  Note the area of recessions and how they coincide with peaks in the US Fed Funds rate.

capture1

dow-jones-100-year-historical-chart-2016-12-14-macrotrends

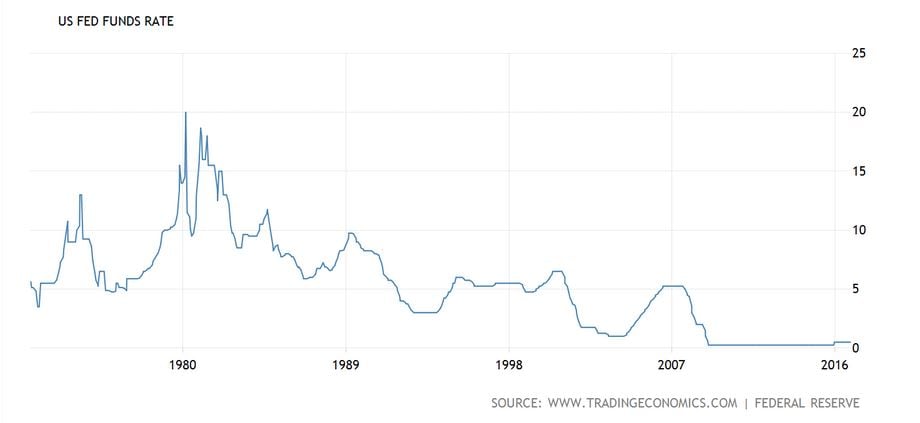
In short: We haven’t started a recession when the Fed Funds Rate was below 4-5%.  Currently we are at 0.25-0.5 bps and there is a 95% chance the Fed will raise to 0.5-0.75 bps.

Room to run?  Or is this the new normal?

If you enjoy the content at iBankCoin, please follow us on Twitter

One comment

  1. frog

    Interesting charts and stats, Ramp. Thanks for pointing this out. I don’t know what to make of it yet. But food for thought, to be sure.

    • 0
    • 0
    • 0 Deem this to be "Fake News"