iBankCoin
The first hit is always on the house.
Joined Aug 2, 2009
1,847 Blog Posts

Steady Hand

MJ

First off, if you laugh at the picture above, you are going immediately to hell.

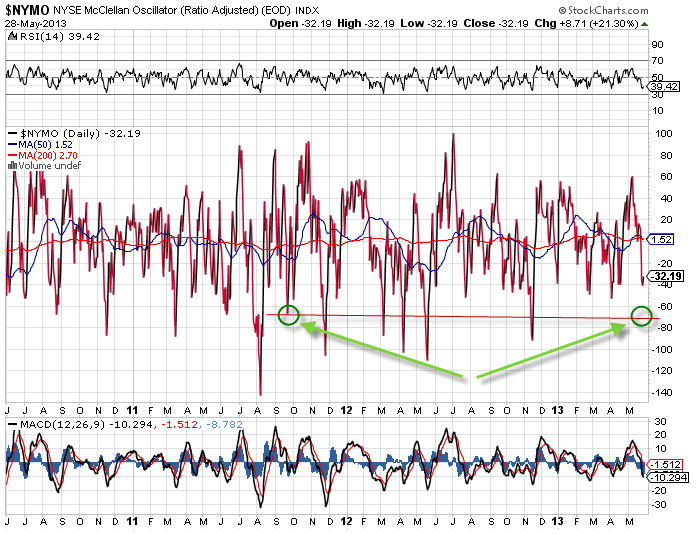
For the most part, I was a spectator of today’s tape, watching late bears get skewered into the close. My guidance here was prime, well in advance, and actionable. The McClellan is still relatively low, so into further weakness, I will start initiating a few new longs.

As I mentioned in my earlier post, focus on a few quality names for starters. The markets appetite for risk will only grow as it sees confirmation in its direction. When picking bottoms start with quality, and work your way higher. This is why despite a gain in the broad market, it felt like the Dow was down 200-300 points early on. Only quality names were up, while traders shuffled out of garbage that didn’t work out at higher price levels.

Here are a few stocks that come to mind. Quality, when compared to what I’ve been trading lately, and liquid options.

Energy: SLB, NOV, HAL

Top Tech Pick: ORCL

Industrial: CAT

Retail: UA

Bottom picks: VALE – PBR not bad either.

As requested by a few readers, here is a copy of my daily video recording from my trading room. This is an in depth review of the market and trade set-ups I am watching. It further explains some of the indicators and conditions blogged about here recently. It is a long recording, but the meat of the presentation is up front, followed by live Q&A at the end.

https://vimeo.com/67600773 – Start at the 6 minute mark or so.

Comments »

The Cycle of Risk Has Been Reset

If you are looking for stocks to rally here, don’t be the guy that runs out to buy the stock that nobody else wants to buy here.

I have to pull a quote from last Wednesday, to discuss my thoughts on the market…

In terms of the McClellan, we are not yet oversold. But here is how this usually pans out. We’ve likely seen the session lows for the day. At the same time, I doubt we see any real bullish reversal here. However, if we gap down tomorrow, and remain above 1634 in the $SPX, I am going to be a big buyer into that set-up. Those days where the market is down and the McClellan is oversold, there will usually be a divergence that takes place. Usually, it will be in Copper, the Russell, or the VIX. This means market down, but one of those three instruments is providing another signal. In every “correction” like this, that is the playbook in almost every event. Go back and look. Days where the market was down, McClellan below -80, either the Russell was up/flat, the VIX was lower than a prior high, or Copper was green that day.

Here is a quick check of that divergence…

spyrutchart

Into Friday’s sell-off, the S&P clearly took out its recent lows, while the Russell did not. In fact, neither did Copper. The VIX did take out its highs, but in terms of my divergence, 2 out of 3 signals we called out on Wednesday were right as the McClellan signaled oversold (-80 or lower). nymo0601

While it’s great to see this set-up multiple days before it happens, what’s more important is knowing what move to make from here. Yes, upside risks outweigh downside risks at this point, but don’t rush out to buy the same garbage we were buying over the last few weeks. The cycle of risk has been reset to a degree. When investors get a little rattled, they reset their risk appetite by looking for quality names. Look at an intraday chart of IBM. Check INTC, MRK, etc.

Aside from my play in SODA, I don’t see a lot of garbage stocks leading the market here. In other words, don’t line up to buy them. No one else is.

Disclaimer: I grabbed some AAPL calls just above 446 this morning.


Comments »

Top Picks: SODA, OPEN

open0531

soda0531

This might be my only contribution of the day. Catching a flight to Dallas in a few hours to present at an investor conference this weekend.

OA

Comments »

Not Looking to Chase Here

I am loaded up to the long side here, but feel there is one more test of the low end of this range coming early next week.

I mentioned at the start of the week that this consolidation would look similar to the one that started in February earlier this year. Here is what that correction looked like…

February:

FEBSPX

May:

MAYSPX

The range in February lasted roughly 10 days. I’m counting the start of this recent range from Wednesday the 22nd. I think we are in for another few days of this into mid-week next week.

This is where the McClellan might become of use, and the divergences that were discussed yesterday might materialize.

I’m not chasing much here today. I have taken two Lotto Friday positions this morning in GOOG and AMZN. These will need to be closed before the bell tomorrow, as will AAPL, GS and BIDU’s expiring this week.

Comments »

Intra-Day McClellan Readings

Per reader request, here is my method on how to acquire intra-day $NYMO readings.

You might laugh about how simple this is, but here it is. On my charting platform, which I am embarrassed to confess is Prophet, I have added the study “McClellan Oscillator.” This tool is calculated much different than the $NYMO on stockcharts, which is a ratio adjusted version that prints values EOD.

However, the Prophet version (MOSC) is calculated throughout the day, and adjusts as the number of advancing issues less the number of declining issues on the NYSE changes throughout the day. While the MOSC moves intra-day, I look for prior reference points that I can use as a reference. Using a 2yr chart, I can see that the current intraday reading aligns with the same reading as of September 22, 2011. MOSC0529

I take those two points and compare them on stockcharts…

NYMO05292

As you can see, according to stockcharts, that EOD value on 9/22 was -70. We are currently sitting at that same value. This might change through the remainder of the trading session, but it pays to know where things are, so you can anticipate what will happen next.

For the record, I give myself +/- 2 points of error when gauging these readings, and it has never failed.

OA

Comments »